 Triplex
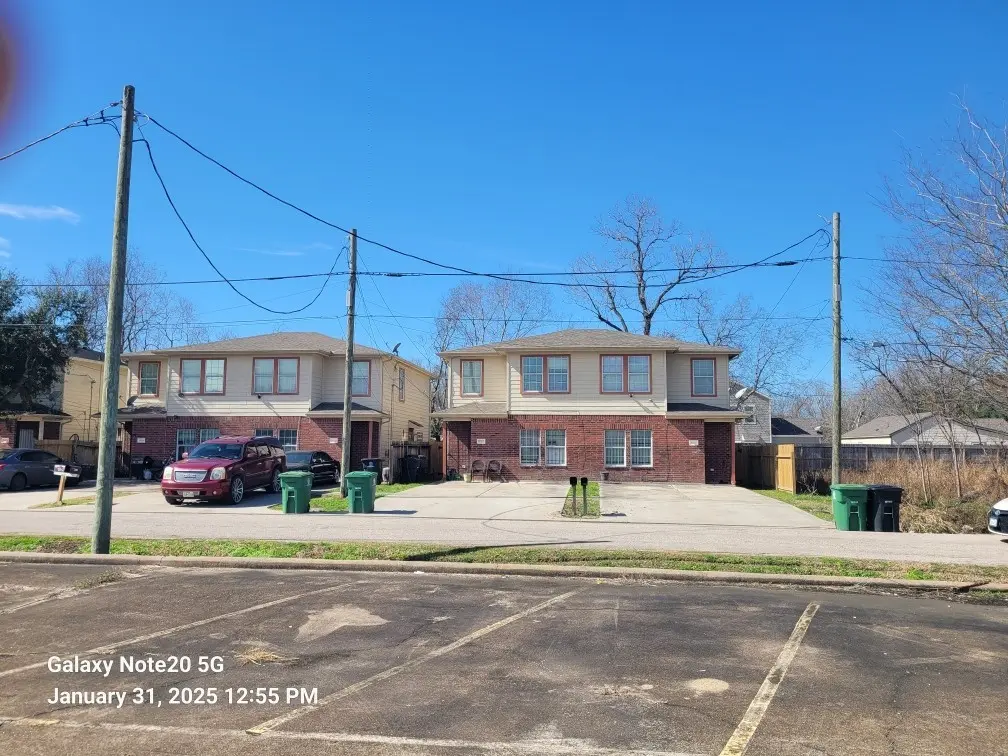
6930 A/B & 6934 A/B Paris St · Houston, TX
Flood risk 3/10 · Minor
- FEMA flood zone
- X (unshaded)
- Chance of flooding over 30 yrs
- 0.2%
- Est. flood insurance / yr
- $507 – $1,088
Fire risk 1/10 · Minimal
- Est. fire insurance / yr
- $1,222 – $2,270
Heat risk 9/10 · Severe
- Hot days now (above 109°F)
- 7 days/yr
- Hot days in 30 yrs
- 23 days/yr
Wind risk 9/10 · Severe
- Chance of severe wind over 30 yrs
- 99.0%
Air-quality risk 2/10 · Minimal
- Unhealthy air days now
- 2 days/yr
- Unhealthy air days in 30 yrs
- 2 days/yr
Risk factors via First Street. Map © Google.
Why this score? — see what drove the D grade
The composite is a weighted blend of 9 inputs, each scored 0–100. Each bar is that input's sub-score; the figure is the points it added to the 100-point composite (weight × sub-score).
- Cash flow +13.5/30.0
- ARV discount +9.1/15.0
- DSCR +4.1/10.0
- 1% rule +3.8/10.0
- Livability +3.7/5.0
- Rent growth +3.0/5.0
- Schools +2.7/10.0
- Condition / age +2.2/5.0
- Appreciation +0.0/10.0
$800,000
🖨 Deal sheet (PDF) 📄 Offer letter ✓ Due diligence
Multi-family units
County records classify this as Multi-Family (2-4 Unit). Listing-text estimate: 3 units. confirmed
Listing remarks MLS
Opportunity to owe 2 consecutive duplexes total of 4 units. Owners retired n will move out of state 4 bedrooms/2 and half baths each unit. 6930 unit A 1500 per months, long term 10 years tenants. Unit B 1500 new lease 3/2026 6934 unit A 1500 new contract 3/2026, Unit B 1500 new lease 3/2026. No hoa, no maintenance, tenants pay electric n water , no gas. Properties taxes are 6500 each building per year. Insurance fire hurricane 2000 per year each with Sagesure. Showing once contract approved. Pls do not disturb tenants. Thx. New roofs in 2020.. all new AC systems each unit upgraded to 4 tons year by year 1 vacant unit to show, all units r identical.
Key facts
- 0.23 acre lot
- Built 2006
- Listed 298 days
Neighborhood map
What this means for you Summary
Snapshot
- This is a 3 × 4-bed/?-bath units multifamily listed at $800k. Condition is rated fair.
Deal economics
- At list price, monthly cash flow is $29 ($348/yr) — positive. Per door: $10/mo.
- The deal already cash-flows at list — no discount required.
- To meet the 1% rule (rent ≥ 1% of price), the offer needs to be $704k (12.1% below list).
- Recommended offer: $704k (12.1% below list) — sets the bar for 1% rule.
- Cap rate 6.3% vs local median 3.2% in Houston — top-decile yield for the area; either an underpriced asset or a hidden risk that comps aren't pricing in. Stress-test before assuming the spread holds.
Location & tenants
- Location reads 74/100 on livability (#184 in TX, #4,771 nationally) — a middle-class / working-renter tenant base. Strengths: amenities A+, cost of living A+, housing A+; Watch: crime F.
- Houston ISD (urban): math 27% / reading 35% proficiency, ranked #593 of 826 in TX (top 72%) — families likely to look elsewhere, expect single-tenant / working-renter base with shorter leases; 71% free/reduced lunch — lower-income household profile, screen leases tightly.
- Zoned schools: Hartsfield El (math 27% / reading 22%, grade F, #3,052 of 4,322 statewide, top 74%, 303 students, 98% FRL); Cullen Middle (math 6% / reading 14%, grade F, #1,641 of 1,662 statewide, top 99%, 324 students, 100% FRL); Yates H S (math 12% / reading 23%, grade F, #1,451 of 1,632 statewide, top 89%, 851 students, 96% FRL) — zoned schools average 98% FRL vs 71% district-wide (27 pts higher); higher-poverty schools than district average — tighter screening recommended.
- Zoned-school proficiency averages 17% at this address vs 31% district-wide (-14 pts) — the specific schools serving this property underperform the Houston ISD average; the district grade overstates school quality for this exact location.
- Market conditions: Rents rising (+2.2%/yr); 472 active listings in the ZIP; 29,883 units permitted in Harris County in 2024 (8,621 in 5+ unit buildings).
- At $7,035/mo this rent would consume 185% of the median local household income ($46k/yr) (locally 2532% of renters already pay >50% of income on rent) — very limited rent-growth headroom before tenants either downsize or default.
Forward outlook
- Local home prices are declining (-3.0%/yr); year-one equity from $6k of loan paydown is wiped out by about $24k of value loss. Plan a longer hold.
- Harris County population projected at +47% by 2050 — long-run rental-demand tailwind backs the buy-and-hold thesis.
Negotiation context
- It's been on market 299 days — a 12% lower offer ($704k) is reasonable based on typical stale-listing flexibility.
- 2 sale attempts with the ask held roughly flat each time — persistent listings suggest the price (not the market) is what's stuck; bring a comps-based counter.
Risks & watch-outs
- Climate carrying-cost: severe wind risk, 99% chance of damaging wind over 30y; extreme-heat days projected 7→23/yr by 2055 (HVAC capex compounding) — expect insurance premiums to compound above CPI over the hold.
Questions for the listing agent
- It's been on market 299 days. Have you received any prior offers? Is the seller open to a 12% concession, seller financing, or rate buy-down credit?
- Can we see the unit-by-unit rent roll, current vacancy, and any below-market leases? What's the average tenancy length?
- What capital expenditures (roof, boiler, parking lot, exteriors) have been made in the last 5 years, and what's planned in the next 2?
- Have any recent inspections been done? Can we get a copy of the seller's disclosures and any deferred-maintenance estimates?
- Why hasn't it sold? Are there any deal-killer items the seller is aware of (foundation, flood, title, zoning, code violations)?
- Is there a deadline driving the sale (1031 exchange, divorce, estate, relocation)? That informs how much negotiation room exists.
- Schools are D-rated, which usually means shorter tenancies and higher turnover. Who's the typical renter profile here, and what's been the actual vacancy rate?
- Crime grade is F in this area — have there been break-ins, vandalism, or insurance claims at this property in the last 3 years? What carrier currently insures it and at what premium?
- The area grade is low — what's the realistic commute time and amenity access for the typical tenant pool here? Any planned neighborhood developments (good or bad) we should know about?
- What's the average days-on-market for RENTAL listings here right now (not sales)? A rising rental-DOM trend means longer vacancies and softer asking-rent achievability than the comps imply.
- What's the recent tenant-quality profile in this submarket — average credit score on applications, eviction rate, late-payment / NSF rate, and stable-employment percentage? A property-management company in the area should have these aggregated.
- How much new apartment / multifamily construction is in the pipeline within 1–3 miles? Heavy new supply (>2% of stock underway) typically softens rents 12–24 months out; light construction supports rent growth.
Investment metrics
- 1% rule
- 0.88% ✗
- Cap rate
- 6.34%
- Cash-on-cash
- 0.16%
- DSCR
- 1.01
- GRM
- 9.5
CMA / ARV
- ARV (median comp)
- $829,717
- List price
- $800,000
- Delta
- -3.58%
- Verdict
- FAIR
- Comps
- 4 within 1.0 mi
Show comp detail 1 sale within ~0.75 mi
| Address | Dist | Beds/Ba | Sqft | Sold | Price | $/sf | Match |
|---|---|---|---|---|---|---|---|
| 6532 & 6528 Weston St | 0.49mi | 12/3.0 | 5,364 (-10%) | 15mo | $1,050,000 | $196 | 30 |
Match score weights: distance 35% · size 25% · config 20% · recency 20%. Top-matched comps best support the ARV.
Projected returns pro-forma
-3.0% appreciation · 2.17% rent growth · sell at horizon
- IRR
- -17.0%
- Equity multiple
- 0.40×
- Total profit
- $-133,507
- Equity at exit
- $119,283
- IRR
- -10.4%
- Equity multiple
- 0.39×
- Total profit
- $-136,958
- Equity at exit
- $69,169
Cash invested: $224,000 (down + closing). Projections, not guarantees.
Landlord ↔ Tenant lean methodology
- Overall (STATE)
- 87 Strongly Landlord-Friendly
- State Texas
- 87 Strongly Landlord-Friendly · R+5
- County
- — inherits STATE
- City
- — inherits STATE
ZIP-level market 77021
- Home prices YoY
- -23.6%
- Rents YoY
- 2.2%
- Active inventory
- 472
- Price-to-rent
- 28.4×
Monthly cashflow live
- Estimated rent
- $7,035 high interval (Pro) →
- Mortgage (P&I)
- −$4,195
- Tax est. 1.5%
- −$1,000 /mo · $12,000/yr
- Insurance
- −$333
- HOA
- −$0
- Vacancy / Maint / Mgmt
- −$1,477
- Net cashflow
- $29
Break-even live
Sensitivity live
| Price | -10% $582 | -5% $305 | +0% $29 | +5% $-247 | +10% $-524 |
|---|---|---|---|---|---|
| Rent | -10% $-527 | -5% $-249 | +0% $29 | +5% $307 | +10% $585 |
| Rate | -1.0pp $432 | -0.5pp $233 | base $29 | +0.5pp $-178 | +1.0pp $-389 |
3-unit breakdown (identical units grouped — click to expand)
| Units | Beds | Baths | Est. rent |
|---|---|---|---|
| 3× units | 4 | — | $7,035 |
| #1 | 4 | — | $2,345 |
| #2 | 4 | — | $2,345 |
| #3 | 4 | — | $2,345 |
| Total (3 units) | $7,035 | ||
UW: 25.0% down · 7.5% · 30yr · 1.5% tax · 5.0% vac · 8.0% maint · 8.0% mgmt
Financing live
Cash to close
- Down payment
- $200,000
- Closing costs
- $24,000
- Reserves months
- —
- Total cash needed
- —
Loan-product check · same deal, 3 products live
Conventional
25% down · 7.5% · 30yr
- Down + closing
- —
- Monthly P&I
- —
- Monthly cashflow
- —
- DSCR
- —
- Eligible?
- —
Personal DTI + credit; lowest rate.
DSCR
20% down · 8.5% · 30yr
- Down + closing
- —
- Monthly P&I
- —
- Monthly cashflow
- —
- DSCR
- —
- Eligible?
- —
No personal income docs; deal must DSCR.
Hard money
10% down · 12.0% · 12mo
- Down + closing
- —
- Monthly P&I
- —
- Monthly cashflow
- —
- DSCR
- —
- Eligible?
- —
Short-term bridge; refi at stabilization.
Listing history 7 events
-
2026-06-04days on market $800,000 Active 299 DOM
-
2026-06-01days on market $800,000 Active 296 DOM
-
2026-05-31days on market $800,000 Active 295 DOM
-
2025-09-05status Active 669-char remark
Show marketing remark (669 chars)
Opportunity to owe 2 consecutive duplexes total of 4 units. Owners retired n will move out of state 4 bedrooms/2 and half baths each unit. 6930 unit A 1500 per months, long term 10 years tenants. Unit B 1500 new lease 3/2026 6934 unit A 1500 new contract 3/2026, Unit B 1500 new lease 3/2026. No hoa, no maintenance, tenants pay electric n water , no gas. Properties taxes are 6500 each building per year. Insurance fire hurricane 2000 per year each with Sagesure. Showing once contract approved. Pls do not disturb tenants. Thx. New roofs in 2020.. all new AC systems each unit upgraded to 4 tons year by year 1 vacant unit to show, all units r identical.
-
2025-03-03historical 669-char remark
Show marketing remark (669 chars)
Opportunity to owe 2 consecutive duplexes total of 4 units. Owners retired n will move out of state 4 bedrooms/2 and half baths each unit. 6930 unit A 1500 per months, long term 10 years tenants. Unit B 1500 new lease 3/2026 6934 unit A 1500 new contract 3/2026, Unit B 1500 new lease 3/2026. No hoa, no maintenance, tenants pay electric n water , no gas. Properties taxes are 6500 each building per year. Insurance fire hurricane 2000 per year each with Sagesure. Showing once contract approved. Pls do not disturb tenants. Thx. New roofs in 2020.. all new AC systems each unit upgraded to 4 tons year by year 1 vacant unit to show, all units r identical.
-
2025-02-04$800,000 Active 669-char remark
Show marketing remark (669 chars)
Opportunity to owe 2 consecutive duplexes total of 4 units. Owners retired n will move out of state 4 bedrooms/2 and half baths each unit. 6930 unit A 1500 per months, long term 10 years tenants. Unit B 1500 new lease 3/2026 6934 unit A 1500 new contract 3/2026, Unit B 1500 new lease 3/2026. No hoa, no maintenance, tenants pay electric n water , no gas. Properties taxes are 6500 each building per year. Insurance fire hurricane 2000 per year each with Sagesure. Showing once contract approved. Pls do not disturb tenants. Thx. New roofs in 2020.. all new AC systems each unit upgraded to 4 tons year by year 1 vacant unit to show, all units r identical.
-
2023-07-14historical
ⓘ Source: listings_history table (triggers on properties + properties_extension) + one-shot
backfill from property_details.listing_events for pre-trigger history.
Climate risk First Street
- Flood 3/10 Moderate FEMA zone X (unshaded) · 20% chance over 30 yrs
- Wildfire 1/10 Low
- Heat 9/10 Extreme 7 d/yr ≥109°F today · 23 d/yr by 30 yrs out
- Wind 9/10 Extreme 99% chance of damaging wind over 30 yrs
- Air quality 2/10 Low 2 unhealthy d/yr today · 2 by 30 yrs out
Nearby sold comps map
Loading sold comps map…
Walkable amenities ~0.75 mi
Loading nearby amenities…
Taxation est. · year 1
- Rental income
- $84,420
- − Mortgage interest
- −$44,812
- − Property taxes
- −$12,000
- − Insurance
- −$4,000
- − Repairs & maintenance
- −$6,754
- − Management
- −$6,754
- − Depreciation
- −$23,273
- Taxable loss
- −$13,172
- Est. tax savings @ 24.0%
- +$3,161
- After-tax cash flow
- $3,510/yr
For passive investors: Depreciation is non-cash, so a rental often shows a tax loss while cash-flowing — sheltering income. Rental losses are passive: they offset passive income freely, and up to $25,000/yr can offset ordinary (W-2) income if you actively participate and your MAGI is under $100k (phasing out to $0 by $150k); unused losses carry forward. On sale, claimed depreciation is recaptured at up to 25%, and gains may owe capital-gains tax (a 1031 exchange can defer both). Figures are a year-1 estimate at your 24.0% rate — not tax advice; consult a CPA.
Condition & rehab AI · 13 photos
The property is in fair condition with some minor repairs and maintenance needed. Painting and landscaping improvements can significantly increase its value.
Repairs flagged
- Minor Paint — Paint appears to be in good condition with no visible damage.
- Minor Landscaping — Basic landscaping with a wooden fence and some grass.
Value-add opportunities
- Both Painting the exterior and interior — Painting can enhance the curb appeal and interior aesthetics, making the property more attractive to potential buyers and renters.
- Both Landscaping improvements — Improving the landscaping can enhance the curb appeal and make the property more attractive to potential buyers and renters.
Renovation cost estimate screening
| Repair item | Severity | Est. cost |
|---|---|---|
| Paint · Paint appears to be in good condition with no visible damage. | Minor | $500–3,000 |
| Landscaping · Basic landscaping with a wooden fence and some grass. | Minor | $500–3,000 |
| Total estimated repair cost · 2 items | $1,000–6,000 |
Value-add ROI direction
- Both Painting the exterior and interior — Painting can enhance the curb appeal and interior aesthetics, making the property more attractive to potential buyers and renters. ↑
- Both Landscaping improvements — Improving the landscaping can enhance the curb appeal and make the property more attractive to potential buyers and renters. ↑
ⓘ Cost ranges are severity-bucket heuristics (US national rule-of-thumb). Get contractor quotes + a written scope before underwriting a rehab budget.
Schools (NCES district)
- District
- Houston ISD
- NCES district ID
- 4823640
- Math proficiency
- 27% ▼ -18.00%
- Reading proficiency
- 35% ▼ -6.00%
- Median HH income
- $46,054
- Composite
- 26.63/100
- National rank
- #7173
- State rank
- #593 of 826 in TX
Livability — Houston
- Score
- 74/100
- State rank
- #184
- US rank
- #4771
Category grades
Schools grade is shown separately in the Schools card above.
Census & demographics
- Census place
- Houston, TX
- County
- Harris County · 4,702,590 people
- City population
- 3,226,434
- Metro
- Houston-The Woodlands-Sugar Land, TX
- Population (ZIP)
- 26,153
- Household income
- $45,574
- Rent vs Own
- Severe rent burden
- 2532.0
Population outlook (Harris County) Hauer SSP2
- Today (2025)
- 5,571,493 people
- By 2030
- 6,089,821 · +9.3%
- By 2040
- 7,142,806 · +28.2%
- By 2050
- 8,185,864 · +46.9%
- By 2075
- 10,574,329 · +89.8%
- By 2100
- 12,109,958 · +117.4%
Race, ethnicity, and origin ACS 2023
- Neighborhood character
- Diverse neighborhood (Simpson 0.55)
- Race & ethnicity
- Black 62% Hispanic / Latino 22% Two or more races 12% White 10% Asian 2%
- Hispanic origin (detail)
- Mexican 15%
- Common ancestry
- Italian 1% Romanian 1% Lithuanian 1%
- Foreign-born
- 11% · Canada
- Languages at home
- 77% English-only · Spanish 19% French/Haitian/Cajun 1% Other Indo-European 1%
Political lean MEDSL · Harris
- 2024 margin
- Lean D (+5.5) · D 52.0% · R 46.4% · Other 1.6%
- 2008→2024 swing
- +3.9pp toward D · 2008: 1.6pp · 2024: 5.5pp
- All cycles
- 2024: D+5.5 2020: D+13.3 2016: D+12.4 2012: D+0.1 2008: D+1.6
Not yet ingested
- Civics
- —
Market trends
- HPI YoY
- ▼ -71.22%
- Current HPI
- 230.2869
- Rent YoY
- ▲ 2.17%
- Metro
- Houston-The Woodlands-Sugar Land, TX
- State GDP YoY
- ▲ 3.95%
- F500 in state
- 110
Industry mix (Fortune 500 HQ in TX)
| Industry | F500 HQs | Revenue |
|---|---|---|
| Energy | 16 | $1,198B |
|
||
| Technology | 5 | $198B |
|
||
| Engineering / Construction | 4 | $72B |
|
||
| Energy Services | 3 | $60B |
|
||
| Utilities | 3 | $41B |
|
||
| Healthcare | 2 | $330B |
|
||
Price history
4 events — show timeline
- 2025-09-05 Relisted — HARMLS
- 2025-03-03 Listing Removed — HARMLS
- 2025-02-04 Listed $800,000 HARMLS
- 2023-07-14 Rental Removed — HARMLS
Cash-flow waterfall
monthlySold comps — $/sqft
last 12 mo · ≤1 miLoading sold comps…