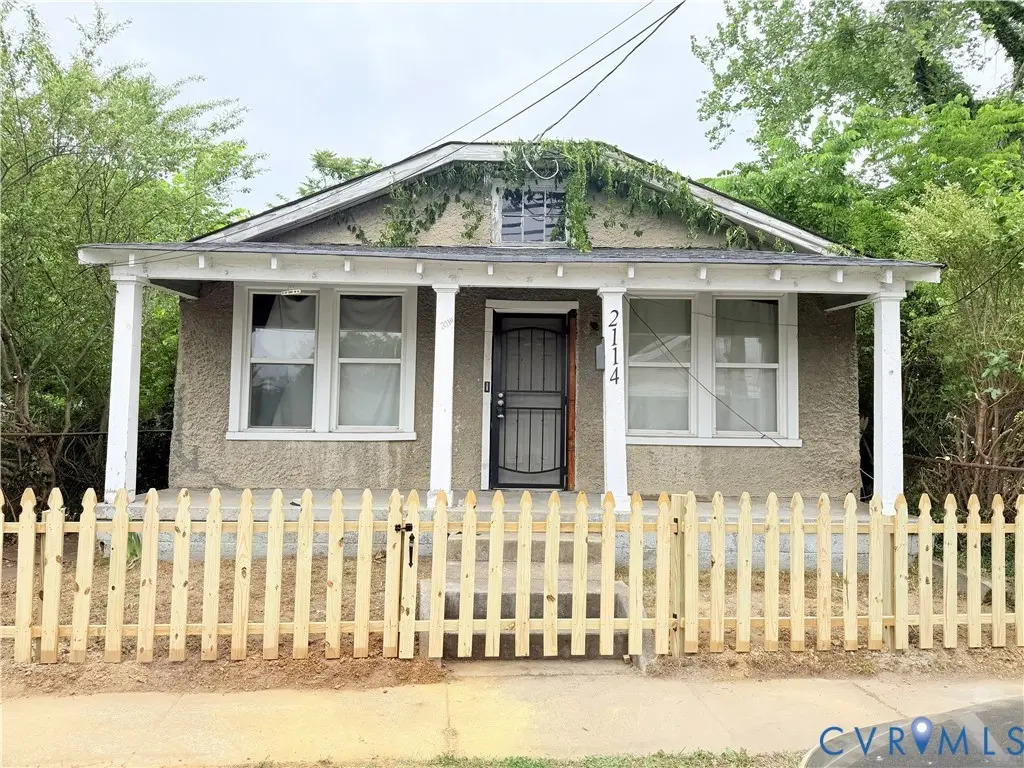
2114 Selden St · Richmond, VA
Flood risk 1/10 · Minimal
- FEMA flood zone
- X (unshaded)
- Chance of flooding over 30 yrs
- 0.0%
- Est. flood insurance / yr
- $507 – $1,088
Fire risk 1/10 · Minimal
- Est. fire insurance / yr
- $666 – $1,236
Heat risk 8/10 · Major
- Hot days now (above 105°F)
- 7 days/yr
- Hot days in 30 yrs
- 16 days/yr
Wind risk 6/10 · Moderate
- Chance of severe wind over 30 yrs
- 27.0%
Air-quality risk 2/10 · Minimal
- Unhealthy air days now
- 1 days/yr
- Unhealthy air days in 30 yrs
- 3 days/yr
Risk factors via First Street. Map © Google.
Why this score? — see what drove the B grade
The composite is a weighted blend of 9 inputs, each scored 0–100. Each bar is that input's sub-score; the figure is the points it added to the 100-point composite (weight × sub-score).
- Cash flow +26.5/30.0
- ARV discount +15.0/15.0
- DSCR +9.0/10.0
- 1% rule +6.2/10.0
- Livability +4.2/5.0
- Rent growth +4.1/5.0
- Schools +3.3/10.0
- Condition / age +2.5/5.0
- Appreciation +0.0/10.0
$139,000
🖨 Deal sheet 📄 Offer letter ✓ Due diligence
Listing remarks
Under $150K! Investor or renovation opportunity in Richmond! 2114 Selden St offers 3 bedrooms, 2 full bathrooms with 1,212 sq ft and has plenty of upside for a flip, rental, or owner-occupant looking to build equity. This Investor special already has New vinyl windows installed in 2024 and a new roof installed in 2024. The home features a covered front porch, fenced front yard, spacious rear yard, off-street parking potential. Property does need a fair amount of work and is being sold AS-IS. Seller will make no repairs. Cash, hard money, renovation preferred. Great opportunity to add value in the Richmond market and build your rental portfolio. Short term Owner financing is potentially avai
Key facts
- Covered front porch
- Spacious rear yard
- New vinyl windows
Tags
Property features AI
Exterior
- Utilities: Public water; Public sewer
- Home design: Single-story home; Above-grade finished living area approx. 1,212
- Construction: Frame, stucco and vinyl siding construction; Shingle roof; Actual year built reported
- Exterior features: Front porch
Interior
- Bedrooms: Total rooms: 7
- Bathrooms: 2 full bathrooms; One full bath includes a shower; One full bath on the first level
- Heating & cooling: Electric heating; Window air conditioning units
- Interior features: Resale condition
Neighborhood map
What this means for you Summary
Snapshot
- This is a 3-bed/1.0-bath single-family listed at $139k.
Deal economics
- At list price, monthly cash flow is $368 ($4k/yr) — positive.
- The deal already cash-flows at list — no discount required.
- Meets the 1% rule at list price ($2k rent vs $139k).
- Recommended offer: $135k (3.0% below list) — sets the bar for market timing.
- Cap rate 9.5% vs local median 3.3% in Richmond — top-decile yield for the area; either an underpriced asset or a hidden risk that comps aren't pricing in. Stress-test before assuming the spread holds.
Location & tenants
- Location reads 84/100 on livability (#33 in VA, #793 nationally) — a professional / high-income tenant draw. Strengths: amenities A+, commute A+, health & safety A+; Watch: crime D-.
- Richmond City Public School District (urban): math 32% / reading 47% proficiency, ranked #123 of 131 in VA (top 94%) — families likely to look elsewhere, expect single-tenant / working-renter base with shorter leases; 74% free/reduced lunch — lower-income household profile, screen leases tightly.
- Market conditions: Rents rising fast (+6.4%/yr); 337 active listings in the ZIP; 40 comparable units currently listed for rent nearby; rentals at typical pace (median 17d on market — plan ~3-4 weeks tenant-placement turnaround); 2,540 units permitted in Richmond city in 2024 (2,077 in 5+ unit buildings).
- This rent runs 33% of the median local income ($56k/yr) — at the standard rent-burdened threshold; future hikes will face affordability resistance.
Forward outlook
- Local home prices are declining (-3.0%/yr); year-one equity from $961 of loan paydown is wiped out by about $4k of value loss. Plan a longer hold.
- Richmond County population projected at +40% by 2050 — long-run rental-demand tailwind backs the buy-and-hold thesis.
- At projected returns (-3.0% appreciation + 6.4% rent growth), your $39k cash investment doubles in ~8 years — after that, you're playing with house money.
Negotiation context
- It's been on market 49 days — a 3% lower offer ($135k) is reasonable based on typical stale-listing flexibility.
- 6 sale attempts since 22y ago with the ask held roughly flat each time — persistent listings suggest the price (not the market) is what's stuck; bring a comps-based counter.
- Current owner paid $39k; list at $139k implies a 256% gain — meaningful room to come down on a strong offer.
Risks & watch-outs
- Watch-outs: built in 1920 — expect roof / HVAC / electrical / plumbing capex.
- Climate carrying-cost: major wind risk, 27% chance of damaging wind over 30y; extreme-heat days projected 7→16/yr by 2055 (HVAC capex compounding) — expect insurance premiums to compound above CPI over the hold.
Questions for the listing agent
- It's been on market 49 days. Have you received any prior offers? Is the seller open to a 3% concession, seller financing, or rate buy-down credit?
- Built in 1920 — when were the roof, HVAC, electrical panel, plumbing, and water heater last replaced?
- Is there a deadline driving the sale (1031 exchange, divorce, estate, relocation)? That informs how much negotiation room exists.
- Schools are A-rated — typically a magnet for longer-tenancy family renters. What's the average tenant stay here, and is there a school-zone premium baked into asking?
- Crime grade is D in this area — have there been break-ins, vandalism, or insurance claims at this property in the last 3 years? What carrier currently insures it and at what premium?
- What's the average days-on-market for RENTAL listings here right now (not sales)? A rising rental-DOM trend means longer vacancies and softer asking-rent achievability than the comps imply.
- What's the recent tenant-quality profile in this submarket — average credit score on applications, eviction rate, late-payment / NSF rate, and stable-employment percentage? A property-management company in the area should have these aggregated.
- How much new for-sale + rental construction is in the pipeline within 1–3 miles? Heavy new supply typically softens prices + rents 12–24 months out; constrained supply supports both.
Investment metrics
- 1% rule
- 1.12% ✓
- Cap rate
- 9.47%
- Cash-on-cash
- 11.34%
- DSCR
- 1.50
- GRM
- 7.5
CMA / ARV
- ARV (median comp)
- $222,743
- List price
- $139,000
- Delta
- -37.60%
- Verdict
- UNDERPRICED
- Comps
- 20 within 1.0 mi
Show comp detail 12 sales within ~0.75 mi
| Address | Dist | Beds/Ba | Sqft | Sold | Price | $/sf | Match |
|---|---|---|---|---|---|---|---|
| 1711 Rogers St | 0.27mi | 2/1.0 (-1) | 1,044 (-4%) | 3mo | $235,000 | $225 | 73 |
| 2214 Beau Ln | 0.46mi | 3/2.0 | 1,066 (-2%) | 2mo | $295,000 | $277 | 69 |
| 2500 Ford Ave | 0.48mi | 3/1.0 | 1,007 (-8%) | 1mo | $134,900 | $134 | 64 |
| 1804 N 25th St | 0.34mi | 3/2.0 | 988 (-10%) | 2mo | $298,000 | $302 | 62 |
| 2009 X St | 0.28mi | 3/1.0 | 1,245 (+14%) | 2mo | $216,000 | $173 | 61 |
| 1905 N 28th St | 0.47mi | 3/2.0 | 1,008 (-8%) | 0mo | $260,000 | $258 | 61 |
| 2408 Ford Ave | 0.53mi | 3/1.0 | 1,007 (-8%) | 3mo | $165,000 | $164 | 60 |
| 1905 Redwood Ave | 0.56mi | 3/1.0 | 1,007 (-8%) | 1mo | $180,500 | $179 | 60 |
| 1513 N 30th St | 0.73mi | 3/1.0 | 1,080 (-1%) | 6mo | $275,000 | $255 | 58 |
| 1829 N 29th St | 0.56mi | 2/1.0 (-1) | 1,167 (+7%) | 0mo | $126,000 | $108 | 57 |
| 2000 Holly St | 0.44mi | 3/1.0 | 956 (-12%) | 4mo | $247,000 | $258 | 56 |
| 2002 Conrad St | 0.56mi | 3/2.0 | 1,007 (-8%) | 2mo | $260,000 | $258 | 55 |
Match score weights: distance 35% · size 25% · config 20% · recency 20%. Top-matched comps best support the ARV.
Projected returns pro-forma
-3.0% appreciation · 6.38% rent growth · sell at horizon
- IRR
- 4.1%
- Equity multiple
- 1.16×
- Total profit
- $6,310
- Equity at exit
- $20,725
- IRR
- 16.3%
- Equity multiple
- 2.53×
- Total profit
- $59,485
- Equity at exit
- $12,018
Cash invested: $38,920 (down + closing). Projections, not guarantees.
Landlord ↔ Tenant lean methodology
- Overall (STATE)
- 55 Moderately Landlord-Leaning
- State Virginia
- 55 Moderately Landlord-Leaning · D+2
- County
- — inherits STATE
- City
- — inherits STATE
ZIP-level market 23223
- Rents YoY
- 6.4%
- Active inventory
- 337
- Price-to-rent
- 7.5×
Monthly cashflow live
- Estimated rent
- $1,551 high interval (Pro) →
- Mortgage (P&I)
- −$729
- Tax from tax record
- −$71 /mo · $852/yr
- Insurance
- −$58
- HOA
- −$0
- Vacancy / Maint / Mgmt
- −$326
- Net cashflow
- $368
Break-even live
UW: 25.0% down · 7.5% · 30yr · 1.5% tax · 5.0% vac · 8.0% maint · 8.0% mgmt
Financing live
Cash to close
- Down payment
- $34,750
- Closing costs
- $4,170
- Reserves months
- —
- Total cash needed
- —
Loan-product check · same deal, 3 products live
Conventional
25% down · 7.5% · 30yr
- Down + closing
- —
- Monthly P&I
- —
- Monthly cashflow
- —
- DSCR
- —
- Eligible?
- —
Personal DTI + credit; lowest rate.
DSCR
20% down · 8.5% · 30yr
- Down + closing
- —
- Monthly P&I
- —
- Monthly cashflow
- —
- DSCR
- —
- Eligible?
- —
No personal income docs; deal must DSCR.
Hard money
10% down · 12.0% · 12mo
- Down + closing
- —
- Monthly P&I
- —
- Monthly cashflow
- —
- DSCR
- —
- Eligible?
- —
Short-term bridge; refi at stabilization.
Rent comps 40 comps
| Address | Beds | Baths | Sqft | Rent | $/sqft | DOM | Units | Dist |
|---|---|---|---|---|---|---|---|---|
| 2106 Newbourne St Richmond, VA | 3.0 | 2.0 | 1172 | $1,875 | $1.60 | 43d | 1 | 0.07mi |
| 2108 Phaup St Unit D Richmond, VA | 2.0 | 1.0 | 700 | $995 | $1.42 | 23d | 1 | 0.07mi |
| 2100 Phaup St Richmond, VA | 2.0 | 1.0 | 800 | $995 | $1.24 | 23d | 1 | 0.08mi |
| 2153 Cool Ln Richmond, VA | 2.0 | 1.0 | 1148 | $1,080 | $0.94 | 43d | 1 | 0.12mi |
| 2021 Fairfield Ave Richmond, VA | 2.0 | 1.0 | 785 | $1,195 | $1.52 | 14d | 1 | 0.22mi |
| 1617 N 21st St Richmond, VA | 3.0 | 1.0 | 1157 | $1,825 | $1.58 | 4d | 1 | 0.37mi |
| 2706 Selden St Richmond, VA | 3.0 | 1.0 | 862 | $1,895 | $2.20 | 43d | 1 | 0.41mi |
| 2423 Whitcomb St Richmond, VA | 3.0 | 1.0 | 1000 | $1,100 | $1.10 | 23d | 1 | 0.51mi |
| 1906 N 29th St Richmond, VA | 2.0 | 1.0 | 704 | $1,000 | $1.42 | 4d | 1 | 0.51mi |
| 2852 Fairfield Ave Richmond, VA | 2.0–3.0 | 1.0 | 870 | $1,350 | $1.55 | 4d | 1 | 0.61mi |
| 1806 Sussex St Richmond, VA | 4.0 | 2.0 | 1197 | $2,500 | $2.09 | 43d | 1 | 0.62mi |
| 2906 Nine Mile Rd Richmond, VA | 2.0 | 1.0 | 885 | $1,845 | $2.08 | 23d | 1 | 0.62mi |
| 2016 Fairmount Ave Apt 2 Richmond, VA | 2.0 | 1.0 | 1000 | $1,007 | $1.01 | 43d | 1 | 0.63mi |
| 2016 Fairmount Ave Apt 2 Richmond, VA | 2.0 | 1.0 | 1000 | $1,007 | $1.01 | 14d | 1 | 0.63mi |
| 1603 N 29th St Richmond, VA | 3.0 | 1.0 | 950 | $1,600 | $1.68 | 4d | 1 | 0.64mi |
| 2106 Wood St Richmond, VA | 3.0 | 1.0 | 862 | $1,814 | $2.10 | 20d | 1 | 0.71mi |
| 306 St Claire Ln Richmond, VA | 3.0 | 1.0 | 1017 | $1,595 | $1.57 | 3d | 1 | 0.74mi |
| 1108 N 21st St Unit B Richmond, VA | 2.0 | 2.0 | 1000 | $1,799 | $1.80 | 2d | 1 | 0.77mi |
| 1004 1/2 N 21st St Unit A Richmond, VA | 3.0 | 2.0 | 1248 | $2,195 | $1.76 | 17d | 1 | 0.84mi |
| 1901 Whitcomb St Richmond, VA | 2.0 | 1.0 | 750 | $1,200 | $1.60 | 23d | 1 | 0.85mi |
| 2200 Carrington St Unit 301 Richmond, VA | 2.0 | 2.0 | 890 | $1,435 | $1.61 | 16d | 1 | 0.86mi |
| 2200 Carrington St Unit 300 Richmond, VA | 2.0 | 2.0 | 880 | $1,435 | $1.63 | 43d | 1 | 0.86mi |
| 2914 R St Richmond, VA | 2.0 | 1.0 | 1250 | $1,500 | $1.20 | 23d | 1 | 0.90mi |
| 901 N 27th St Apt 1 Richmond, VA | 4.0 | 1.0 | 1240 | $2,000 | $1.61 | 17d | 1 | 1.01mi |
| 803 N 26th St Unit A Richmond, VA | 2.0 | 2.0 | 1188 | $1,849 | $1.56 | 43d | 1 | 1.06mi |
| 3102 P St Unit B Richmond, VA | 2.0 | 2.5 | 1313 | $1,995 | $1.52 | 4d | 1 | 1.08mi |
| 2003 Cedar St Richmond, VA | 3.0 | 2.0 | 1420 | $2,200 | $1.55 | 43d | 1 | 1.15mi |
| 517 N 21st St Unit 517B Richmond, VA | 2.0 | 1.0 | 1447 | $1,884 | $1.30 | 17d | 1 | 1.19mi |
| 500 N 18th St Richmond, VA | 1.0–2.0 | 1.0–2.0 | 737 | $1,837 | $2.49 | 2d | 11 | 1.23mi |
| 811 N 33rd St Unit A Richmond, VA | 3.0 | 2.0 | 1315 | $1,900 | $1.44 | 4d | 1 | 1.25mi |
| 811 N 33rd St Unit A Richmond, VA | 3.0 | 2.0 | 1315 | $1,900 | $1.44 | 17d | 1 | 1.25mi |
| 621 N 32nd St Unit C Richmond, VA | 2.0 | 1.0 | 700 | $1,299 | $1.86 | 4d | 1 | 1.31mi |
| 1903 E Marshall St Richmond, VA | 3.0 | 1.0–2.0 | 723 | $1,799 | $2.49 | 1d | 57 | 1.34mi |
| 600 N 32nd St Unit C Richmond, VA | 2.0 | 1.0 | 700 | $1,350 | $1.93 | 43d | 1 | 1.35mi |
| 509 N 30th St Unit 2 Richmond, VA | 2.0 | 1.0 | 750 | $1,365 | $1.82 | 21d | 1 | 1.35mi |
| 1820 E Broad St Richmond, VA | 1.0–2.0 | 1.0–2.0 | 665 | $2,476 | $3.72 | 21d | 15 | 1.36mi |
| 2919 4th Ave #2 Richmond, VA | 2.0 | 2.0 | 950 | $1,287 | $1.35 | 43d | 1 | 1.36mi |
| 3508 E Richmond Rd Richmond, VA | 2.0 | 1.0 | 801 | $1,336 | $1.67 | 4d | 7 | 1.38mi |
| 3119 4th Ave Richmond, VA | 2.0 | 1.0 | 820 | $1,225 | $1.49 | 17d | 1 | 1.40mi |
| 1801 Monteiro Ave Unit 1 Richmond, VA | 2.0 | 2.0 | 1500 | $1,550 | $1.03 | 4d | 1 | 1.40mi |
Listing history 24 events
-
2026-06-18days on market $139,000 Active 49 DOM
-
2026-06-17days on market $139,000 Active 48 DOM
-
2026-06-16days on market $139,000 Active 47 DOM
-
2026-06-15days on market $139,000 Active 46 DOM
-
2026-06-13days on market $139,000 Active 44 DOM
-
2026-06-10days on market $139,000 Active 41 DOM
-
2026-06-09days on market $139,000 Active 40 DOM
-
2026-06-08days on market $139,000 Active 39 DOM
-
2026-06-07days on market $139,000 Active 38 DOM
-
2026-06-03days on market $139,000 Active 34 DOM
-
2026-06-02days on market $139,000 Active 33 DOM
-
2026-06-01days on market $139,000 Active 32 DOM
-
2026-05-31days on market $139,000 Active 31 DOM
-
2026-04-30$144,900 Active 719-char remark
-
2009-09-22historical
-
2006-01-16historical
-
2005-06-14$39,500
-
2005-06-14$39,500
-
2004-12-30soldstatus $39,000
-
2004-12-30$29,950
-
2004-11-04soldstatus $39,000
-
2004-11-04soldstatus $39,000
-
2004-09-22$29,950
-
2004-09-22$29,950
ⓘ Source: listings_history table (triggers on properties + properties_extension) + one-shot
backfill from property_details.listing_events for pre-trigger history.
Tax reassessment forecast VA · Resets to sale price
- Current annual tax
- $852 · $71/mo
- Projected year-2 tax
- $1,140 · $95/mo
- Expected delta
- +$288/yr (+$24/mo · 33.8%)
ⓘ Screening estimate from a state-policy table — verify with the county assessor before closing.
Climate risk First Street
- Flood 1/10 Low FEMA zone X (unshaded) · 0% chance over 30 yrs
- Wildfire 1/10 Low
- Heat 8/10 Severe 7 d/yr ≥105°F today · 16 d/yr by 30 yrs out
- Wind 6/10 Major 27% chance of damaging wind over 30 yrs
- Air quality 2/10 Low 1 unhealthy d/yr today · 3 by 30 yrs out
Nearby sold comps map
Loading sold comps map…
Walkable amenities ~0.75 mi
Loading nearby amenities…
Taxation est. · year 1
- Rental income
- $18,616
- − Mortgage interest
- −$7,786
- − Property taxes
- −$852
- − Insurance
- −$695
- − Repairs & maintenance
- −$1,489
- − Management
- −$1,489
- − Depreciation
- −$4,044
- Taxable income
- $2,261
- Est. tax owed @ 24.0%
- −$543
- After-tax cash flow
- $3,870/yr
For passive investors: Depreciation is non-cash, so a rental often shows a tax loss while cash-flowing — sheltering income. Rental losses are passive: they offset passive income freely, and up to $25,000/yr can offset ordinary (W-2) income if you actively participate and your MAGI is under $100k (phasing out to $0 by $150k); unused losses carry forward. On sale, claimed depreciation is recaptured at up to 25%, and gains may owe capital-gains tax (a 1031 exchange can defer both). Figures are a year-1 estimate at your 24.0% rate — not tax advice; consult a CPA.
Schools (NCES district)
- District
- Richmond City Public School District
- NCES district ID
- 5103240
- Math proficiency
- 32% ▼ -24.00%
- Reading proficiency
- 47% ▼ -9.00%
- Median HH income
- $40,276
- Composite
- 33.09/100
- National rank
- #5564
- State rank
- #123 of 131 in VA
Livability — Richmond
- Score
- 84/100
- State rank
- #33
- US rank
- #793
Category grades
Schools grade is shown separately in the Schools card above.
Census & demographics
- Census place
- Richmond, VA
- County
- Henrico County · 334,490 people
- City population
- 287,109
- Metro
- Richmond, VA
- Population (ZIP)
- 54,659
- Household income
- $55,731
- Rent vs Own
- Severe rent burden
- 3530.0
Population outlook (Richmond County) Hauer SSP2
- Today (2025)
- 262,263 people
- By 2030
- 284,503 · +8.5%
- By 2040
- 327,353 · +24.8%
- By 2050
- 367,946 · +40.3%
- By 2075
- 449,560 · +71.4%
- By 2100
- 500,301 · +90.8%
Race, ethnicity, and origin ACS 2023
- Neighborhood character
- Predominantly Black (71%)
- Race & ethnicity
- Black 71% White 19% Two or more races 5% Hispanic / Latino 5%
- Common ancestry
- Romanian 1% Lithuanian 1% Slovak 1%
- Foreign-born
- 4% · Canada
- Languages at home
- 93% English-only · Spanish 4% French/Haitian/Cajun 1% Other Indo-European 1%
Political lean MEDSL · Richmond
- 2024 margin
- Solid D (+66.3) · D 82.0% · R 15.8% · Other 2.2%
- 2008→2024 swing
- +7.2pp toward D · 2008: 59.1pp · 2024: 66.3pp
- All cycles
- 2024: D+66.3 2020: D+68.0 2016: D+63.8 2012: D+55.7 2008: D+59.1
Not yet ingested
- Civics
- —
Market trends
- HPI YoY
- ▼ -257.81%
- Current HPI
- 324.0589
- Rent YoY
- ▲ 6.38%
- Metro
- Richmond, VA
- State GDP YoY
- ▲ 2.40%
- F500 in state
- 50
Industry mix (Fortune 500 HQ in VA)
| Industry | F500 HQs | Revenue |
|---|---|---|
| Aerospace / Defense | 4 | $236B |
|
||
| Technology / Defense | 3 | $32B |
|
||
| Financial Services | 2 | $176B |
|
||
| Utilities | 2 | $27B |
|
||
| Insurance | 2 | $25B |
|
||
| Technology | 2 | $15B |
|
||
Price history
+364.1% since first listed12 events — show timeline
- 2026-05-28 Price Changed $139,000 CVRMLS
- 2026-04-30 Listed $144,900 CVRMLS
- 2009-09-22 Listing Removed — CVRMLS
- 2006-01-16 Listing Removed — CVRMLS
- 2005-06-14 Listed $39,500 CVRMLS
- 2005-06-14 Listed $39,500 CVRMLS
- 2004-12-30 Listed $29,950 MRIS
- 2004-12-30 Sold (MLS) $39,000 MRIS
- 2004-11-04 Sold (MLS) $39,000 CVRMLS
- 2004-11-04 Sold (MLS) $39,000 CVRMLS
- 2004-09-22 Listed $29,950 CVRMLS
- 2004-09-22 Listed $29,950 CVRMLS
Property tax history
+5.7%/yrLatest (2022): $852 · +47.9% YoY. Source: county tax records.
Cash-flow waterfall
monthlySold comps — $/sqft
last 12 mo · ≤1 miLoading sold comps…