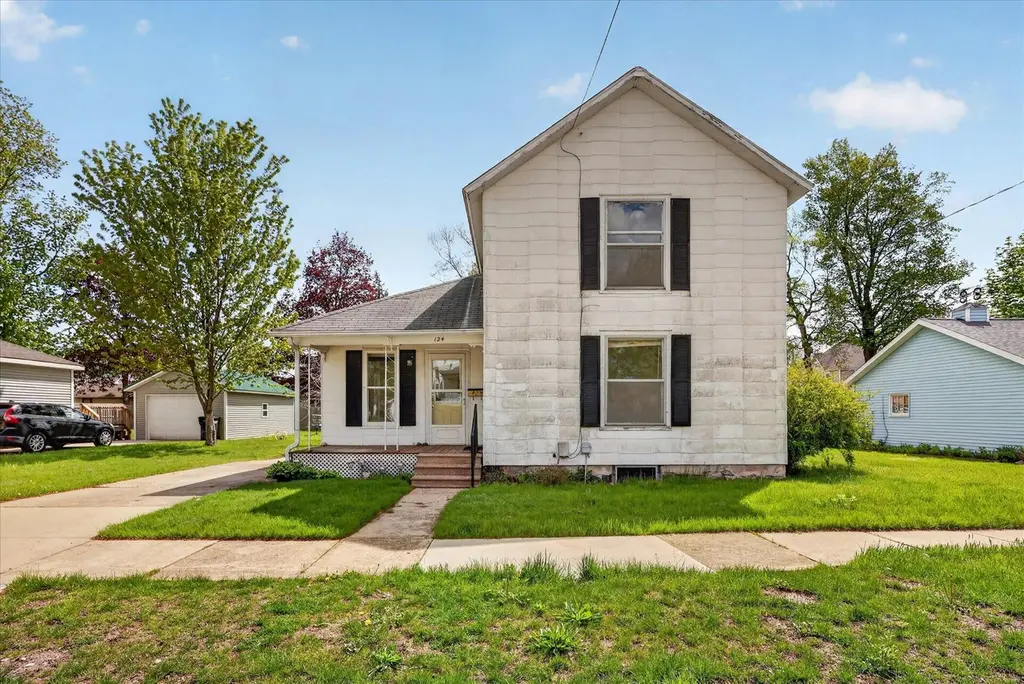
124 Washington St · Sparta, MI
Flood risk 4/10 · Minor
- FEMA flood zone
- X (unshaded)
- Chance of flooding over 30 yrs
- 0.22%
- Est. flood insurance / yr
- $473 – $860
Fire risk 1/10 · Minimal
- Est. fire insurance / yr
- $784 – $1,456
Heat risk 2/10 · Minimal
- Hot days now (above 96°F)
- 7 days/yr
- Hot days in 30 yrs
- 15 days/yr
Wind risk 2/10 · Minimal
- Chance of severe wind over 30 yrs
- —
Air-quality risk 2/10 · Minimal
- Unhealthy air days now
- 1 days/yr
- Unhealthy air days in 30 yrs
- 1 days/yr
Risk factors via First Street. Map © Google.
Why this score? — see what drove the C+ grade
The composite is a weighted blend of 9 inputs, each scored 0–100. Each bar is that input's sub-score; the figure is the points it added to the 100-point composite (weight × sub-score).
- Cash flow +23.7/30.0
- ARV discount +15.0/15.0
- DSCR +7.6/10.0
- 1% rule +5.7/10.0
- Livability +4.0/5.0
- Schools +3.5/10.0
- Rent growth +2.5/5.0
- Condition / age +2.5/5.0
- Appreciation +0.0/10.0
$180,000
🖨 Deal sheet 📄 Offer letter ✓ Due diligence
Listing remarks MLS
Welcome to 124 Washington Street in downtown Sparta! This 4-bedroom, 1-bath home offers a great opportunity for buyers looking to build sweat equity or investors searching for their next renovation project. With solid bones, a functional layout, and a convenient location near local shops, restaurants, and downtown amenities, there is plenty of potential to bring this property back to life. Currently one of the only single-family homes in Sparta priced under $200K, this is a rare opportunity at an approachable price point. Schedule your showing today!
Key facts
- Downtown sparta
- Single-family homes
- Convenient location
Tags
Property features AI
Exterior
- Utilities: Public water
- Home design: Traditional-style single family residence; Residential property
- Construction: Built in 1875; Structured insulated panel construction; Composition roof
- Exterior features: Paved road access; 0.15-acre lot
Interior
- Kitchen: Range; Refrigerator
- Bathrooms: 1 full bathroom
- Heating & cooling: Forced air heating
- Interior features: 9 total rooms; Michigan-style basement
Neighborhood map
What this means for you Summary
Snapshot
- This is a 4-bed/1.0-bath single-family listed at $180k.
Deal economics
- At list price, monthly cash flow is $343 ($4k/yr) — positive.
- The deal already cash-flows at list — no discount required.
- Meets the 1% rule at list price ($2k rent vs $180k).
- Cap rate 8.6% vs local median 4.5% in Sparta — top-decile yield for the area; either an underpriced asset or a hidden risk that comps aren't pricing in. Stress-test before assuming the spread holds.
Location & tenants
- Location reads 80/100 on livability (#83 in MI, #1,786 nationally) — a professional / high-income tenant draw. Strengths: cost of living A+, housing A+, health & safety A+; Watch: amenities D+, employment D, commute F.
- Sparta Area Schools (town): math 33% / reading 47% proficiency, ranked #201 of 540 in MI (top 37%) — families likely to look elsewhere, expect single-tenant / working-renter base with shorter leases.
- Market conditions: 100 active listings in the ZIP; 2,253 units permitted in Kent County in 2024 (969 in 5+ unit buildings).
Forward outlook
- Local home prices are declining (-3.0%/yr); year-one equity from $1k of loan paydown is wiped out by about $5k of value loss. Plan a longer hold.
- Kent County population projected at +22% by 2050 — long-run rental-demand tailwind backs the buy-and-hold thesis.
Negotiation context
- Only 7 days on market — expect competitive offers; lowballing is unlikely to land.
- 5 sale attempts with the ask held roughly flat each time — persistent listings suggest the price (not the market) is what's stuck; bring a comps-based counter.
- Current owner paid $130k; 38% above their basis — modest negotiation headroom, anchor on the comps not their cost.
Risks & watch-outs
- Watch-outs: built in 1875 — expect roof / HVAC / electrical / plumbing capex.
Questions for the listing agent
- Built in 1875 — when were the roof, HVAC, electrical panel, plumbing, and water heater last replaced?
- Is there a deadline driving the sale (1031 exchange, divorce, estate, relocation)? That informs how much negotiation room exists.
- What's the average days-on-market for RENTAL listings here right now (not sales)? A rising rental-DOM trend means longer vacancies and softer asking-rent achievability than the comps imply.
- What's the recent tenant-quality profile in this submarket — average credit score on applications, eviction rate, late-payment / NSF rate, and stable-employment percentage? A property-management company in the area should have these aggregated.
- How much new for-sale + rental construction is in the pipeline within 1–3 miles? Heavy new supply typically softens prices + rents 12–24 months out; constrained supply supports both.
Investment metrics
- 1% rule
- 1.07% ✓
- Cap rate
- 8.58%
- Cash-on-cash
- 8.16%
- DSCR
- 1.36
- GRM
- 7.8
CMA / ARV
- ARV (median comp)
- $228,503
- List price
- $180,000
- Delta
- -19.04%
- Verdict
- UNDERPRICED
- Comps
- 20 within 1.0 mi
Show comp detail 12 sales within ~0.75 mi
| Address | Dist | Beds/Ba | Sqft | Sold | Price | $/sf | Match |
|---|---|---|---|---|---|---|---|
| 187 Centennial St | 0.06mi | 3/1.5 (-1) | 1,480 (-4%) | 2mo | $212,500 | $144 | 82 |
| 84 W Division St | 0.35mi | 4/1.0 | 1,562 (+1%) | 5mo | $226,000 | $145 | 78 |
| 265 N Union St | 0.49mi | 3/1.5 (-1) | 1,566 (+1%) | 1mo | $269,000 | $172 | 67 |
| 91 Prospect St NW | 0.17mi | 4/1.0 | 1,320 (-15%) | 7mo | $169,900 | $129 | 62 |
| 109 Pleasant St NW | 0.38mi | 3/1.0 (-1) | 1,415 (-8%) | 1mo | $250,500 | $177 | 62 |
| 120 S Union St NW | 0.06mi | 3/1.5 (-1) | 1,770 (+14%) | 7mo | $275,000 | $155 | 60 |
| 230 S Union St | 0.15mi | 4/2.0 | 1,344 (-13%) | 9mo | $270,000 | $201 | 60 |
| 332 Grove St | 0.44mi | 3/2.0 (-1) | 1,499 (-3%) | 12mo | $263,000 | $175 | 55 |
| 82 W Averill St | 0.38mi | 3/1.5 (-1) | 1,408 (-9%) | 7mo | $327,900 | $233 | 54 |
| 160 Orchard Dr | 0.54mi | 3/2.5 (-1) | 1,582 (+2%) | 11mo | $343,000 | $217 | 51 |
| 533 S Union St | 0.68mi | 3/1.0 (-1) | 1,600 (+3%) | 12mo | $300,000 | $188 | 48 |
| 137 Ida Red Ave | 0.59mi | 3/2.0 (-1) | 1,344 (-13%) | 8mo | $293,550 | $218 | 35 |
Match score weights: distance 35% · size 25% · config 20% · recency 20%. Top-matched comps best support the ARV.
Projected returns pro-forma
-3.0% appreciation · 3.0% rent growth · sell at horizon
- IRR
- -3.9%
- Equity multiple
- 0.85×
- Total profit
- $-7,345
- Equity at exit
- $26,839
- IRR
- 5.8%
- Equity multiple
- 1.43×
- Total profit
- $21,682
- Equity at exit
- $15,563
Cash invested: $50,400 (down + closing). Projections, not guarantees.
Landlord ↔ Tenant lean methodology
- Overall (STATE)
- 62 Landlord-Friendly
- State Michigan
- 62 Landlord-Friendly · EVEN
- County
- — inherits STATE
- City
- — inherits STATE
ZIP-level market 49345
- Home prices YoY
- -27.3%
- Active inventory
- 100
- Price-to-rent
- 7.8×
Monthly cashflow live
- Estimated rent
- $1,931 medium interval (Pro) →
- Mortgage (P&I)
- −$944
- Tax from tax record
- −$164 /mo · $1,967/yr
- Insurance
- −$75
- HOA
- −$0
- Vacancy / Maint / Mgmt
- −$406
- Net cashflow
- $343
Break-even live
UW: 25.0% down · 7.5% · 30yr · 1.5% tax · 5.0% vac · 8.0% maint · 8.0% mgmt
Financing live
Cash to close
- Down payment
- $45,000
- Closing costs
- $5,400
- Reserves months
- —
- Total cash needed
- —
Loan-product check · same deal, 3 products live
Conventional
25% down · 7.5% · 30yr
- Down + closing
- —
- Monthly P&I
- —
- Monthly cashflow
- —
- DSCR
- —
- Eligible?
- —
Personal DTI + credit; lowest rate.
DSCR
20% down · 8.5% · 30yr
- Down + closing
- —
- Monthly P&I
- —
- Monthly cashflow
- —
- DSCR
- —
- Eligible?
- —
No personal income docs; deal must DSCR.
Hard money
10% down · 12.0% · 12mo
- Down + closing
- —
- Monthly P&I
- —
- Monthly cashflow
- —
- DSCR
- —
- Eligible?
- —
Short-term bridge; refi at stabilization.
Listing history 17 events
-
2026-06-18days on market $180,000 Active 7 DOM
-
2026-06-17days on market $180,000 Active 6 DOM
-
2026-06-16days on market $180,000 Active 5 DOM
-
2026-06-15days on market $180,000 Active 4 DOM
-
2026-06-14days on market $180,000 Active 2 DOM
-
2026-06-13pricedays on market $180,000 Active 1 DOM
-
2026-06-10days on market $185,000 Active 34 DOM
-
2026-06-09days on market $185,000 Active 33 DOM
-
2026-06-08days on market $185,000 Active 32 DOM
-
2026-06-07days on market $185,000 Active 31 DOM
-
2026-06-03days on market $185,000 Active 27 DOM
-
2026-06-03days on market $185,000 Active 26 DOM
-
2026-06-01days on market $185,000 Active 25 DOM
-
2026-05-31days on market $185,000 Active 24 DOM
-
2026-05-07$195,000 Active 556-char remark
-
2026-05-07$195,000 Active 556-char remark
-
2026-05-07$195,000 Active
ⓘ Source: listings_history table (triggers on properties + properties_extension) + one-shot
backfill from property_details.listing_events for pre-trigger history.
Tax reassessment forecast MI · Partial reset (capped growth)
- Current annual tax
- $1,967 · $164/mo
- Projected year-2 tax
- $2,369 · $197/mo
- Expected delta
- +$403/yr (+$34/mo · 20.5%)
ⓘ Screening estimate from a state-policy table — verify with the county assessor before closing.
Climate risk First Street
- Flood 4/10 Moderate FEMA zone X (unshaded) · 22% chance over 30 yrs
- Wildfire 1/10 Low
- Heat 2/10 Low 7 d/yr ≥96°F today · 15 d/yr by 30 yrs out
- Wind 2/10 Low
- Air quality 2/10 Low 1 unhealthy d/yr today · 1 by 30 yrs out
Nearby sold comps map
Loading sold comps map…
Walkable amenities ~0.75 mi
Loading nearby amenities…
Taxation est. · year 1
- Rental income
- $23,174
- − Mortgage interest
- −$10,083
- − Property taxes
- −$1,967
- − Insurance
- −$900
- − Repairs & maintenance
- −$1,854
- − Management
- −$1,854
- − Depreciation
- −$5,236
- Taxable income
- $1,280
- Est. tax owed @ 24.0%
- −$307
- After-tax cash flow
- $3,806/yr
For passive investors: Depreciation is non-cash, so a rental often shows a tax loss while cash-flowing — sheltering income. Rental losses are passive: they offset passive income freely, and up to $25,000/yr can offset ordinary (W-2) income if you actively participate and your MAGI is under $100k (phasing out to $0 by $150k); unused losses carry forward. On sale, claimed depreciation is recaptured at up to 25%, and gains may owe capital-gains tax (a 1031 exchange can defer both). Figures are a year-1 estimate at your 24.0% rate — not tax advice; consult a CPA.
Schools (NCES district)
- District
- Sparta Area Schools
- NCES district ID
- 2632370
- Math proficiency
- 33% ▼ -15.00%
- Reading proficiency
- 47% ▼ -9.00%
- Median HH income
- $54,917
- Composite
- 34.91/100
- National rank
- #5074
- State rank
- #201 of 540 in MI
Livability — Sparta
- Score
- 80/100
- State rank
- #83
- US rank
- #1786
Category grades
Schools grade is shown separately in the Schools card above.
Census & demographics
- Census place
- Sparta, MI
- City population
- 13,189
- Population (ZIP)
- 13,189
Population outlook (Kent County) Hauer SSP2
- Today (2025)
- 712,484 people
- By 2030
- 748,618 · +5.1%
- By 2040
- 814,777 · +14.4%
- By 2050
- 868,556 · +21.9%
- By 2075
- 966,487 · +35.7%
- By 2100
- 967,975 · +35.9%
Race, ethnicity, and origin ACS 2023
- Neighborhood character
- Predominantly White (90%)
- Race & ethnicity
- White 90% Two or more races 5% Hispanic / Latino 3% Asian 2%
- Common ancestry
- Iranian 17% Romanian 9% Lithuanian 4%
- Foreign-born
- 2% · Vietnam, South Korea, Canada
- Languages at home
- 96% English-only · Spanish 1% Other Indo-European 1% Vietnamese 1%
Political lean MEDSL · Kent
- 2024 margin
- Lean D (+5.4) · D 51.8% · R 46.5% · Other 1.7%
- 2008→2024 swing
- +4.8pp toward D · 2008: 0.5pp · 2024: 5.4pp
- All cycles
- 2024: D+5.4 2020: D+6.1 2016: R+3.1 2012: R+7.9 2008: D+0.5
Not yet ingested
- Civics
- —
Market trends
- HPI YoY
- ▼ -109.19%
- Current HPI
- 290.9224
- Rent YoY
- —
- Metro
- —
- State GDP YoY
- ▲ 1.37%
- F500 in state
- 28
Industry mix (Fortune 500 HQ in MI)
| Industry | F500 HQs | Revenue |
|---|---|---|
| Automotive Parts | 3 | $48B |
|
||
| Automotive | 2 | $372B |
|
||
| Chemicals | 1 | $45B |
|
||
| Automotive Retail | 1 | $29B |
|
||
| Healthcare / Medical Devices | 1 | $23B |
|
||
| Automotive Technology | 1 | $20B |
|
||
Price history
+38.5% since first listed11 events — show timeline
- 2026-06-11 Listing Removed — MiRealSource-MiMLS
- 2026-06-11 Listed $180,000 SW Michigan MLS
- 2026-06-11 Listed $180,000 MiRealSource-MiMLS
- 2026-06-11 Listed $180,000 REALCOMP
- 2026-06-10 Listing Removed — REALCOMP
- 2026-05-23 Price Changed $185,000 MiRealSource-MiMLS
- 2026-05-22 Price Changed $185,000 REALCOMP
- 2026-05-22 Price Changed $185,000 SW Michigan MLS
- 2026-05-07 Listed $195,000 REALCOMP
- 2026-05-07 Listed $195,000 MiRealSource-MiMLS
- 2026-05-05 Sold (Public Records) $130,000 Public Records
Property tax history
+3.0%/yrLatest (2025): $1,967 · +3.5% YoY. Source: county tax records.
Cash-flow waterfall
monthlySold comps — $/sqft
last 12 mo · ≤1 miLoading sold comps…