5325 Boca Raton Ave · Sarasota, FL
Flood risk 1/10 · Minimal
- FEMA flood zone
- X (unshaded)
- Chance of flooding over 30 yrs
- 0.0%
- Est. flood insurance / yr
- $507 – $1,088
Fire risk 1/10 · Minimal
- Est. fire insurance / yr
- $947 – $1,759
Heat risk 10/10 · Severe
- Hot days now (above 106°F)
- 7 days/yr
- Hot days in 30 yrs
- 29 days/yr
Wind risk 10/10 · Severe
- Chance of severe wind over 30 yrs
- 99.0%
Air-quality risk 2/10 · Minimal
- Unhealthy air days now
- 1 days/yr
- Unhealthy air days in 30 yrs
- 1 days/yr
Risk factors via First Street. Map © Google.
Why this score? — see what drove the D grade
The composite is a weighted blend of 9 inputs, each scored 0–100. Each bar is that input's sub-score; the figure is the points it added to the 100-point composite (weight × sub-score).
- Cash flow +12.2/30.0
- ARV discount +7.5/15.0
- Schools +5.4/10.0
- 1% rule +4.5/10.0
- Livability +4.0/5.0
- DSCR +3.6/10.0
- Condition / age +2.5/5.0
- Rent growth +1.7/5.0
- Appreciation +0.0/10.0
$156,900
🖨 Deal sheet 📄 Offer letter ✓ Due diligence
Listing remarks MLS
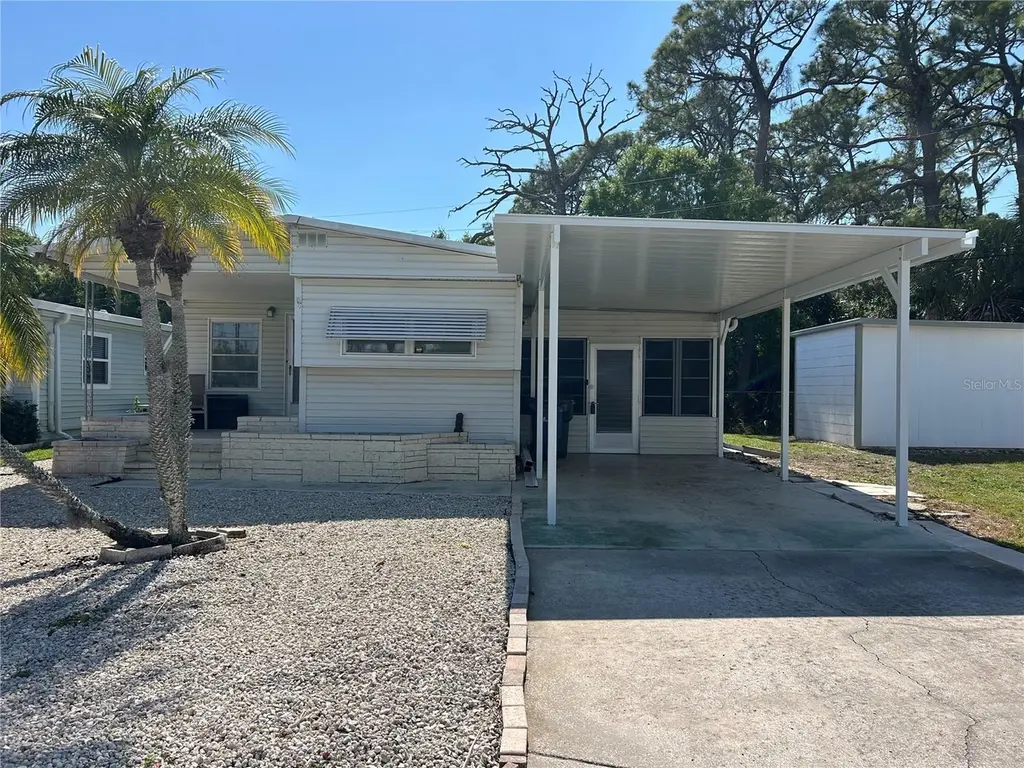
Attractive home - great location in Tri Par Estates. 2 bedroom, 1.5 bathrooms with 780 Sq. Ft. of living space. Brand new carport installed March of 2026. Purchase incudes; large Lanai/storage area & laundry room with a shower, Some new flooring since 2023, water heater 2023, HT/AC Mini Splits & some appliances 2017 This property is out of the flood zone code "X". Tri-Par Estates is a 55+ community in which you own your home and the land. A park fee of $1,648.00 a year is part of the property taxes paid once a year, includes Frontier internet, cable also trash. There is a large pool, hot tub, mini golf, laundry facilities, fitness room, clubhouse, and many activities to enjoy. Just minutes to the airport and many other like necessities nearby like hospitals, shopping, restaurants and more. Please do not disturb resident. Airplanes & jets do fly over Tri Par Estates. Tri Par is a state park & recreation development.
Key facts
- Hot tub
- Laundry room
- Large pool
Tags
Neighborhood map
What this means for you Summary
Snapshot
- This is a 1-bed/1.5-bath manufactured listed at $157k.
Deal economics
- At list price, monthly cash flow is $-33 ($-393/yr) — negative.
- To cash-flow at today's rent, offer at most $151k (3.7% below list).
- To meet the 1% rule (rent ≥ 1% of price), the offer needs to be $150k (4.6% below list).
- Recommended offer: $138k (12.0% below list) — sets the bar for market timing.
Location & tenants
- Location reads 80/100 on livability (#121 in FL, #1,854 nationally) — a professional / high-income tenant draw. Strengths: amenities A+, health & safety A+, commute A; Watch: crime F.
- Sarasota (urban): math 63% / reading 63% proficiency, ranked #7 of 73 in FL (top 10%) — acceptable for families but not a draw, mixed tenant base, ~2y average lease.
- Market conditions: Rents falling (-3.1%/yr); 268 active listings in the ZIP; 7,466 units permitted in Sarasota County in 2024 (2,138 in 5+ unit buildings).
- This rent runs 31% of the median local income ($57k/yr) — at the standard rent-burdened threshold; future hikes will face affordability resistance.
Forward outlook
- Local home prices are declining (-3.0%/yr); year-one equity from $1k of loan paydown is wiped out by about $5k of value loss. Plan a longer hold.
- Sarasota County population projected at +20% by 2050 — long-run rental-demand tailwind backs the buy-and-hold thesis.
Negotiation context
- It's been on market 220 days — a 12% lower offer ($138k) is reasonable based on typical stale-listing flexibility.
- Current owner paid $75k; list at $157k implies a 109% gain — meaningful room to come down on a strong offer.
Risks & watch-outs
- Climate carrying-cost: severe wind risk, 99% chance of damaging wind over 30y; extreme-heat days projected 7→29/yr by 2055 (HVAC capex compounding) — expect insurance premiums to compound above CPI over the hold.
Questions for the listing agent
- What do current leases actually rent for vs. the listed asking? Can we see a recent rent roll and the last 12 months of T-12 income?
- It's been on market 220 days. Have you received any prior offers? Is the seller open to a 12% concession, seller financing, or rate buy-down credit?
- Built in 1962 — when were the roof, HVAC, electrical panel, plumbing, and water heater last replaced?
- What does the HOA fee cover, when was the last increase, and are there any pending special assessments or reserve-fund shortfalls?
- Why hasn't it sold? Are there any deal-killer items the seller is aware of (foundation, flood, title, zoning, code violations)?
- Is there a deadline driving the sale (1031 exchange, divorce, estate, relocation)? That informs how much negotiation room exists.
- Schools are B-rated — typically a magnet for longer-tenancy family renters. What's the average tenant stay here, and is there a school-zone premium baked into asking?
- Crime grade is F in this area — have there been break-ins, vandalism, or insurance claims at this property in the last 3 years? What carrier currently insures it and at what premium?
- The area grade is low — what's the realistic commute time and amenity access for the typical tenant pool here? Any planned neighborhood developments (good or bad) we should know about?
- What's the average days-on-market for RENTAL listings here right now (not sales)? A rising rental-DOM trend means longer vacancies and softer asking-rent achievability than the comps imply.
- What's the recent tenant-quality profile in this submarket — average credit score on applications, eviction rate, late-payment / NSF rate, and stable-employment percentage? A property-management company in the area should have these aggregated.
- How much new for-sale + rental construction is in the pipeline within 1–3 miles? Heavy new supply typically softens prices + rents 12–24 months out; constrained supply supports both.
Investment metrics
- 1% rule
- 0.95% ✗
- Cap rate
- 6.04%
- Cash-on-cash
- -0.90%
- DSCR
- 0.96
- GRM
- 8.7
CMA / ARV
No comps found within radius.
Projected returns pro-forma
-3.0% appreciation · 0.0% rent growth · sell at horizon
- IRR
- -21.6%
- Equity multiple
- 0.28×
- Total profit
- $-31,797
- Equity at exit
- $23,394
- IRR
- -26.3%
- Equity multiple
- -0.07×
- Total profit
- $-46,917
- Equity at exit
- $13,566
Cash invested: $43,932 (down + closing). Projections, not guarantees.
Landlord ↔ Tenant lean methodology
- Overall (STATE)
- 87 Strongly Landlord-Friendly
- State Florida
- 87 Strongly Landlord-Friendly · R+3
- County
- — inherits STATE
- City
- — inherits STATE
ZIP-level market 34234
- Rents YoY
- -3.1%
- Active inventory
- 268
- Price-to-rent
- 8.7×
Monthly cashflow live
- Estimated rent
- $1,498 medium interval (Pro) →
- Mortgage (P&I)
- −$823
- Tax from tax record
- −$191 /mo · $2,288/yr
- Insurance
- −$65
- HOA
- −$137
- Vacancy / Maint / Mgmt
- −$314
- Net cashflow
- $-33
Break-even live
UW: 25.0% down · 7.5% · 30yr · 1.5% tax · 5.0% vac · 8.0% maint · 8.0% mgmt
Financing live
Cash to close
- Down payment
- $39,225
- Closing costs
- $4,707
- Reserves months
- —
- Total cash needed
- —
Loan-product check · same deal, 3 products live
Conventional
25% down · 7.5% · 30yr
- Down + closing
- —
- Monthly P&I
- —
- Monthly cashflow
- —
- DSCR
- —
- Eligible?
- —
Personal DTI + credit; lowest rate.
DSCR
20% down · 8.5% · 30yr
- Down + closing
- —
- Monthly P&I
- —
- Monthly cashflow
- —
- DSCR
- —
- Eligible?
- —
No personal income docs; deal must DSCR.
Hard money
10% down · 12.0% · 12mo
- Down + closing
- —
- Monthly P&I
- —
- Monthly cashflow
- —
- DSCR
- —
- Eligible?
- —
Short-term bridge; refi at stabilization.
HOA detail
- Monthly dues
- $137 · $1,644/yr
- Likely covers
- watertrashinternetcablepool
Listing history 18 events
-
2026-06-18days on market $156,900 Active 220 DOM
-
2026-06-17days on market $156,900 Active 219 DOM
-
2026-06-16days on market $156,900 Active 218 DOM
-
2026-06-15days on market $156,900 Active 217 DOM
-
2026-06-13days on market $156,900 Active 215 DOM
-
2026-06-13days on market $156,900 Active 214 DOM
-
2026-06-10days on market $156,900 Active 212 DOM
-
2026-06-09days on market $156,900 Active 211 DOM
-
2026-06-08days on market $156,900 Active 209 DOM
-
2026-06-05days on market $156,900 Active 206 DOM
-
2026-06-03days on market $156,900 Active 205 DOM
-
2026-06-02days on market $156,900 Active 204 DOM
-
2026-06-01days on market $156,900 Active 203 DOM
-
2026-05-31days on market $156,900 Active 202 DOM
-
2025-12-18price $156,900 962-char remark
Show marketing remark (962 chars)
Attractive home - great location in Tri Par Estates. 2 bedroom, 1.5 bathrooms with 780 Sq. Ft. of living space. Brand new carport installed March of 2026. Purchase incudes; large Lanai/storage area & laundry room with a shower, Some new flooring since 2023, water heater 2023, HT/AC Mini Splits & some appliances 2017 This property is out of the flood zone code "X". Tri-Par Estates is a 55+ community in which you own your home and the land. A park fee of $1,648.00 a year is part of the property taxes paid once a year, includes Frontier internet, cable also trash. There is a large pool, hot tub, mini golf, laundry facilities, fitness room, clubhouse, and many activities to enjoy. Just minutes to the airport and many other like necessities nearby like hospitals, shopping, restaurants and more. Please do not disturb resident. Airplanes & jets do fly over Tri Par Estates. Tri Par is a state park & recreation development.
-
2025-11-10$149,900 Active 962-char remark
Show marketing remark (962 chars)
Attractive home - great location in Tri Par Estates. 2 bedroom, 1.5 bathrooms with 780 Sq. Ft. of living space. Brand new carport installed March of 2026. Purchase incudes; large Lanai/storage area & laundry room with a shower, Some new flooring since 2023, water heater 2023, HT/AC Mini Splits & some appliances 2017 This property is out of the flood zone code "X". Tri-Par Estates is a 55+ community in which you own your home and the land. A park fee of $1,648.00 a year is part of the property taxes paid once a year, includes Frontier internet, cable also trash. There is a large pool, hot tub, mini golf, laundry facilities, fitness room, clubhouse, and many activities to enjoy. Just minutes to the airport and many other like necessities nearby like hospitals, shopping, restaurants and more. Please do not disturb resident. Airplanes & jets do fly over Tri Par Estates. Tri Par is a state park & recreation development.
-
2017-08-21soldstatus $75,000
-
1984-12-01soldstatus $43,000
ⓘ Source: listings_history table (triggers on properties + properties_extension) + one-shot
backfill from property_details.listing_events for pre-trigger history.
Tax reassessment forecast FL · Resets to sale price
- Current annual tax
- $2,288 · $191/mo
- Projected year-2 tax
- $2,288 · $191/mo
- Expected delta
- $0/yr ($0/mo · 0.0%)
ⓘ Screening estimate from a state-policy table — verify with the county assessor before closing.
Climate risk First Street
- Flood 1/10 Low FEMA zone X (unshaded) · 0% chance over 30 yrs
- Wildfire 1/10 Low
- Heat 10/10 Extreme 7 d/yr ≥106°F today · 29 d/yr by 30 yrs out
- Wind 10/10 Extreme 99% chance of damaging wind over 30 yrs
- Air quality 2/10 Low 1 unhealthy d/yr today · 1 by 30 yrs out
Nearby sold comps map
Loading sold comps map…
Walkable amenities ~0.75 mi
Loading nearby amenities…
Taxation est. · year 1
- Rental income
- $17,971
- − Mortgage interest
- −$8,789
- − Property taxes
- −$2,288
- − Insurance
- −$784
- − Repairs & maintenance
- −$1,438
- − Management
- −$1,438
- − HOA
- −$1,644
- − Depreciation
- −$4,564
- Taxable loss
- −$2,974
- Est. tax savings @ 24.0%
- +$714
- After-tax cash flow
- $321/yr
For passive investors: Depreciation is non-cash, so a rental often shows a tax loss while cash-flowing — sheltering income. Rental losses are passive: they offset passive income freely, and up to $25,000/yr can offset ordinary (W-2) income if you actively participate and your MAGI is under $100k (phasing out to $0 by $150k); unused losses carry forward. On sale, claimed depreciation is recaptured at up to 25%, and gains may owe capital-gains tax (a 1031 exchange can defer both). Figures are a year-1 estimate at your 24.0% rate — not tax advice; consult a CPA.
Schools (NCES district)
- District
- Sarasota
- NCES district ID
- 1201680
- Math proficiency
- 63% ▼ -8.00%
- Reading proficiency
- 63% ▼ -3.00%
- Median HH income
- $51,167
- Composite
- 53.68/100
- National rank
- #1428
- State rank
- #7 of 73 in FL
Livability — Sarasota
- Score
- 80/100
- State rank
- #121
- US rank
- #1854
Category grades
Schools grade is shown separately in the Schools card above.
Census & demographics
- County
- Sarasota County · 448,376 people
- City population
- 261,896
- Metro
- North Port-Sarasota-Bradenton, FL
- Population (ZIP)
- 22,986
- Household income
- $57,288
- Rent vs Own
- Severe rent burden
- 1306.0
Population outlook (Sarasota County) Hauer SSP2
- Today (2025)
- 452,380 people
- By 2030
- 474,175 · +4.8%
- By 2040
- 511,577 · +13.1%
- By 2050
- 541,467 · +19.7%
- By 2075
- 604,947 · +33.7%
- By 2100
- 621,965 · +37.5%
Race, ethnicity, and origin ACS 2023
- Neighborhood character
- Diverse neighborhood (Simpson 0.68)
- Race & ethnicity
- White 44% Black 31% Hispanic / Latino 20% Two or more races 14% Asian 1%
- Hispanic origin (detail)
- Mexican 8% Puerto Rican 1% Cuban 6% Dominican 1%
- Common ancestry
- Lithuanian 4% Hispanic 2% Romanian 1%
- Foreign-born
- 17% · Canada, Jamaica, China
- Languages at home
- 81% English-only · Spanish 17% French/Haitian/Cajun 1%
Political lean MEDSL · Sarasota
- 2024 margin
- R (+18.2) · D 40.5% · R 58.7%
- 2008→2024 swing
- -18.1pp toward R · 2008: -0.1pp · 2024: -18.2pp
- All cycles
- 2024: R+18.2 2020: R+10.4 2016: R+11.6 2012: R+7.4 2008: R+0.1
Not yet ingested
- Civics
- —
Market trends
- HPI YoY
- ▼ -229.06%
- Current HPI
- 305.6629
- Rent YoY
- ▼ -3.15%
- Metro
- North Port-Sarasota-Bradenton, FL
- State GDP YoY
- ▲ 3.28%
- F500 in state
- 36
Industry mix (Fortune 500 HQ in FL)
| Industry | F500 HQs | Revenue |
|---|---|---|
| Industrial Technology | 2 | $29B |
|
||
| Insurance | 2 | $17B |
|
||
| Retail | 1 | $60B |
|
||
| Technology Distribution | 1 | $58B |
|
||
| Homebuilding | 1 | $35B |
|
||
| Technology Manufacturing | 1 | $35B |
|
||
Price history
+264.9% since first listed4 events — show timeline
- 2025-12-18 Price Changed $156,900 Stellar MLS as Distributed by MLS Grid
- 2025-11-10 Listed $149,900 Stellar MLS as Distributed by MLS Grid
- 2017-08-21 Sold (Public Records) $75,000 Public Records
- 1984-12-01 Sold (Public Records) $43,000 Public Records
Property tax history
+5.2%/yrLatest (2025): $2,288 · -21.4% YoY. Source: county tax records.
Cash-flow waterfall
monthlySold comps — $/sqft
last 12 mo · ≤1 miLoading sold comps…