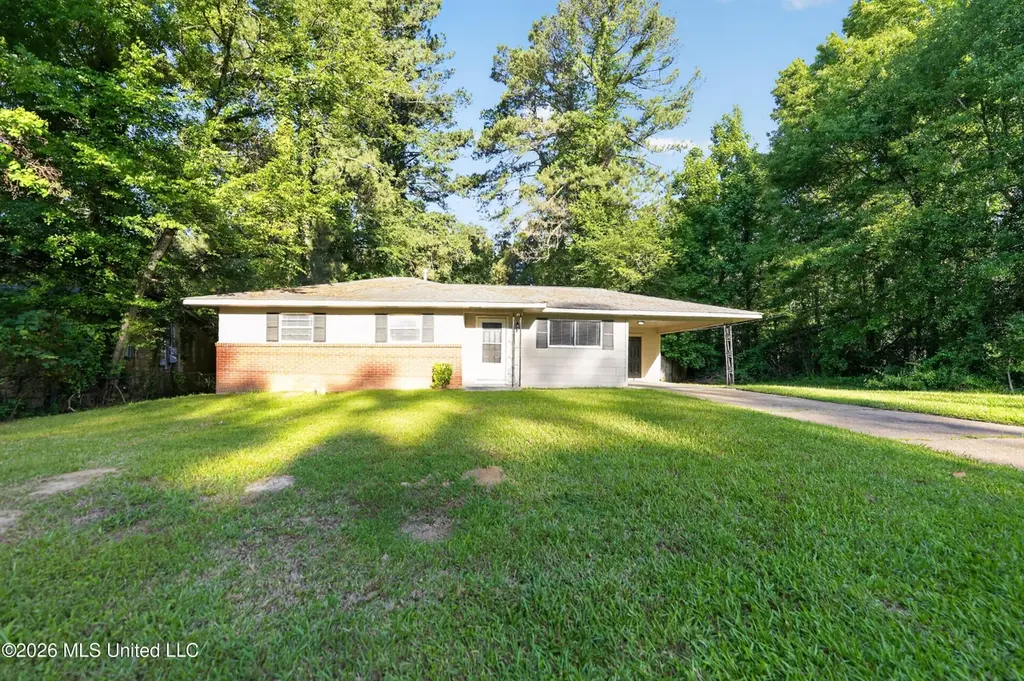
1439 Gibralter Dr · Jackson, MS
Flood risk 1/10 · Minimal
- FEMA flood zone
- X (unshaded)
- Chance of flooding over 30 yrs
- 0.0%
- Est. flood insurance / yr
- $507 – $1,088
Fire risk 1/10 · Minimal
- Est. fire insurance / yr
- $1,241 – $2,305
Heat risk 7/10 · Major
- Hot days now (above 108°F)
- 6 days/yr
- Hot days in 30 yrs
- 17 days/yr
Wind risk 8/10 · Major
- Chance of severe wind over 30 yrs
- 80.0%
Air-quality risk 1/10 · Minimal
- Unhealthy air days now
- 0 days/yr
- Unhealthy air days in 30 yrs
- 0 days/yr
Risk factors via First Street. Map © Google.
Why this score? — see what drove the B+ grade
The composite is a weighted blend of 9 inputs, each scored 0–100. Each bar is that input's sub-score; the figure is the points it added to the 100-point composite (weight × sub-score).
- Cash flow +30.0/30.0
- 1% rule +10.0/10.0
- DSCR +10.0/10.0
- Appreciation +10.0/10.0
- ARV discount +7.5/15.0
- Rent growth +5.0/5.0
- Livability +3.4/5.0
- Condition / age +2.5/5.0
- Schools +1.1/10.0
$69,900
🖨 Deal sheet 📄 Offer letter ✓ Due diligence
Listing remarks MLS
Family room, dining, 3br/1ba, and large den. Owner occupants can purchase this home with little as $100 down payment. This is for owner occupants purchasing a HUD Home with FHA financing. SOLD AS IS WHERE IS WITH NO DISCLSOURES. CASE # 281-334908. FHA Financing. Listed As UI(UNINSURED)203K Eligible:Yes. EHO Language: Equal Housing Opportunity. Estimated taxes from Hinds county.
Key facts
- Separate den
- Bright living room
- Renovated ranch
Tags
Property features AI
Finance
- HOA & community: Community features include curbs, street lights, and proximity to entertainment
Exterior
- Parking: Carport (1 covered space), 2 total parking spaces
- Security: Dead bolt locks; Smoke detector(s)
- Utilities: Public water; Public sewer; Cable available; Electricity connected; Sewer connected; Water connected
- Home design: Single-family house; One story; Slab foundation
- Construction: Brick veneer, masonry, and siding construction; Asphalt shingle roof; Built (year per public records)
- Exterior features: Front porch; Patio (slab); Private backyard; Back yard chain link fencing; Exterior lighting; Rain gutters; Curbs; Street lights; Near entertainment
Interior
- Kitchen: Dishwasher; Refrigerator; Granite counters; Eat-in kitchen
- Bedrooms: Primary bedroom on main level (12x14); Bedroom on main level (10x12); Bedroom on main level (10x10)
- Flooring: Ceramic tile; Hardwood; Vinyl; Combination flooring
- Bathrooms: 1 full bathroom
- Heating & cooling: Central heating (forced air, natural gas); Central air; Ceiling fans
- Interior features: Ceiling fans; Eat-in kitchen; High-speed internet available; Storage space; Granite countertops; Dead bolt locks and security door features; Smoke detector(s)
- Laundry & utility: Washer hookup on main level; Electric dryer hookup inside
Neighborhood map
What this means for you Summary
Snapshot
- This is a 3-bed/1.0-bath single-family listed at $70k.
Deal economics
- At list price, monthly cash flow is $496 ($6k/yr) — positive.
- The deal already cash-flows at list — no discount required.
- Meets the 1% rule at list price ($1k rent vs $70k).
- Recommended offer: $68k (3.0% below list) — sets the bar for market timing.
- Cap rate 14.8% vs local median 9.9% in Jackson — top-decile yield for the area; either an underpriced asset or a hidden risk that comps aren't pricing in. Stress-test before assuming the spread holds.
Location & tenants
- Location reads 68/100 on livability (#66 in MS) — a middle-class / working-renter tenant base. Strengths: commute A+, cost of living A+, housing A+; Watch: amenities F, employment F, health & safety F.
- Jackson Public School District (urban): math 9% / reading 18% proficiency, ranked #112 of 130 in MS (top 86%) — low school quality limits family demand, transient renter base, plan for 1-2y turnover; 88% free/reduced lunch — lower-income household profile, screen leases tightly.
- Zoned schools: Wilkins Elementary School (math 2% / reading 12%, grade F, #337 of 375 statewide, top 94%, 316 students, 100% FRL); Blackburn Middle School (math 9% / reading 11%, grade F, #152 of 179 statewide, top 88%, 614 students, 100% FRL); Wingfield High School (math 7% / reading 12%, grade F, #179 of 197 statewide, top 92%, 608 students, 100% FRL).
- Market conditions: Rents rising fast (+13.6%/yr); 121 active listings in the ZIP; 10 comparable units currently listed for rent nearby; rentals at typical pace (median 23d on market — plan ~3-4 weeks tenant-placement turnaround); lower-income renter base — watch delinquency; 167 units permitted in Hinds County in 2024 (0 in 5+ unit buildings).
Forward outlook
- In year one you build about $7k of equity ($483 loan paydown + $7k appreciation (10.0% local appreciation)).
- Hinds County population projected to shrink 6% by 2050 — rents likely to lag national; underwrite the cash flow, not the appreciation.
- At projected returns (10.0% appreciation + 8.0% rent growth), your $20k cash investment doubles in ~2 years — after that, you're playing with house money.
- By year 5, paydown + projected appreciation supports a ~$35k cash-out refi (75% LTV) — recoverable capital for the next deal without selling this one.
Negotiation context
- It's been on market 34 days — a 3% lower offer ($68k) is reasonable based on typical stale-listing flexibility.
- 5 sale attempts since 24y ago with the ask held roughly flat each time — persistent listings suggest the price (not the market) is what's stuck; bring a comps-based counter.
Risks & watch-outs
- Watch-outs: built in 1956 — expect roof / HVAC / electrical / plumbing capex.
- Climate carrying-cost: severe wind risk, 80% chance of damaging wind over 30y; extreme-heat days projected 6→17/yr by 2055 (HVAC capex compounding) — expect insurance premiums to compound above CPI over the hold.
Questions for the listing agent
- It's been on market 34 days. Have you received any prior offers? Is the seller open to a 3% concession, seller financing, or rate buy-down credit?
- Built in 1956 — when were the roof, HVAC, electrical panel, plumbing, and water heater last replaced?
- Is there a deadline driving the sale (1031 exchange, divorce, estate, relocation)? That informs how much negotiation room exists.
- Schools are F-rated, which usually means shorter tenancies and higher turnover. Who's the typical renter profile here, and what's been the actual vacancy rate?
- What's the average days-on-market for RENTAL listings here right now (not sales)? A rising rental-DOM trend means longer vacancies and softer asking-rent achievability than the comps imply.
- What's the recent tenant-quality profile in this submarket — average credit score on applications, eviction rate, late-payment / NSF rate, and stable-employment percentage? A property-management company in the area should have these aggregated.
- How much new for-sale + rental construction is in the pipeline within 1–3 miles? Heavy new supply typically softens prices + rents 12–24 months out; constrained supply supports both.
Investment metrics
- 1% rule
- 1.77% ✓
- Cap rate
- 14.81%
- Cash-on-cash
- 30.42%
- DSCR
- 2.35
- GRM
- 4.7
CMA / ARV
- ARV (median comp)
- $45,968
- List price
- $69,900
- Delta
- 52.06%
- Verdict
- OVERPRICED
- Comps
- 20 within 1.0 mi
Show comp detail 6 sales within ~0.75 mi
| Address | Dist | Beds/Ba | Sqft | Sold | Price | $/sf | Match |
|---|---|---|---|---|---|---|---|
| 1725 Camellia Ln | 0.25mi | 3/1.5 | 1,134 (+8%) | 3mo | $40,000 | $35 | 71 |
| 1723 Casteel Dr | 0.27mi | 3/1.0 | 1,161 (+10%) | 7mo | $55,000 | $47 | 65 |
| 1918 Elaine St | 0.59mi | 3/1.5 | 1,092 (+4%) | 8mo | $85,000 | $78 | 58 |
| 1904 Willaneel Dr | 0.62mi | 2/1.0 (-1) | 1,091 (+3%) | 6mo | $15,000 | $14 | 55 |
| 27 Wisteria Ct | 0.63mi | 3/2.0 | 1,066 (+1%) | 12mo | $59,000 | $55 | 55 |
| 1906 Shamrock Dr | 0.64mi | 3/1.5 | 1,156 (+10%) | 5mo | $59,000 | $51 | 48 |
Match score weights: distance 35% · size 25% · config 20% · recency 20%. Top-matched comps best support the ARV.
Projected returns pro-forma
10.0% appreciation · 8.0% rent growth · sell at horizon
- IRR
- 50.5%
- Equity multiple
- 4.89×
- Total profit
- $76,210
- Equity at exit
- $62,971
- IRR
- 46.3%
- Equity multiple
- 12.02×
- Total profit
- $215,768
- Equity at exit
- $135,800
Cash invested: $19,572 (down + closing). Projections, not guarantees.
Landlord ↔ Tenant lean methodology
- Overall (STATE)
- 90 Strongly Landlord-Friendly
- State Mississippi
- 90 Strongly Landlord-Friendly · R+11
- County
- — inherits STATE
- City
- — inherits STATE
ZIP-level market 39204
- Home prices YoY
- 8.0%
- Rents YoY
- 13.6%
- Active inventory
- 121
- Price-to-rent
- 4.7×
Monthly cashflow live
- Estimated rent
- $1,234 high interval (Pro) →
- Mortgage (P&I)
- −$367
- Tax from tax record
- −$83 /mo · $1,000/yr
- Insurance
- −$29
- HOA
- −$0
- Vacancy / Maint / Mgmt
- −$259
- Net cashflow
- $496
Break-even live
UW: 25.0% down · 7.5% · 30yr · 1.5% tax · 5.0% vac · 8.0% maint · 8.0% mgmt
Financing live
Cash to close
- Down payment
- $17,475
- Closing costs
- $2,097
- Reserves months
- —
- Total cash needed
- —
Loan-product check · same deal, 3 products live
Conventional
25% down · 7.5% · 30yr
- Down + closing
- —
- Monthly P&I
- —
- Monthly cashflow
- —
- DSCR
- —
- Eligible?
- —
Personal DTI + credit; lowest rate.
DSCR
20% down · 8.5% · 30yr
- Down + closing
- —
- Monthly P&I
- —
- Monthly cashflow
- —
- DSCR
- —
- Eligible?
- —
No personal income docs; deal must DSCR.
Hard money
10% down · 12.0% · 12mo
- Down + closing
- —
- Monthly P&I
- —
- Monthly cashflow
- —
- DSCR
- —
- Eligible?
- —
Short-term bridge; refi at stabilization.
Rent comps 10 comps
| Address | Beds | Baths | Sqft | Rent | $/sqft | DOM | Units | Dist |
|---|---|---|---|---|---|---|---|---|
| 1645 Camellia Ln Jackson, MS | 3.0 | 2.0 | 1268 | $1,200 | $0.95 | 13d | 1 | 0.19mi |
| 2242 Castle Hill Dr Jackson, MS | 4.0 | 2.0 | 1500 | $1,475 | $0.98 | 23d | 1 | 1.12mi |
| 2242 Castle Hill Dr Jackson, MS | 4.0 | 2.0 | 1500 | $1,475 | $0.98 | 13d | 1 | 1.12mi |
| 2401 Coronet Pl Jackson, MS | 3.0 | 1.0 | 1200 | $1,400 | $1.17 | 23d | 1 | 1.24mi |
| 1805 Hospital Dr Jackson, MS | 3.0 | 2.0 | 1335 | $1,050 | $0.79 | 13d | 1 | 1.40mi |
| 843 Reaves St Jackson, MS | 3.0 | 2.0 | 1408 | $1,084 | $0.77 | 43d | 1 | 1.41mi |
| 1711 Robinson St Jackson, MS | 2.0 | 1.0 | 800 | $800 | $1.00 | 23d | 1 | 1.46mi |
| 4567 Meadowmont Dr Jackson, MS | 3.0 | 1.0 | 912 | $800 | $0.88 | 43d | 1 | 1.46mi |
| 1513 Maria Dr Jackson, MS | 3.0 | 2.0 | 1120 | $1,200 | $1.07 | 23d | 1 | 1.47mi |
| 1513 Maria Dr Jackson, MS | 3.0 | 2.0 | 1120 | $1,200 | $1.07 | 13d | 1 | 1.47mi |
Listing history 32 events
-
2026-06-18days on market $69,900 Active 34 DOM
-
2026-06-17days on market $69,900 Active 33 DOM
-
2026-06-16days on market $69,900 Active 32 DOM
-
2026-06-15days on market $69,900 Active 31 DOM
-
2026-06-14days on market $69,900 Active 29 DOM
-
2026-06-13days on market $69,900 Active 28 DOM
-
2026-06-10days on market $69,900 Active 26 DOM
-
2026-06-09days on market $69,900 Active 25 DOM
-
2026-06-08days on market $69,900 Active 24 DOM
-
2026-06-07days on market $69,900 Active 23 DOM
-
2026-06-05days on market $69,900 Active 20 DOM
-
2026-06-03days on market $69,900 Active 19 DOM
-
2026-06-02days on market $69,900 Active 18 DOM
-
2026-06-01days on market $69,900 Active 17 DOM
-
2026-05-31days on market $69,900 Active 16 DOM
-
2026-05-30days on market $69,900 Active 15 DOM
-
2026-05-15$69,900 Active 480-char remark
-
2021-10-02historical
-
2014-08-08soldstatus
Show marketing remark (380 chars)
Family room, dining, 3br/1ba, and large den. Owner occupants can purchase this home with little as $100 down payment. This is for owner occupants purchasing a HUD Home with FHA financing. SOLD AS IS WHERE IS WITH NO DISCLSOURES. CASE # 281-334908. FHA Financing. Listed As UI(UNINSURED)203K Eligible:Yes. EHO Language: Equal Housing Opportunity. Estimated taxes from Hinds county.
-
2014-06-23$10,800
Show marketing remark (380 chars)
Family room, dining, 3br/1ba, and large den. Owner occupants can purchase this home with little as $100 down payment. This is for owner occupants purchasing a HUD Home with FHA financing. SOLD AS IS WHERE IS WITH NO DISCLSOURES. CASE # 281-334908. FHA Financing. Listed As UI(UNINSURED)203K Eligible:Yes. EHO Language: Equal Housing Opportunity. Estimated taxes from Hinds county.
-
2012-04-24soldstatus
-
2011-09-16$10,400
-
2008-03-25soldstatus
-
2008-03-24soldstatus
-
2007-05-21soldstatus
-
2007-05-08$78,000
-
2002-06-03soldstatus
-
2002-05-24soldstatus
-
2002-04-02$28,400
-
1998-01-20soldstatus
-
1996-08-19soldstatus
ⓘ Source: listings_history table (triggers on properties + properties_extension) + one-shot
backfill from property_details.listing_events for pre-trigger history.
Tax reassessment forecast MS · Resets to sale price
- Current annual tax
- $1,000 · $83/mo
- Projected year-2 tax
- $1,000 · $83/mo
- Expected delta
- $0/yr ($0/mo · 0.0%)
ⓘ Screening estimate from a state-policy table — verify with the county assessor before closing.
Climate risk First Street
- Flood 1/10 Low FEMA zone X (unshaded) · 0% chance over 30 yrs
- Wildfire 1/10 Low
- Heat 7/10 Severe 6 d/yr ≥108°F today · 17 d/yr by 30 yrs out
- Wind 8/10 Severe 80% chance of damaging wind over 30 yrs
- Air quality 1/10 Low 0 unhealthy d/yr today · 0 by 30 yrs out
Nearby sold comps map
Loading sold comps map…
Walkable amenities ~0.75 mi
Loading nearby amenities…
Taxation est. · year 1
- Rental income
- $14,812
- − Mortgage interest
- −$3,915
- − Property taxes
- −$1,000
- − Insurance
- −$350
- − Repairs & maintenance
- −$1,185
- − Management
- −$1,185
- − Depreciation
- −$2,033
- Taxable income
- $5,144
- Est. tax owed @ 24.0%
- −$1,235
- After-tax cash flow
- $4,719/yr
For passive investors: Depreciation is non-cash, so a rental often shows a tax loss while cash-flowing — sheltering income. Rental losses are passive: they offset passive income freely, and up to $25,000/yr can offset ordinary (W-2) income if you actively participate and your MAGI is under $100k (phasing out to $0 by $150k); unused losses carry forward. On sale, claimed depreciation is recaptured at up to 25%, and gains may owe capital-gains tax (a 1031 exchange can defer both). Figures are a year-1 estimate at your 24.0% rate — not tax advice; consult a CPA.
Schools (NCES district)
- District
- Jackson Public School District
- NCES district ID
- 2802190
- Math proficiency
- 9% ▼ -14.00%
- Reading proficiency
- 18% ▼ -7.00%
- Median HH income
- $33,234
- Composite
- 10.89/100
- National rank
- #9755
- State rank
- #112 of 130 in MS
Livability — Jackson
- Score
- 68/100
- State rank
- #66
- US rank
- #9695
Category grades
Schools grade is shown separately in the Schools card above.
Census & demographics
- Census place
- Jackson, MS
- County
- Hinds County · 167,040 people
- City population
- 140,204
- Metro
- Jackson, MS
- Population (ZIP)
- 13,249
- Household income
- $30,237
- Rent vs Own
- Severe rent burden
- 1099.0
Population outlook (Hinds County) Hauer SSP2
- Today (2025)
- 242,528 people
- By 2030
- 241,113 · -0.6%
- By 2040
- 235,557 · -2.9%
- By 2050
- 226,946 · -6.4%
- By 2075
- 199,995 · -17.5%
- By 2100
- 164,165 · -32.3%
Race, ethnicity, and origin ACS 2023
- Neighborhood character
- Predominantly Black (90%)
- Race & ethnicity
- Black 90% White 5% Two or more races 4% Hispanic / Latino 3%
- Foreign-born
- 2% · Canada
- Languages at home
- 97% English-only · Spanish 2%
Political lean MEDSL · Hinds
- 2024 margin
- Solid D (+46.1) · D 72.4% · R 26.3% · Other 1.4%
- 2008→2024 swing
- +7.1pp toward D · 2008: 39.0pp · 2024: 46.1pp
- All cycles
- 2024: D+46.1 2020: D+48.3 2016: D+43.7 2012: D+45.1 2008: D+39.0
Not yet ingested
- Civics
- —
Market trends
- HPI YoY
- ▲ 17.25%
- Current HPI
- 233.9061
- Rent YoY
- ▲ 13.56%
- Metro
- Jackson, MS
- State GDP YoY
- —
- F500 in state
- 0
Price history
+146.1% since first listed16 events — show timeline
- 2026-05-15 Listed $69,900 MLSU
- 2021-10-02 Listing Removed — MLSU
- 2014-08-08 Sold (Public Records) — Public Records
- 2014-08-08 Sold (MLS) — MLSU
- 2014-06-23 Listed $10,800 MLSU
- 2012-04-24 Sold (Public Records) — Public Records
- 2011-09-16 Listed $10,400 MLSU
- 2008-03-25 Sold (MLS) — MLSU
- 2008-03-24 Sold (Public Records) — Public Records
- 2007-05-21 Sold (Public Records) — Public Records
- 2007-05-08 Listed $78,000 MLSU
- 2002-06-03 Sold (Public Records) — Public Records
- 2002-05-24 Sold (MLS) — MLSU
- 2002-04-02 Listed $28,400 MLSU
- 1998-01-20 Sold (Public Records) — Public Records
- 1996-08-19 Sold (Public Records) — Public Records
Property tax history
+1.2%/yrLatest (2025): $1,000 · +1.1% YoY. Source: county tax records.
Cash-flow waterfall
monthlySold comps — $/sqft
last 12 mo · ≤1 miLoading sold comps…