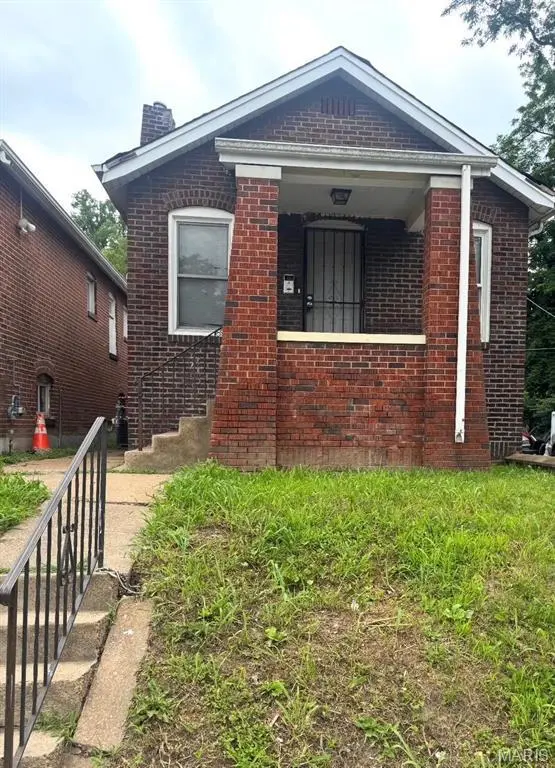
5518 Maffitt Ave · St. Louis, MO
Flood risk 1/10 · Minimal
- FEMA flood zone
- X (unshaded)
- Chance of flooding over 30 yrs
- 0.0%
- Est. flood insurance / yr
- $473 – $860
Fire risk 1/10 · Minimal
- Est. fire insurance / yr
- $1,054 – $1,958
Heat risk 5/10 · Moderate
- Hot days now (above 107°F)
- 7 days/yr
- Hot days in 30 yrs
- 21 days/yr
Wind risk 2/10 · Minimal
- Chance of severe wind over 30 yrs
- 1.0%
Air-quality risk 4/10 · Minor
- Unhealthy air days now
- 4 days/yr
- Unhealthy air days in 30 yrs
- 5 days/yr
Risk factors via First Street. Map © Google.
Why this score? — see what drove the C grade
The composite is a weighted blend of 9 inputs, each scored 0–100. Each bar is that input's sub-score; the figure is the points it added to the 100-point composite (weight × sub-score).
- Cash flow +27.4/30.0
- DSCR +9.6/10.0
- ARV discount +7.5/15.0
- 1% rule +6.1/10.0
- Rent growth +3.1/5.0
- Livability +2.5/5.0
- Condition / age +2.5/5.0
- Schools +1.2/10.0
- Appreciation +0.0/10.0
$110,000
🖨 Deal sheet 📄 Offer letter ✓ Due diligence
Listing remarks MLS
Brick 2 bedroom, 1 bath home with covered front porch and fenced yard.
Key facts
- 2,800 sq ft lot
- Built 1923
- Listed 6 days
Property features AI
Exterior
- Parking: Off-street parking
- Utilities: Public water; Public sewer; Electric service (other)
- Home design: Single-family residence; One story; Residential property
- Construction: Brick construction
- Exterior features: Front porch; Level lot
Interior
- Bedrooms: Two bedrooms on the main level
- Bathrooms: One full bathroom on the main level
- Heating & cooling: Forced air heating; Central air conditioning
- Interior features: Full basement; Decorative fireplace in the living room; Central air
Neighborhood map
What this means for you Summary
Snapshot
- This is a 2-bed/1.0-bath single-family listed at $110k.
Deal economics
- At list price, monthly cash flow is $323 ($4k/yr) — positive.
- The deal already cash-flows at list — no discount required.
- Meets the 1% rule at list price ($1k rent vs $110k).
- Cap rate 9.8% vs local median 5.0% in St. Louis — top-decile yield for the area; either an underpriced asset or a hidden risk that comps aren't pricing in. Stress-test before assuming the spread holds.
Location & tenants
- Location reads: area grade C — affects rentability + tenant quality, not the cash-flow math above.
- St. Louis City (urban): math 10% / reading 18% proficiency, ranked #312 of 324 in MO (top 96%) — low school quality limits family demand, transient renter base, plan for 1-2y turnover; 80% free/reduced lunch — lower-income household profile, screen leases tightly.
- Zoned schools: Laclede Elem. (math 2% / reading 8%, grade F, #1,072 of 1,115 statewide, top 98%, 264 students, 99% FRL); Sumner High (math 2% / reading 2%, grade F, #520 of 521 statewide, top 100%, 264 students, 99% FRL) — zoned schools average 99% FRL vs 80% district-wide (18 pts higher); higher-poverty schools than district average — tighter screening recommended.
- Market conditions: Rents rising (+2.4%/yr); 118 active listings in the ZIP; 25 comparable units currently listed for rent nearby; rentals lingering (median 44d on market — plan ~5-8 weeks vacancy on turnover, expect pricing pressure); 52% of comp listings sitting > 30 days — soft ceiling on asking rent; 294 units permitted in St. Louis city in 2024 (227 in 5+ unit buildings).
- This rent runs 32% of the median local income ($46k/yr) — at the standard rent-burdened threshold; future hikes will face affordability resistance.
Forward outlook
- Local home prices are declining (-3.0%/yr); year-one equity from $761 of loan paydown is wiped out by about $3k of value loss. Plan a longer hold.
- St. Louis County population projected to shrink 6% by 2050 — rents likely to lag national; underwrite the cash flow, not the appreciation.
- At projected returns (-3.0% appreciation + 2.4% rent growth), your $31k cash investment doubles in ~10 years — after that, you're playing with house money.
Negotiation context
- Only 6 days on market — expect competitive offers; lowballing is unlikely to land.
- 2 sale attempts since 13y ago with the ask held roughly flat each time — persistent listings suggest the price (not the market) is what's stuck; bring a comps-based counter.
Risks & watch-outs
- Watch-outs: built in 1923 — expect roof / HVAC / electrical / plumbing capex.
- Climate carrying-cost: extreme-heat days projected 7→21/yr by 2055 (HVAC capex compounding) — expect insurance premiums to compound above CPI over the hold.
Questions for the listing agent
- Built in 1923 — when were the roof, HVAC, electrical panel, plumbing, and water heater last replaced?
- Is there a deadline driving the sale (1031 exchange, divorce, estate, relocation)? That informs how much negotiation room exists.
- What's the average days-on-market for RENTAL listings here right now (not sales)? A rising rental-DOM trend means longer vacancies and softer asking-rent achievability than the comps imply.
- What's the recent tenant-quality profile in this submarket — average credit score on applications, eviction rate, late-payment / NSF rate, and stable-employment percentage? A property-management company in the area should have these aggregated.
- How much new for-sale + rental construction is in the pipeline within 1–3 miles? Heavy new supply typically softens prices + rents 12–24 months out; constrained supply supports both.
Investment metrics
- 1% rule
- 1.11% ✓
- Cap rate
- 9.82%
- Cash-on-cash
- 12.58%
- DSCR
- 1.56
- GRM
- 7.5
CMA / ARV
- ARV (on-the-fly)
- $28,834
- Comps found
- 12
Show comp detail 12 sales within ~0.75 mi
| Address | Dist | Beds/Ba | Sqft | Sold | Price | $/sf | Match |
|---|---|---|---|---|---|---|---|
| 5359 Maffitt Ave | 0.28mi | 3/1.0 (+1) | 1,091 (-2%) | 14mo | $25,000 | $23 | 68 |
| 2917 Abner Pl | 0.36mi | 3/1.0 (+1) | 1,104 (-0%) | 13mo | $25,000 | $23 | 67 |
| 5126 Terry Ave | 0.61mi | 2/1.0 | 1,091 (-2%) | 6mo | $4,900 | $4 | 64 |
| 2810 Arlington Ave | 0.23mi | 2/1.0 | 968 (-13%) | 5mo | $25,000 | $26 | 64 |
| 1636 Belt Ave | 0.30mi | 2/1.0 | 1,003 (-10%) | 9mo | $19,900 | $20 | 63 |
| 5710 Saint Louis Ave | 0.34mi | 2/1.0 | 1,000 (-10%) | 7mo | $25,000 | $25 | 62 |
| 1632 Belt Ave | 0.31mi | 2/1.0 | 1,003 (-10%) | 12mo | $37,900 | $38 | 60 |
| 5226 Saint Louis Ave | 0.52mi | 2/1.0 | 1,050 (-5%) | 11mo | $65,000 | $62 | 58 |
| 5202 Maffitt Ave | 0.54mi | 2/1.0 | 1,157 (+4%) | 13mo | $19,900 | $17 | 56 |
| 5232 Highland Ave | 0.48mi | 3/1.5 (+1) | 1,030 (-7%) | 6mo | $65,000 | $63 | 54 |
| 5109 Cote Brilliante Ave | 0.67mi | 2/1.0 | 1,188 (+7%) | 4mo | $52,000 | $44 | 54 |
| 5124 Lotus Ave | 0.63mi | 3/1.0 (+1) | 960 (-13%) | 15mo | $30,000 | $31 | 31 |
Match score weights: distance 35% · size 25% · config 20% · recency 20%. Top-matched comps best support the ARV.
Projected returns pro-forma
-3.0% appreciation · 2.39% rent growth · sell at horizon
- IRR
- 1.7%
- Equity multiple
- 1.06×
- Total profit
- $1,941
- Equity at exit
- $16,401
- IRR
- 10.7%
- Equity multiple
- 1.81×
- Total profit
- $24,931
- Equity at exit
- $9,511
Cash invested: $30,800 (down + closing). Projections, not guarantees.
Landlord ↔ Tenant lean methodology
- Overall (STATE)
- 81 Strongly Landlord-Friendly
- State Missouri
- 81 Strongly Landlord-Friendly · R+10
- County
- — inherits STATE
- City
- — inherits STATE
ZIP-level market 63112
- Rents YoY
- 2.4%
- Active inventory
- 118
- Price-to-rent
- 7.5×
Monthly cashflow live
- Estimated rent
- $1,221 high interval (Pro) →
- Mortgage (P&I)
- −$577
- Tax from tax record
- −$19 /mo · $224/yr
- Insurance
- −$46
- HOA
- −$0
- Vacancy / Maint / Mgmt
- −$256
- Net cashflow
- $323
Break-even live
UW: 25.0% down · 7.5% · 30yr · 1.5% tax · 5.0% vac · 8.0% maint · 8.0% mgmt
Financing live
Cash to close
- Down payment
- $27,500
- Closing costs
- $3,300
- Reserves months
- —
- Total cash needed
- —
Loan-product check · same deal, 3 products live
Conventional
25% down · 7.5% · 30yr
- Down + closing
- —
- Monthly P&I
- —
- Monthly cashflow
- —
- DSCR
- —
- Eligible?
- —
Personal DTI + credit; lowest rate.
DSCR
20% down · 8.5% · 30yr
- Down + closing
- —
- Monthly P&I
- —
- Monthly cashflow
- —
- DSCR
- —
- Eligible?
- —
No personal income docs; deal must DSCR.
Hard money
10% down · 12.0% · 12mo
- Down + closing
- —
- Monthly P&I
- —
- Monthly cashflow
- —
- DSCR
- —
- Eligible?
- —
Short-term bridge; refi at stabilization.
Rent comps 25 comps
| Address | Beds | Baths | Sqft | Rent | $/sqft | DOM | Units | Dist |
|---|---|---|---|---|---|---|---|---|
| 5608 Wabada Ave Saint Louis, MO | 2.0 | 1.0 | 910 | $1,300 | $1.43 | 16d | 1 | 0.19mi |
| 1965 Arlington Ave Saint Louis, MO | 3.0 | 1.0 | 980 | $1,300 | $1.33 | 4d | 1 | 0.21mi |
| 5662 Maffitt Ave Saint Louis, MO | 2.0 | 1.0 | 850 | $895 | $1.05 | 7d | 1 | 0.26mi |
| 2831 Abner Pl Unit 7 St. Louis, MO | 2.0 | 1.0 | 968 | $1,250 | $1.29 | 23d | 1 | 0.30mi |
| 5333 Patton Ave St. Louis, MO | 3.0 | 1.5 | 1262 | $1,250 | $0.99 | 43d | 1 | 0.42mi |
| 5345 Wells Ave Unit 2ND St. Louis, MO | 3.0 | 1.0 | 1127 | $1,095 | $0.97 | 23d | 1 | 0.58mi |
| 1420 Union Blvd Unit 2F St. Louis, MO | 2.0 | 1.0 | 1096 | $995 | $0.91 | 43d | 1 | 0.70mi |
| 5203 Page Blvd Unit 5201 1st Floor St. Louis, MO | 2.0 | 1.0 | 1000 | $750 | $0.75 | 14d | 1 | 0.91mi |
| 1324 Academy Ave Unit C St. Louis, MO | 1.0 | 1.0 | 1000 | $890 | $0.89 | 43d | 1 | 0.92mi |
| 5818 Ferris Ave Saint Louis, MO | 3.0 | 1.0 | 1014 | $1,500 | $1.48 | 43d | 1 | 0.92mi |
| 3720 Darby St Saint Louis, MO | 2.0 | 1.0 | 960 | $1,123 | $1.17 | 43d | 1 | 1.06mi |
| 1266 Amherst Pl Unit 2nd floor St. Louis, MO | 2.0 | 1.0 | 1050 | $1,000 | $0.95 | 43d | 1 | 1.08mi |
| 5989 Julian Ave Unit 37 St. Louis, MO | 2.0 | 1.0 | 780 | $1,200 | $1.54 | 17d | 1 | 1.10mi |
| 5345 Cabanne Ave Unit 5345 Cabanne 1S St. Louis, MO | 2.0 | 1.0 | 800 | $950 | $1.19 | 43d | 1 | 1.12mi |
| 1232 N Euclid Ave Saint Louis, MO | 3.0 | 1.5 | 982 | $1,395 | $1.42 | 43d | 1 | 1.23mi |
| 4627 Maffitt Ave Saint Louis, MO | 2.0 | 1.0 | 704 | $795 | $1.13 | 43d | 1 | 1.34mi |
| 5811 Cabanne Ave St. Louis, MO | 2.0 | 1.0 | 800 | $1,250 | $1.56 | 43d | 1 | 1.36mi |
| 5130 Kensington Ave Unit 1 St. Louis, MO | 3.0 | 2.0 | 1200 | $1,245 | $1.04 | 23d | 1 | 1.37mi |
| 5572 Clemens Ave Unit 1W St. Louis, MO | 3.0 | 1.0 | 900 | $1,025 | $1.14 | 14d | 1 | 1.40mi |
| 1131 Hodiamont Ave St. Louis, MO | 2.0 | 1.0 | 700 | $1,050 | $1.50 | 43d | 1 | 1.41mi |
| 1131 Hodiamont Ave Unit 1135-2D St. Louis, MO | 3.0 | 1.0 | 840 | $1,225 | $1.46 | 43d | 1 | 1.41mi |
| 5804 Cates Ave Unit 2 St. Louis, MO | 3.0 | 1.0 | 1500 | $1,500 | $1.00 | 4d | 1 | 1.45mi |
| 4040 Shreve Ave Saint Louis, MO | 3.0 | 1.0 | 1201 | $1,250 | $1.04 | 43d | 1 | 1.47mi |
| 4715 Thrush Ave Unit 24 St. Louis, MO | 2.0 | 1.0 | 900 | $1,350 | $1.50 | 23d | 1 | 1.49mi |
| 5535 Delmar Blvd St. Louis, MO | 1.0–2.0 | 1.0–2.0 | 911 | $1,970 | $2.16 | 1d | 14 | 1.50mi |
Listing history 6 events
-
2026-06-18days on market $110,000 Active 6 DOM
-
2026-06-17days on market $110,000 Active 5 DOM
-
2026-06-16days on market $110,000 Active 4 DOM
-
2026-06-15days on market $110,000 Active 3 DOM
-
2026-06-13remarks 303-char remark
-
2026-06-13$110,000 Active 1 DOM
ⓘ Source: listings_history table (triggers on properties + properties_extension) + one-shot
backfill from property_details.listing_events for pre-trigger history.
Tax reassessment forecast MO · Resets to sale price
- Current annual tax
- $224 · $19/mo
- Projected year-2 tax
- $1,067 · $89/mo
- Expected delta
- +$843/yr (+$70/mo · 376.6%)
ⓘ Screening estimate from a state-policy table — verify with the county assessor before closing.
Climate risk First Street
- Flood 1/10 Low FEMA zone X (unshaded) · 0% chance over 30 yrs
- Wildfire 1/10 Low
- Heat 5/10 Major 7 d/yr ≥107°F today · 21 d/yr by 30 yrs out
- Wind 2/10 Low 100% chance of damaging wind over 30 yrs
- Air quality 4/10 Moderate 4 unhealthy d/yr today · 5 by 30 yrs out
Nearby sold comps map
Loading sold comps map…
Walkable amenities ~0.75 mi
Loading nearby amenities…
Taxation est. · year 1
- Rental income
- $14,647
- − Mortgage interest
- −$6,162
- − Property taxes
- −$224
- − Insurance
- −$550
- − Repairs & maintenance
- −$1,172
- − Management
- −$1,172
- − Depreciation
- −$3,200
- Taxable income
- $2,168
- Est. tax owed @ 24.0%
- −$520
- After-tax cash flow
- $3,355/yr
For passive investors: Depreciation is non-cash, so a rental often shows a tax loss while cash-flowing — sheltering income. Rental losses are passive: they offset passive income freely, and up to $25,000/yr can offset ordinary (W-2) income if you actively participate and your MAGI is under $100k (phasing out to $0 by $150k); unused losses carry forward. On sale, claimed depreciation is recaptured at up to 25%, and gains may owe capital-gains tax (a 1031 exchange can defer both). Figures are a year-1 estimate at your 24.0% rate — not tax advice; consult a CPA.
Schools (NCES district)
- District
- St. Louis City
- NCES district ID
- 2929280
- Math proficiency
- 10% ▼ -6.00%
- Reading proficiency
- 18% ▼ -3.00%
- Median HH income
- $35,685
- Composite
- 11.54/100
- National rank
- #9699
- State rank
- #312 of 324 in MO
Livability — St. Louis
No livability data for this city. (Only ~50 U.S. cities are tracked.)
Census & demographics
- Census place
- St. Louis, MO
- County
- Saint Louis City · 254,015 people
- City population
- 283,259
- Metro
- St. Louis, MO-IL
- Population (ZIP)
- 17,985
- Household income
- $45,542
- Rent vs Own
- Severe rent burden
- 1457.0
Population outlook (St. Louis County) Hauer SSP2
- Today (2025)
- 315,737 people
- By 2030
- 313,865 · -0.6%
- By 2040
- 305,439 · -3.3%
- By 2050
- 296,529 · -6.1%
- By 2075
- 271,028 · -14.2%
- By 2100
- 255,359 · -19.1%
Race, ethnicity, and origin ACS 2023
- Neighborhood character
- Majority Black (63%)
- Race & ethnicity
- Black 63% White 24% Asian 6% Two or more races 5% Hispanic / Latino 4%
- Common ancestry
- Lithuanian 1% Scotch-Irish 1% Romanian 1%
- Foreign-born
- 9% · China, South Korea, Canada
- Languages at home
- 88% English-only · Spanish 3% Chinese 2% Korean 2%
Political lean MEDSL · St. Louis
- 2024 margin
- Solid D (+64.7) · D 81.4% · R 16.7% · Other 2.0%
- 2008→2024 swing
- -3.5pp toward R · 2008: 68.2pp · 2024: 64.7pp
- All cycles
- 2024: D+64.7 2020: D+66.2 2016: D+63.7 2012: D+66.6 2008: D+68.2
Not yet ingested
- Civics
- —
Market trends
- HPI YoY
- ▼ -158.94%
- Current HPI
- 115.1863
- Rent YoY
- ▲ 2.39%
- Metro
- St. Louis, MO-IL
- State GDP YoY
- ▲ 1.84%
- F500 in state
- 20
Industry mix (Fortune 500 HQ in MO)
| Industry | F500 HQs | Revenue |
|---|---|---|
| Healthcare | 1 | $163B |
|
||
| Insurance | 1 | $21B |
|
||
| Industrial Technology | 1 | $17B |
|
||
| Retail | 1 | $16B |
|
||
| Industrial Distribution | 1 | $10B |
|
||
| Utilities | 1 | $9B |
|
||
Price history
+1011.1% since first listed4 events — show timeline
- 2026-06-12 Listed $110,000 MARIS as Distributed by MLS Grid
- 2013-06-10 Sold (MLS) — MARIS as Distributed by MLS Grid
- 2013-05-09 Sold (Public Records) — Public Records
- 2013-04-25 Listed $9,900 MARIS as Distributed by MLS Grid
Property tax history
-1.0%/yrLatest (2024): $224 · +4.5% YoY. Source: county tax records.
Cash-flow waterfall
monthlySold comps — $/sqft
last 12 mo · ≤1 miLoading sold comps…