308 W 8th St #201 · Kansas City, MO
Flood risk No data
- FEMA flood zone
- —
- Chance of flooding over 30 yrs
- —
- Est. flood insurance / yr
- —
Fire risk No data
- Est. fire insurance / yr
- —
Heat risk No data
- Hot days now (above threshold)
- —
- Hot days in 30 yrs
- —
Wind risk No data
- Chance of severe wind over 30 yrs
- —
Air-quality risk No data
- Unhealthy air days now
- —
- Unhealthy air days in 30 yrs
- —
Risk factors via First Street. Map © Google.
Why this score? — see what drove the F grade
The composite is a weighted blend of 9 inputs, each scored 0–100. Each bar is that input's sub-score; the figure is the points it added to the 100-point composite (weight × sub-score).
- ARV discount +12.6/15.0
- Appreciation +4.8/10.0
- Livability +3.9/5.0
- 1% rule +3.6/10.0
- Condition / age +2.5/5.0
- Rent growth +1.7/5.0
- Schools +1.5/10.0
- Cash flow +0.9/30.0
- DSCR +0.0/10.0
$169,900
🖨 Deal sheet 📄 Offer letter ✓ Due diligence
Listing remarks
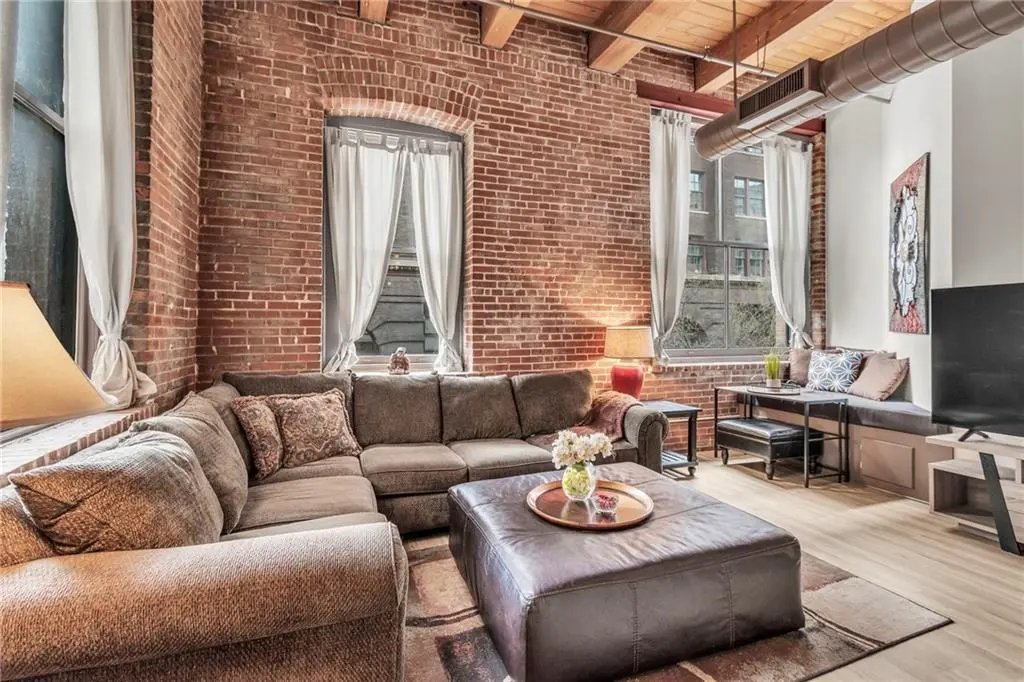
Come live the downtown lifestyle in this stunning raised one bedroom loft with large windows and romantic city views, not to mention the warm exposed bricks and timber beams in this gorgeous corner end condo. This charming turn key condo has a storage unit included on same floor. Prime secured parking on same floor available to rent in adjoining building. Historic SoHo Lofts not only offer a prime location in the Garment District, but also an array of amenities to enhance your living experience. The building offers a rooftop deck with 360 degree views of Kansas City, as well as a gym, yoga room, sauna, and community center. The Phoenix is close by along with many restaurants, and a plethora
Key facts
- Garage
- Built 1899
- Listed 42 days
Property features AI
Finance
- Other: Metered on-street parking nearby (directions: Broadway to 8th Street; enter south side of the building); Living area reported as 780 above-grade square feet; Not located in a flood plain
- Financial info: Association fee applies
- HOA & community: HOA managed by First Service Residential; HOA amenities include laundry, exercise room, storage, party room, and sauna; HOA covers building maintenance, curbside recycling, lawn service, management, insurance, roof repair and replacement, snow removal, trash, and water
Exterior
- Parking: Attached leased secured parking; Garage available
- Security: Security system; Smoke detectors
- Utilities: Public water; Public sewer; Cable available; High-speed internet available
- Home design: Residential condominium; Attached property; Loft floor plan; Over 100 years old
- Construction: Brick construction; Tar and gravel roof; Cellar basement
- Exterior features: City lot; Publicly maintained road
Interior
- Kitchen: Dishwasher; Garbage disposal; Microwave; Refrigerator; Electric range; Stainless steel appliances; Eat-in kitchen
- Bedrooms: 1 bedroom (first level)
- Flooring: Carpet in bedroom(s)
- Bathrooms: 1 full bathroom
- Heating & cooling: Electric heating; Electric cooling; Has cooling
- Interior features: Ceiling fans; Sauna; Vaulted ceilings; Walk-in closet(s); Window coverings
- Laundry & utility: Laundry in basement
Neighborhood map
What this means for you Summary
Snapshot
- This is a 1-bed/1.0-bath condo listed at $170k.
Deal economics
- At list price, monthly cash flow is $-710 ($-9k/yr) — negative.
- To cash-flow at today's rent, offer at most $150k (11.6% below list).
- To meet the 1% rule (rent ≥ 1% of price), the offer needs to be $146k (14.1% below list).
- Recommended offer: $146k (14.1% below list) — sets the bar for 1% rule.
- Cap rate 1.3% vs local median 3.9% in Kansas City — below-typical yield; the buyer is paying a premium for something (appreciation thesis, condition, location) that the cap rate doesn't capture.
Location & tenants
- Location reads 78/100 on livability (#28 in MO, #2,671 nationally) — a middle-class / working-renter tenant base. Strengths: amenities A+, commute A+, cost of living A+; Watch: schools C-, crime F.
- Kansas City 33 (urban): math 12% / reading 24% proficiency, ranked #308 of 324 in MO (top 95%) — low school quality limits family demand, transient renter base, plan for 1-2y turnover; 75% free/reduced lunch — lower-income household profile, screen leases tightly.
- Market conditions: Rents falling (-3.2%/yr); 56 active listings in the ZIP; 40 comparable units currently listed for rent nearby; rentals leasing fast (median 8d on market — plan ~1-2 weeks tenant-placement turnaround); 4,002 units permitted in Jackson County in 2024 (2,271 in 5+ unit buildings).
Forward outlook
- In year one you build about $617 of equity ($1k loan paydown + $-558 appreciation (-0.3% local appreciation)).
- Jackson County population projected at +4% by 2050 — modest demand growth; plan on rents tracking national, not racing it.
Negotiation context
- It's been on market 42 days — a 3% lower offer ($165k) is reasonable based on typical stale-listing flexibility.
- 7 sale attempts since 8y ago with the ask held roughly flat each time — persistent listings suggest the price (not the market) is what's stuck; bring a comps-based counter.
Risks & watch-outs
- Watch-outs: HOA is 41% of rent; built in 1899 — expect roof / HVAC / electrical / plumbing capex.
Questions for the listing agent
- What do current leases actually rent for vs. the listed asking? Can we see a recent rent roll and the last 12 months of T-12 income?
- It's been on market 42 days. Have you received any prior offers? Is the seller open to a 14% concession, seller financing, or rate buy-down credit?
- Built in 1899 — when were the roof, HVAC, electrical panel, plumbing, and water heater last replaced?
- What does the HOA fee cover, when was the last increase, and are there any pending special assessments or reserve-fund shortfalls?
- Any open or pending special assessments — roof, HVAC, plumbing, elevator, façade? What's the per-unit balance and payoff schedule, and is the seller paying it off at close or rolling it to the buyer?
- Is there a deadline driving the sale (1031 exchange, divorce, estate, relocation)? That informs how much negotiation room exists.
- Crime grade is F in this area — have there been break-ins, vandalism, or insurance claims at this property in the last 3 years? What carrier currently insures it and at what premium?
- The area grade is low — what's the realistic commute time and amenity access for the typical tenant pool here? Any planned neighborhood developments (good or bad) we should know about?
- What's the average days-on-market for RENTAL listings here right now (not sales)? A rising rental-DOM trend means longer vacancies and softer asking-rent achievability than the comps imply.
- What's the recent tenant-quality profile in this submarket — average credit score on applications, eviction rate, late-payment / NSF rate, and stable-employment percentage? A property-management company in the area should have these aggregated.
- How much new apartment / multifamily construction is in the pipeline within 1–3 miles? Heavy new supply (>2% of stock underway) typically softens rents 12–24 months out; light construction supports rent growth.
Investment metrics
- 1% rule
- 0.86% ✗
- Cap rate
- 1.28%
- Cash-on-cash
- -17.90%
- DSCR
- 0.20
- GRM
- 9.7
CMA / ARV
- ARV (median comp)
- $191,699
- List price
- $169,900
- Delta
- -11.37%
- Verdict
- UNDERPRICED
- Comps
- 20 within 1.0 mi
Projected returns pro-forma
-0.33% appreciation · 0.0% rent growth · sell at horizon
- IRR
- -27.5%
- Equity multiple
- -0.19×
- Total profit
- $-56,612
- Equity at exit
- $46,564
- IRR
- -24.2%
- Equity multiple
- -1.16×
- Total profit
- $-102,836
- Equity at exit
- $53,807
Cash invested: $47,572 (down + closing). Projections, not guarantees.
Landlord ↔ Tenant lean methodology
- Overall (STATE)
- 81 Strongly Landlord-Friendly
- State Missouri
- 81 Strongly Landlord-Friendly · R+10
- County
- — inherits STATE
- City
- — inherits STATE
ZIP-level market 64105
- Home prices YoY
- -0.2%
- Rents YoY
- -3.2%
- Active inventory
- 56
- Price-to-rent
- 9.7×
Monthly cashflow live
- Estimated rent
- $1,459 high interval (Pro) →
- Mortgage (P&I)
- −$891
- Tax from tax record
- −$303 /mo · $3,635/yr
- Insurance
- −$71
- HOA est. from 7 same-building comps
- −$598
- Vacancy / Maint / Mgmt
- −$306
- Net cashflow
- $-710
Break-even live
Sensitivity live
| Price | -10% $-614 | -5% $-662 | +0% $-710 | +5% $-758 | +10% $-806 |
|---|---|---|---|---|---|
| Rent | -10% $-825 | -5% $-767 | +0% $-710 | +5% $-652 | +10% $-594 |
| Rate | -1.0pp $-624 | -0.5pp $-667 | base $-710 | +0.5pp $-754 | +1.0pp $-799 |
UW: 25.0% down · 7.5% · 30yr · 1.5% tax · 5.0% vac · 8.0% maint · 8.0% mgmt
Financing live
Cash to close
- Down payment
- $42,475
- Closing costs
- $5,097
- Reserves months
- —
- Total cash needed
- —
Loan-product check · same deal, 3 products live
Conventional
25% down · 7.5% · 30yr
- Down + closing
- —
- Monthly P&I
- —
- Monthly cashflow
- —
- DSCR
- —
- Eligible?
- —
Personal DTI + credit; lowest rate.
DSCR
20% down · 8.5% · 30yr
- Down + closing
- —
- Monthly P&I
- —
- Monthly cashflow
- —
- DSCR
- —
- Eligible?
- —
No personal income docs; deal must DSCR.
Hard money
10% down · 12.0% · 12mo
- Down + closing
- —
- Monthly P&I
- —
- Monthly cashflow
- —
- DSCR
- —
- Eligible?
- —
Short-term bridge; refi at stabilization.
Rent comps 40 comps
| Address | Beds | Baths | Sqft | Rent | $/sqft | DOM | Units | Dist |
|---|---|---|---|---|---|---|---|---|
| 323 W 8th St Kansas City, MO | 1.0–2.0 | 1.0–2.0 | 816 | $1,355 | $1.66 | 3d | 14 | 0.03mi |
| 701 Broadway Blvd Kansas City, MO | 2.0 | 1.0–2.0 | 1059 | $1,972 | $1.86 | 2d | 12 | 0.04mi |
| 320 W 7th St Kansas City, MO | 1.0 | 1.0 | 1055 | $1,625 | $1.54 | 44d | 1 | 0.06mi |
| 320 W 7th St Kansas City, MO | — | 1.0 | 681 | $1,190 | $1.75 | 44d | 1 | 0.06mi |
| 700 Broadway Blvd #308 Kansas City, MO | — | 1.0 | 793 | $1,550 | $1.95 | 4d | 1 | 0.07mi |
| 802 Broadway Blvd Kansas City, MO | 1.0 | 1.0 | 567 | $1,246 | $2.20 | 24d | 1 | 0.09mi |
| 800 Broadway Blvd Kansas City, MO | 1.0 | 1.0 | 505 | $1,499 | $2.97 | 8d | 6 | 0.09mi |
| 110 W 9th St Kansas City, MO | 2.0 | 1.0 | 867 | $2,030 | $2.34 | 44d | 1 | 0.14mi |
| 112 W 9th St Kansas City, MO | 1.0 | 1.0 | 660 | $1,520 | $2.30 | 13d | 2 | 0.15mi |
| 920 Broadway Blvd Kansas City, MO | 1.0 | 1.0 | 760 | $1,196 | $1.57 | 44d | 1 | 0.16mi |
| 720 Main St Kansas City, MO | 2.0 | 1.0–2.0 | 723 | $1,358 | $1.88 | 2d | 22 | 0.16mi |
| 237 W 4th St Kansas City, MO | 1.0–2.0 | 1.0–2.5 | 988 | $1,370 | $1.39 | 2d | 12 | 0.22mi |
| 204 W 5th St Kansas City, MO | 1.0 | 1.0 | 810 | $1,690 | $2.09 | 8d | 1 | 0.23mi |
| 127 W 10th St Kansas City, MO | 2.0 | 1.0–2.0 | 766 | $1,385 | $1.81 | 24d | 12 | 0.24mi |
| 1004 Baltimore Ave Kansas City, MO | 1.0–2.0 | 1.0–2.0 | 1015 | $1,250 | $1.23 | 2d | 8 | 0.24mi |
| 920 Main St Kansas City, MO | 1.0–2.0 | 1.0–2.0 | 897 | $1,900 | $2.12 | 21d | 5 | 0.26mi |
| 920 Main St Kansas City, MO | 1.0–2.0 | 1.0–2.0 | 897 | $1,375 | $1.53 | 17d | 1 | 0.26mi |
| 911 Main St Kansas City, MO | 2.0 | 1.0–2.0 | 1018 | $2,415 | $2.37 | 2d | 18 | 0.26mi |
| 722 Walnut St Kansas City, MO | 2.0 | 1.0 | 582 | $1,124 | $1.93 | 2d | 15 | 0.27mi |
| 106 W 11th St Kansas City, MO | 2.0 | 1.0–2.0 | 838 | $1,700 | $2.03 | 3d | 28 | 0.30mi |
| 401 Delaware St Kansas City, MO | 1.0–2.0 | 1.0–2.0 | 880 | $1,203 | $1.37 | 2d | 12 | 0.31mi |
| 101 W 11th St Kansas City, MO | 1.0 | 1.0 | 585 | $1,325 | $2.26 | 44d | 2 | 0.32mi |
| 1003 Walnut St Kansas City, MO | 1.0–2.0 | 1.0 | 750 | $1,300 | $1.73 | 24d | 12 | 0.35mi |
| 309 Delaware St Kansas City, MO | 1.0 | 1.0 | 824 | $1,450 | $1.76 | 3d | 1 | 0.35mi |
| 309 Delaware St Kansas City, MO | 1.0 | 1.0 | 826 | $1,450 | $1.75 | 2d | 1 | 0.35mi |
| 309 Delaware St Kansas City, MO | — | 1.0 | 697 | $1,218 | $1.75 | 24d | 2 | 0.35mi |
| 1114 Baltimore Ave Kansas City, MO | 1.0 | 1.0–1.5 | 540 | $1,340 | $2.48 | 15d | 3 | 0.35mi |
| 201 Wyandotte St Kansas City, MO | 1.0 | 1.0 | 847 | $1,350 | $1.59 | 8d | 2 | 0.36mi |
| 1050 Jefferson St Kansas City, MO | 1.0–2.0 | 1.0–2.0 | 1166 | $1,651 | $1.42 | 3d | 17 | 0.37mi |
| 1050 Jefferson St Kansas City, MO | 1.0–2.0 | 1.0–2.0 | 1166 | $1,605 | $1.38 | 44d | 17 | 0.37mi |
| 220 Admiral Blvd Kansas City, MO | 1.0 | 1.0 | 1226 | $1,300 | $1.06 | 44d | 4 | 0.39mi |
| 1200 Washington St Kansas City, MO | 1.0–2.0 | 1.0–2.0 | 1011 | $1,503 | $1.49 | 44d | 17 | 0.40mi |
| 1200 Washington St Kansas City, MO | 1.0–2.0 | 1.0–2.0 | 1093 | $1,642 | $1.50 | 3d | 16 | 0.40mi |
| 1221 Baltimore Ave Kansas City, MO | 1.0 | 1.0 | 413 | $1,505 | $3.64 | 4d | 15 | 0.44mi |
| 531 Grand Blvd Kansas City, MO | 2.0 | 2.0 | 881 | $1,949 | $2.21 | 2d | 6 | 0.44mi |
| 933 McGee St Kansas City, MO | 2.0 | 1.0 | 704 | $1,474 | $2.09 | 15d | 1 | 0.45mi |
| 200 Walnut St Kansas City, MO | 2.0 | 1.0–2.0 | 1065 | $1,782 | $1.67 | 8d | 1 | 0.45mi |
| 1103 Grand Blvd Kansas City, MO | 1.0–2.0 | 1.0–2.0 | 1061 | $1,275 | $1.20 | 24d | 6 | 0.46mi |
| 1300 Baltimore Ave Kansas City, MO | 1.0 | 1.0 | 848 | $1,897 | $2.24 | 44d | 1 | 0.47mi |
| 1125 Grand Blvd Kansas City, MO | 2.0 | 1.0–2.5 | 1315 | $2,889 | $2.20 | 2d | 36 | 0.48mi |
HOA detail condo
- Monthly dues
- $0 · $0/yr
- Likely covers
- gym
- Assessments
- None detected in remarks — confirm with the listing agent.
Listing history 32 events
-
2026-06-18days on market $169,900 Active 42 DOM
-
2026-06-17days on market $169,900 Active 41 DOM
-
2026-06-16days on market $169,900 Active 40 DOM
-
2026-06-15days on market $169,900 Active 39 DOM
-
2026-06-13days on market $169,900 Active 37 DOM
-
2026-06-09days on market $169,900 Active 33 DOM
-
2026-06-08days on market $169,900 Active 32 DOM
-
2026-06-07days on market $169,900 Active 31 DOM
-
2026-06-05days on market $169,900 Active 28 DOM
-
2026-06-03days on market $169,900 Active 27 DOM
-
2026-06-02days on market $169,900 Active 26 DOM
-
2026-06-01days on market $169,900 Active 25 DOM
-
2026-05-31days on market $169,900 Active 24 DOM
-
2026-05-07$169,900 Active 1150-char remark
-
2026-03-06historical
-
2026-02-23price $179,000
-
2026-01-22$200,000 Active
-
2026-01-20historical
-
2025-08-25historical
-
2025-08-20price $179,900
-
2025-08-07$210,000 Active
-
2025-08-05historical
-
2025-05-12historical
-
2025-03-18$220,000 Active
-
2023-09-15soldstatus Closed
-
2023-09-15soldstatus
-
2023-08-23status Pending
-
2023-08-17$210,000 Active
-
2018-05-18soldstatus Sold
-
2018-04-14status Pending
-
2018-03-29Contingent - Accepting Backup Offers
-
2018-03-29$135,000
ⓘ Source: listings_history table (triggers on properties + properties_extension) + one-shot
backfill from property_details.listing_events for pre-trigger history.
Tax reassessment forecast MO · Resets to sale price
- Current annual tax
- $3,635 · $303/mo
- Projected year-2 tax
- $3,635 · $303/mo
- Expected delta
- $0/yr ($0/mo · 0.0%)
ⓘ Screening estimate from a state-policy table — verify with the county assessor before closing.
Nearby sold comps map
Loading sold comps map…
Walkable amenities ~0.75 mi
Loading nearby amenities…
Taxation est. · year 1
- Rental income
- $17,513
- − Mortgage interest
- −$9,517
- − Property taxes
- −$3,635
- − Insurance
- −$850
- − Repairs & maintenance
- −$1,401
- − Management
- −$1,401
- − HOA
- −$7,176
- − Depreciation
- −$4,943
- Taxable loss
- −$11,410
- Est. tax savings @ 24.0%
- +$2,738
- After-tax cash flow
- $-5,779/yr
For passive investors: Depreciation is non-cash, so a rental often shows a tax loss while cash-flowing — sheltering income. Rental losses are passive: they offset passive income freely, and up to $25,000/yr can offset ordinary (W-2) income if you actively participate and your MAGI is under $100k (phasing out to $0 by $150k); unused losses carry forward. On sale, claimed depreciation is recaptured at up to 25%, and gains may owe capital-gains tax (a 1031 exchange can defer both). Figures are a year-1 estimate at your 24.0% rate — not tax advice; consult a CPA.
Schools (NCES district)
- District
- Kansas City 33
- NCES district ID
- 2916400
- Math proficiency
- 12% ▼ -8.00%
- Reading proficiency
- 24% ▬ 0.00%
- Median HH income
- $35,227
- Composite
- 14.8/100
- National rank
- #9387
- State rank
- #308 of 324 in MO
Livability — Kansas City
- Score
- 78/100
- State rank
- #28
- US rank
- #2671
Category grades
Schools grade is shown separately in the Schools card above.
Census & demographics
- Census place
- Kansas City, MO
- County
- Jackson County · 687,798 people
- City population
- 439,467
- Metro
- Kansas City, MO-KS
- Population (ZIP)
- 6,312
- Household income
- $67,235
- Rent vs Own
- Severe rent burden
- 781.0
Population outlook (Jackson County) Hauer SSP2
- Today (2025)
- 719,589 people
- By 2030
- 731,456 · +1.6%
- By 2040
- 746,689 · +3.8%
- By 2050
- 749,289 · +4.1%
- By 2075
- 736,227 · +2.3%
- By 2100
- 668,210 · -7.1%
Race, ethnicity, and origin ACS 2023
- Neighborhood character
- Predominantly White (74%)
- Race & ethnicity
- White 74% Two or more races 8% Black 8% Hispanic / Latino 8% Asian 4%
- Hispanic origin (detail)
- Mexican 5%
- Common ancestry
- Romanian 5% Slovak 4% Italian 3%
- Foreign-born
- 7% · Canada, Jamaica
- Languages at home
- 91% English-only · Spanish 3% Other Indo-European 2% Other Asian/Pacific 2%
Political lean MEDSL · Jackson
- 2024 margin
- D (+19.3) · D 58.9% · R 39.5% · Other 1.6%
- 2008→2024 swing
- -6.1pp toward R · 2008: 25.4pp · 2024: 19.3pp
- All cycles
- 2024: D+19.3 2020: D+22.0 2016: D+16.6 2012: D+19.0 2008: D+25.4
Not yet ingested
- Civics
- —
Market trends
- HPI YoY
- ▼ -0.33%
- Current HPI
- 181.1281
- Rent YoY
- ▼ -3.17%
- Metro
- Kansas City, MO-KS
- State GDP YoY
- ▲ 1.84%
- F500 in state
- 20
Industry mix (Fortune 500 HQ in MO)
| Industry | F500 HQs | Revenue |
|---|---|---|
| Healthcare | 1 | $163B |
|
||
| Insurance | 1 | $21B |
|
||
| Industrial Technology | 1 | $17B |
|
||
| Retail | 1 | $16B |
|
||
| Industrial Distribution | 1 | $10B |
|
||
| Utilities | 1 | $9B |
|
||
Price history
+25.9% since first listed19 events — show timeline
- 2026-05-07 Listed $169,900 Heartland MLS as Distributed by MLS Grid
- 2026-03-06 Listing Removed — Heartland MLS as Distributed by MLS Grid
- 2026-02-23 Price Changed $179,000 Heartland MLS as Distributed by MLS Grid
- 2026-01-22 Listed $200,000 Heartland MLS as Distributed by MLS Grid
- 2026-01-20 Coming Soon — Heartland MLS as Distributed by MLS Grid
- 2025-08-25 Listing Removed — Heartland MLS as Distributed by MLS Grid
- 2025-08-20 Price Changed $179,900 Heartland MLS as Distributed by MLS Grid
- 2025-08-07 Listed $210,000 Heartland MLS as Distributed by MLS Grid
- 2025-08-05 Coming Soon — Heartland MLS as Distributed by MLS Grid
- 2025-05-12 Listing Removed — Heartland MLS as Distributed by MLS Grid
- 2025-03-18 Listed $220,000 Heartland MLS as Distributed by MLS Grid
- 2023-09-15 Sold (Public Records) — Public Records
- 2023-09-15 Sold (MLS) — Heartland MLS as Distributed by MLS Grid
- 2023-08-23 Pending — Heartland MLS as Distributed by MLS Grid
- 2023-08-17 Listed $210,000 Heartland MLS as Distributed by MLS Grid
- 2018-05-18 Sold (MLS) — Heartland MLS as Distributed by MLS Grid
- 2018-04-14 Pending — Heartland MLS as Distributed by MLS Grid
- 2018-03-29 Listed — Heartland MLS as Distributed by MLS Grid
- 2018-03-29 Listed $135,000 Heartland MLS as Distributed by MLS Grid
Property tax history
+13.8%/yrLatest (2025): $3,635 · +9.1% YoY. Source: county tax records.
Cash-flow waterfall
monthlySold comps — $/sqft
last 12 mo · ≤1 miLoading sold comps…