 🏷️ Likely Rental
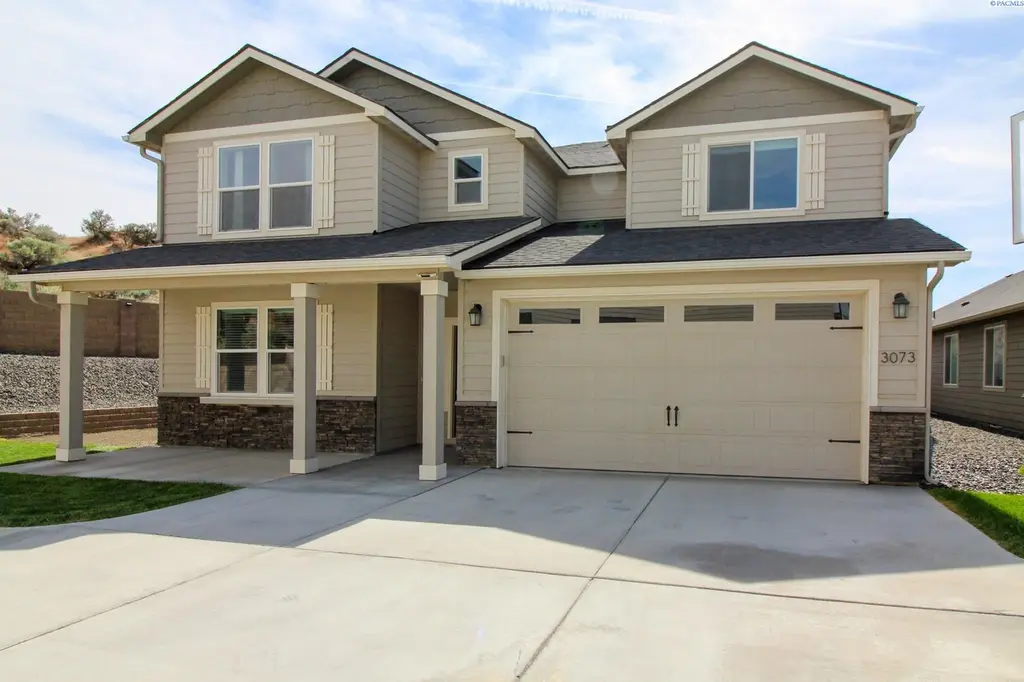
3073 Duval Loop · Richland, WA
Flood risk 1/10 · Minimal
- FEMA flood zone
- —
- Chance of flooding over 30 yrs
- 0.0%
- Est. flood insurance / yr
- —
Fire risk 4/10 · Minor
- Est. fire insurance / yr
- $604 – $1,122
Heat risk 5/10 · Moderate
- Hot days now (above 98°F)
- 7 days/yr
- Hot days in 30 yrs
- 16 days/yr
Wind risk 1/10 · Minimal
- Chance of severe wind over 30 yrs
- —
Air-quality risk 9/10 · Severe
- Unhealthy air days now
- 13 days/yr
- Unhealthy air days in 30 yrs
- 14 days/yr
Risk factors via First Street. Map © Google.
Why this score? — see what drove the D+ grade
The composite is a weighted blend of 9 inputs, each scored 0–100. Each bar is that input's sub-score; the figure is the points it added to the 100-point composite (weight × sub-score).
- Cash flow +15.0/30.0
- ARV discount +7.5/15.0
- 1% rule +5.0/10.0
- DSCR +5.0/10.0
- Schools +4.6/10.0
- Livability +4.0/5.0
- Rent growth +2.9/5.0
- Condition / age +2.5/5.0
- Appreciation +0.0/10.0
$3,195
🖨 Deal sheet 📄 Offer letter ✓ Due diligence
Listing remarks MLS
At 2968 square feet, the Vale home is not only spacious, but provides ample storage options. The incredible storage space begins with the oversized garage and practical mudroom entrance. This leads into the dining and kitchen area, which contains a large pantry, island and abundant counter space, perfect for entertaining or day-to-day life. The kitchen, adjacent to the great room features lots of natural lighting. The second level features even more space and storage, beginning with the versatile loft area that can turn into an optional junior suite. The expansive master suite opens with double doors and boasts a coffered ceiling. The master bathroom features a dual vanity, water closet, soaking tub and another oversized closet. Rounding out the home are two additional sizeable bedrooms with substantial closet space as well. Live in organized comfort, in a home perfect home for those needing extra space and storage.
Key facts
- Private backyard
- Modern kitchen
- Walk-in pantry
Tags
Neighborhood map
What this means for you Summary
Snapshot
- This is a 4-bed/3.0-bath single-family listed at $3k.
Deal economics
- At list price, monthly cash flow is $2k ($27k/yr) — positive.
- The deal already cash-flows at list — no discount required.
- Meets the 1% rule at list price ($3k rent vs $3k).
- Cap rate 838.8% vs local median 2.8% in Richland — top-decile yield for the area; either an underpriced asset or a hidden risk that comps aren't pricing in. Stress-test before assuming the spread holds.
Location & tenants
- Location reads 79/100 on livability (#112 in WA, #2,258 nationally) — a middle-class / working-renter tenant base. Strengths: commute A+, housing A+, health & safety A+; Watch: cost of living C-, amenities F.
- Kennewick School District (urban): math 43% / reading 58% proficiency, ranked #141 of 291 in WA (top 48%) — acceptable for families but not a draw, mixed tenant base, ~2y average lease.
- Market conditions: Rents rising (+1.6%/yr); 544 active listings in the ZIP; 4 comparable units currently listed for rent nearby; rentals lingering (median 44d on market — plan ~5-8 weeks vacancy on turnover, expect pricing pressure); 50% of comp listings sitting > 30 days — soft ceiling on asking rent; solid renter incomes; 1,532 units permitted in Benton County in 2024 (389 in 5+ unit buildings).
- This rent runs 34% of the median local income ($100k/yr) — at the standard rent-burdened threshold; future hikes will face affordability resistance.
Forward outlook
- Local home prices are declining (-3.0%/yr); year-one equity from $22 of loan paydown is wiped out by about $96 of value loss. Plan a longer hold.
- Benton County population projected at +32% by 2050 — long-run rental-demand tailwind backs the buy-and-hold thesis.
- At projected returns (-3.0% appreciation + 1.6% rent growth), your $895 cash investment doubles in ~1 year — after that, you're playing with house money.
Negotiation context
- Only 12 days on market — expect competitive offers; lowballing is unlikely to land.
- 2 sale attempts since 6y ago with the ask held roughly flat each time — persistent listings suggest the price (not the market) is what's stuck; bring a comps-based counter.
Risks & watch-outs
- Climate carrying-cost: extreme-heat days projected 7→16/yr by 2055 (HVAC capex compounding) — expect insurance premiums to compound above CPI over the hold.
Questions for the listing agent
- Is there a deadline driving the sale (1031 exchange, divorce, estate, relocation)? That informs how much negotiation room exists.
- Schools are A-rated — typically a magnet for longer-tenancy family renters. What's the average tenant stay here, and is there a school-zone premium baked into asking?
- The area grade is low — what's the realistic commute time and amenity access for the typical tenant pool here? Any planned neighborhood developments (good or bad) we should know about?
- What's the average days-on-market for RENTAL listings here right now (not sales)? A rising rental-DOM trend means longer vacancies and softer asking-rent achievability than the comps imply.
- What's the recent tenant-quality profile in this submarket — average credit score on applications, eviction rate, late-payment / NSF rate, and stable-employment percentage? A property-management company in the area should have these aggregated.
- How much new for-sale + rental construction is in the pipeline within 1–3 miles? Heavy new supply typically softens prices + rents 12–24 months out; constrained supply supports both.
Investment metrics
- 1% rule
- 88.69% ✓
- Cap rate
- 838.83%
- Cash-on-cash
- 2973.34%
- DSCR
- 133.30
- GRM
- 0.1
CMA / ARV
- ARV (median comp)
- $541,682
- List price
- $3,195
- Delta
- -99.41%
- Verdict
- UNDERPRICED
- Comps
- 20 within 1.0 mi
Show comp detail 12 sales within ~0.75 mi
| Address | Dist | Beds/Ba | Sqft | Sold | Price | $/sf | Match |
|---|---|---|---|---|---|---|---|
| 2945 Castle Rock Blvd | 0.08mi | 4/2.5 | 2,968 (-1%) | 12mo | $549,000 | $185 | 83 |
| 3231 Brighton Ct | 0.63mi | 4/2.5 | 2,941 (-2%) | 7mo | $699,000 | $238 | 60 |
| 176 Andrea Ln | 0.71mi | 4/3.5 | 2,888 (-4%) | 2mo | $690,000 | $239 | 58 |
| 201 Piper St | 0.72mi | 4/3.0 | 3,244 (+8%) | 1mo | $600,000 | $185 | 52 |
| 8816 W 6th Ave | 0.72mi | 4/2.5 | 3,062 (+2%) | 12mo | $665,000 | $217 | 51 |
| 10124 W 16th Pl | 0.70mi | 5/3.0 (+1) | 3,093 (+3%) | 10mo | $699,000 | $226 | 49 |
| 120 Andrea Ln | 0.54mi | 4/2.0 | 2,554 (-15%) | 6mo | $640,000 | $251 | 42 |
| 181 Bear Dr | 0.71mi | 4/2.5 | 2,773 (-7%) | 13mo | $565,000 | $204 | 42 |
| 8812 W 1st Pl | 0.75mi | 5/2.5 (+1) | 3,207 (+7%) | 10mo | $620,000 | $193 | 38 |
| 100 S Nevada St | 0.68mi | 4/2.0 | 2,568 (-14%) | 9mo | $560,000 | $218 | 33 |
| 216 Pacific Ct | 0.59mi | 5/2.5 (+1) | 2,602 (-13%) | 14mo | $588,400 | $226 | 32 |
| 201 Rocky Mountain Ct | 0.63mi | 3/2.0 (-1) | 2,650 (-12%) | 13mo | $565,000 | $213 | 32 |
Match score weights: distance 35% · size 25% · config 20% · recency 20%. Top-matched comps best support the ARV.
Projected returns pro-forma
-3.0% appreciation · 1.6% rent growth · sell at horizon
- IRR
- —
- Equity multiple
- 153.88×
- Total profit
- $136,766
- Equity at exit
- $476
- IRR
- —
- Equity multiple
- 319.97×
- Total profit
- $285,349
- Equity at exit
- $276
Cash invested: $895 (down + closing). Projections, not guarantees.
Landlord ↔ Tenant lean methodology
- Overall (STATE)
- 28 Tenant-Leaning
- State Washington
- 28 Tenant-Leaning · D+8
- County
- — inherits STATE
- City
- — inherits STATE
ZIP-level market 99352
- Rents YoY
- 1.6%
- Active inventory
- 544
- Price-to-rent
- 0.1×
Monthly cashflow live
- Estimated rent
- $2,834 medium interval (Pro) →
- Mortgage (P&I)
- −$17
- Tax est. 1.5%
- −$4 /mo · $48/yr
- Insurance
- −$1
- HOA
- −$0
- Vacancy / Maint / Mgmt
- −$595
- Net cashflow
- $2,217
Break-even live
UW: 25.0% down · 7.5% · 30yr · 1.5% tax · 5.0% vac · 8.0% maint · 8.0% mgmt
Financing live
Cash to close
- Down payment
- $799
- Closing costs
- $96
- Reserves months
- —
- Total cash needed
- —
Loan-product check · same deal, 3 products live
Conventional
25% down · 7.5% · 30yr
- Down + closing
- —
- Monthly P&I
- —
- Monthly cashflow
- —
- DSCR
- —
- Eligible?
- —
Personal DTI + credit; lowest rate.
DSCR
20% down · 8.5% · 30yr
- Down + closing
- —
- Monthly P&I
- —
- Monthly cashflow
- —
- DSCR
- —
- Eligible?
- —
No personal income docs; deal must DSCR.
Hard money
10% down · 12.0% · 12mo
- Down + closing
- —
- Monthly P&I
- —
- Monthly cashflow
- —
- DSCR
- —
- Eligible?
- —
Short-term bridge; refi at stabilization.
Rent comps 4 comps
| Address | Beds | Baths | Sqft | Rent | $/sqft | DOM | Units | Dist |
|---|---|---|---|---|---|---|---|---|
| 867 S Zeelar St Kennewick, WA | 4.0 | 2.5 | 1968 | $2,495 | $1.27 | 43d | 1 | 0.42mi |
| 8503 W 3rd Ave Kennewick, WA | 4.0 | 2.5 | 3076 | $2,695 | $0.88 | 20d | 1 | 1.01mi |
| 423 Nicklaus Ct Richland, WA | 3.0 | 3.5 | 2590 | $3,000 | $1.16 | 43d | 1 | 1.37mi |
| 8731 W Skagit Ave Kennewick, WA | 3.0 | 2.5 | 2660 | $4,000 | $1.50 | 20d | 1 | 1.39mi |
Listing history 5 events
-
2026-05-17historical $3,195
-
2026-05-16$3,195
-
2026-05-14$3,195 Active 2268-char remark
-
2020-08-25soldstatus $414,038 929-char remark
Show marketing remark (929 chars)
At 2968 square feet, the Vale home is not only spacious, but provides ample storage options. The incredible storage space begins with the oversized garage and practical mudroom entrance. This leads into the dining and kitchen area, which contains a large pantry, island and abundant counter space, perfect for entertaining or day-to-day life. The kitchen, adjacent to the great room features lots of natural lighting. The second level features even more space and storage, beginning with the versatile loft area that can turn into an optional junior suite. The expansive master suite opens with double doors and boasts a coffered ceiling. The master bathroom features a dual vanity, water closet, soaking tub and another oversized closet. Rounding out the home are two additional sizeable bedrooms with substantial closet space as well. Live in organized comfort, in a home perfect home for those needing extra space and storage.
-
2020-03-01$414,038 929-char remark
Show marketing remark (929 chars)
At 2968 square feet, the Vale home is not only spacious, but provides ample storage options. The incredible storage space begins with the oversized garage and practical mudroom entrance. This leads into the dining and kitchen area, which contains a large pantry, island and abundant counter space, perfect for entertaining or day-to-day life. The kitchen, adjacent to the great room features lots of natural lighting. The second level features even more space and storage, beginning with the versatile loft area that can turn into an optional junior suite. The expansive master suite opens with double doors and boasts a coffered ceiling. The master bathroom features a dual vanity, water closet, soaking tub and another oversized closet. Rounding out the home are two additional sizeable bedrooms with substantial closet space as well. Live in organized comfort, in a home perfect home for those needing extra space and storage.
ⓘ Source: listings_history table (triggers on properties + properties_extension) + one-shot
backfill from property_details.listing_events for pre-trigger history.
Climate risk First Street
- Flood 1/10 Low 0% chance over 30 yrs
- Wildfire 4/10 Moderate
- Heat 5/10 Major 7 d/yr ≥98°F today · 16 d/yr by 30 yrs out
- Wind 1/10 Low
- Air quality 9/10 Extreme 13 unhealthy d/yr today · 14 by 30 yrs out
Nearby sold comps map
Loading sold comps map…
Walkable amenities ~0.75 mi
Loading nearby amenities…
Taxation est. · year 1
- Rental income
- $34,006
- − Mortgage interest
- −$179
- − Property taxes
- −$48
- − Insurance
- −$16
- − Repairs & maintenance
- −$2,720
- − Management
- −$2,720
- − Depreciation
- −$93
- Taxable income
- $28,229
- Est. tax owed @ 24.0%
- −$6,775
- After-tax cash flow
- $19,825/yr
For passive investors: Depreciation is non-cash, so a rental often shows a tax loss while cash-flowing — sheltering income. Rental losses are passive: they offset passive income freely, and up to $25,000/yr can offset ordinary (W-2) income if you actively participate and your MAGI is under $100k (phasing out to $0 by $150k); unused losses carry forward. On sale, claimed depreciation is recaptured at up to 25%, and gains may owe capital-gains tax (a 1031 exchange can defer both). Figures are a year-1 estimate at your 24.0% rate — not tax advice; consult a CPA.
Schools (NCES district)
- District
- Kennewick School District
- NCES district ID
- 5303930
- Math proficiency
- 43% ▼ -1.00%
- Reading proficiency
- 58% ▬ 0.00%
- Median HH income
- $54,191
- Composite
- 45.56/100
- National rank
- #5667
- State rank
- #141 of 291 in WA
Livability — Richland
- Score
- 79/100
- State rank
- #112
- US rank
- #2258
Category grades
Schools grade is shown separately in the Schools card above.
Census & demographics
- Census place
- Richland, WA
- County
- Benton County · 186,895 people
- City population
- 62,989
- Metro
- Kennewick-Richland, WA
- Population (ZIP)
- 37,430
- Household income
- $100,108
- Rent vs Own
- Severe rent burden
- 983.0
Population outlook (Benton County) Hauer SSP2
- Today (2025)
- 219,421 people
- By 2030
- 233,813 · +6.6%
- By 2040
- 262,134 · +19.5%
- By 2050
- 290,100 · +32.2%
- By 2075
- 363,525 · +65.7%
- By 2100
- 418,667 · +90.8%
Race, ethnicity, and origin ACS 2023
- Neighborhood character
- Predominantly White (73%)
- Race & ethnicity
- White 73% Hispanic / Latino 14% Two or more races 10% Asian 7% Black 2%
- Hispanic origin (detail)
- Mexican 11%
- Common ancestry
- Italian 4% Portuguese 4% Slovak 3%
- Foreign-born
- 9% · Canada, South Korea, China
- Languages at home
- 88% English-only · Spanish 4% Other Indo-European 3% Korean 1%
Political lean MEDSL · Benton
- 2024 margin
- Strong R (+21.9) · D 37.7% · R 59.6% · Other 2.7%
- 2008→2024 swing
- +4.2pp toward D · 2008: -26.1pp · 2024: -21.9pp
- All cycles
- 2024: R+21.9 2020: R+21.0 2016: R+26.6 2012: R+27.0 2008: R+26.1
Not yet ingested
- Civics
- —
Market trends
- HPI YoY
- ▼ -323.81%
- Current HPI
- 217.3435
- Rent YoY
- ▲ 1.60%
- Metro
- Kennewick-Richland, WA
- State GDP YoY
- ▲ 4.65%
- F500 in state
- 22
Industry mix (Fortune 500 HQ in WA)
| Industry | F500 HQs | Revenue |
|---|---|---|
| Retail | 2 | $269B |
|
||
| Technology / Retail | 1 | $638B |
|
||
| Technology | 1 | $245B |
|
||
| Telecommunications | 1 | $38B |
|
||
| Food / Beverage | 1 | $36B |
|
||
| Automotive / Trucks | 1 | $34B |
|
||
Price history
-99.2% since first listed4 events — show timeline
- 2026-05-17 Rental Removed $3,195 APPFOLIO
- 2026-05-16 Listed for Rent $3,195 APPFOLIO
- 2020-08-25 Sold (MLS) $414,038 PACMLS
- 2020-03-01 Listed $414,038 PACMLS
Property tax history
+1.5%/yrLatest (2026): $4,430 · -8.1% YoY. Source: county tax records.
Cash-flow waterfall
monthlySold comps — $/sqft
last 12 mo · ≤1 miLoading sold comps…