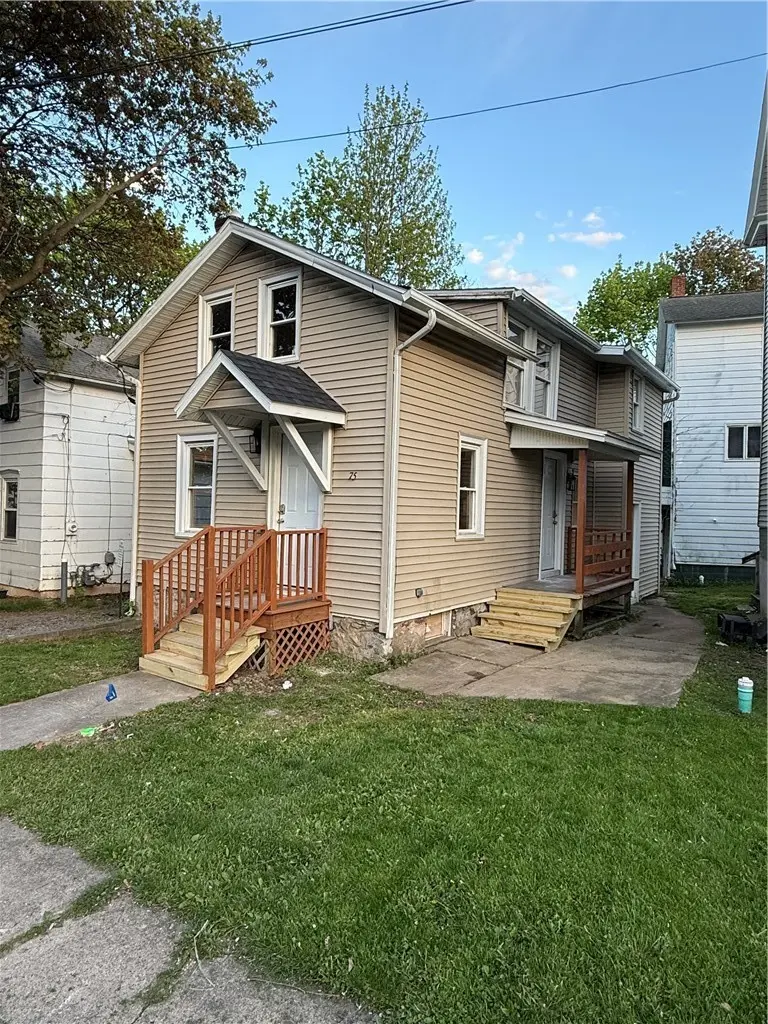
75 Colt St · Geneva, NY
Flood risk 6/10 · Moderate
- FEMA flood zone
- X
- Chance of flooding over 30 yrs
- 0.73%
- Est. flood insurance / yr
- $473 – $860
Fire risk 3/10 · Minor
- Est. fire insurance / yr
- $691 – $1,283
Heat risk 3/10 · Minor
- Hot days now (above 97°F)
- 7 days/yr
- Hot days in 30 yrs
- 16 days/yr
Wind risk 1/10 · Minimal
- Chance of severe wind over 30 yrs
- —
Air-quality risk 2/10 · Minimal
- Unhealthy air days now
- 0 days/yr
- Unhealthy air days in 30 yrs
- 1 days/yr
Risk factors via First Street. Map © Google.
Why this score? — see what drove the D grade
The composite is a weighted blend of 9 inputs, each scored 0–100. Each bar is that input's sub-score; the figure is the points it added to the 100-point composite (weight × sub-score).
- Cash flow +19.5/30.0
- DSCR +6.2/10.0
- 1% rule +4.1/10.0
- Livability +3.9/5.0
- Schools +3.3/10.0
- Rent growth +2.5/5.0
- Condition / age +2.5/5.0
- ARV discount +0.0/15.0
- Appreciation +0.0/10.0
$149,999
🖨 Deal sheet (PDF) 📄 Offer letter ✓ Due diligence
Listing remarks MLS
A unique opportunity for a full renovation. The interior has been stripped and is ready for a complete rebuild, offering a blank slate to create something truly custom. The property already features a brand-new roof, providing a strong starting point for the next phase of work. Perfect for a buyer with the vision and resources to take on a full-scale project.
Key facts
- Built 1890
- Listed 42 days
Property features AI
Exterior
- Parking: No garage; No driveway
- Utilities: Public water connected; Sewer connected
- Home design: Single-story existing structure; Resale property
- Construction: Stone foundation; Stone and vinyl siding exterior
- Exterior features: Near public transit; Rectangular lot; Main thoroughfare frontage; Lot dimensions approximately 30 x 33
Interior
- Flooring: Hardwood; Vinyl; Varies
- Bathrooms: 1 full bathroom; 1 half bathroom; One main-level bathroom
- Heating & cooling: Electric baseboard heating
- Interior features: Solid surface counters; Hardwood, vinyl, and varied flooring; Full basement
- Laundry & utility: Main-level laundry; Gas water heater
Neighborhood map
What this means for you Summary
Snapshot
- This is a 3-bed/2.0-bath single-family listed at $150k.
Deal economics
- At list price, monthly cash flow is $170 ($2k/yr) — positive.
- The deal already cash-flows at list — no discount required.
- To meet the 1% rule (rent ≥ 1% of price), the offer needs to be $136k (9.0% below list).
- Recommended offer: $136k (9.0% below list) — sets the bar for 1% rule.
- Cap rate 7.7% vs local median 5.0% in Geneva — top-decile yield for the area; either an underpriced asset or a hidden risk that comps aren't pricing in. Stress-test before assuming the spread holds.
Location & tenants
- Location reads 78/100 on livability (#177 in NY, #2,760 nationally) — a middle-class / working-renter tenant base. Strengths: cost of living A+, housing A+, health & safety A+; Watch: crime D+, employment D, amenities F.
- Geneva City School District (town): math 36% / reading 43% proficiency, ranked #528 of 590 in NY (top 90%) — families likely to look elsewhere, expect single-tenant / working-renter base with shorter leases.
- Zoned schools: North Street Elementary School (math 28% / reading 35%, grade F, #1,679 of 2,108 statewide, top 80%, 595 students, 75% FRL); Geneva Middle School (math 21% / reading 42%, grade F, #522 of 729 statewide, top 73%, 452 students, 68% FRL); Geneva High School (math 92% / reading 98%, grade A+, #93 of 1,100 statewide, top 10%, 613 students, 63% FRL) — zoned schools average 69% FRL vs 51% district-wide (17 pts higher); higher-poverty schools than district average — tighter screening recommended.
- Zoned-school proficiency averages 53% at this address vs 40% district-wide (+13 pts) — the actual schools serving this property are materially stronger than the Geneva City School District average implies; a family-tenant draw the district grade alone would hide.
- Market conditions: 123 active listings in the ZIP; 4 comparable units currently listed for rent nearby; rentals at typical pace (median 16d on market — plan ~3-4 weeks tenant-placement turnaround); 284 units permitted in Ontario County in 2024 (69 in 5+ unit buildings).
Forward outlook
- Local home prices are declining (-3.0%/yr); year-one equity from $1k of loan paydown is wiped out by about $4k of value loss. Plan a longer hold.
- Ontario County population projected to shrink 6% by 2050 — rents likely to lag national; underwrite the cash flow, not the appreciation.
Negotiation context
- It's been on market 42 days — a 3% lower offer ($145k) is reasonable based on typical stale-listing flexibility.
- 6 sale attempts since 6y ago with the ask held roughly flat each time — persistent listings suggest the price (not the market) is what's stuck; bring a comps-based counter.
- Current owner paid $32k; list at $150k implies a 376% gain — meaningful room to come down on a strong offer.
Risks & watch-outs
- Watch-outs: built in 1890 — expect roof / HVAC / electrical / plumbing capex.
- Climate carrying-cost: major flood risk — expect insurance premiums to compound above CPI over the hold.
Questions for the listing agent
- It's been on market 42 days. Have you received any prior offers? Is the seller open to a 9% concession, seller financing, or rate buy-down credit?
- Built in 1890 — when were the roof, HVAC, electrical panel, plumbing, and water heater last replaced?
- Is there a deadline driving the sale (1031 exchange, divorce, estate, relocation)? That informs how much negotiation room exists.
- Schools are D-rated, which usually means shorter tenancies and higher turnover. Who's the typical renter profile here, and what's been the actual vacancy rate?
- Crime grade is D in this area — have there been break-ins, vandalism, or insurance claims at this property in the last 3 years? What carrier currently insures it and at what premium?
- The area grade is low — what's the realistic commute time and amenity access for the typical tenant pool here? Any planned neighborhood developments (good or bad) we should know about?
- What's the average days-on-market for RENTAL listings here right now (not sales)? A rising rental-DOM trend means longer vacancies and softer asking-rent achievability than the comps imply.
- What's the recent tenant-quality profile in this submarket — average credit score on applications, eviction rate, late-payment / NSF rate, and stable-employment percentage? A property-management company in the area should have these aggregated.
- How much new for-sale + rental construction is in the pipeline within 1–3 miles? Heavy new supply typically softens prices + rents 12–24 months out; constrained supply supports both.
Investment metrics
- 1% rule
- 0.91% ✗
- Cap rate
- 7.66%
- Cash-on-cash
- 4.87%
- DSCR
- 1.22
- GRM
- 9.2
CMA / ARV
- ARV (median comp)
- $112,879
- List price
- $149,999
- Delta
- 32.89%
- Verdict
- OVERPRICED
- Comps
- 20 within 1.0 mi
Show comp detail 8 sales within ~0.75 mi
| Address | Dist | Beds/Ba | Sqft | Sold | Price | $/sf | Match |
|---|---|---|---|---|---|---|---|
| 26 West Ave | 0.27mi | 2/1.0 (-1) | 864 (+2%) | 9mo | $60,000 | $69 | 67 |
| 28 West Ave | 0.28mi | 2/1.0 (-1) | 864 (+2%) | 9mo | $60,000 | $69 | 67 |
| 56 West Ave | 0.34mi | 2/3.5 (-1) | 880 (+4%) | 11mo | $98,000 | $111 | 58 |
| 35 Solar Dr | 0.43mi | 2/2.0 (-1) | 752 (-11%) | 3mo | $280,000 | $372 | 54 |
| 10 Twoomey Pl | 0.40mi | 3/1.0 | 936 (+11%) | 14mo | $122,000 | $130 | 48 |
| 21 Oak St | 0.49mi | 2/1.0 (-1) | 912 (+8%) | 19mo | $154,900 | $170 | 39 |
| 27 Clover St | 0.66mi | 2/1.0 (-1) | 896 (+6%) | 14mo | $100,000 | $112 | 39 |
| 232 High St | 0.70mi | 2/2.0 (-1) | 924 (+9%) | 16mo | $200,000 | $216 | 34 |
Match score weights: distance 35% · size 25% · config 20% · recency 20%. Top-matched comps best support the ARV.
Projected returns pro-forma
-3.0% appreciation · 3.0% rent growth · sell at horizon
- IRR
- -8.8%
- Equity multiple
- 0.68×
- Total profit
- $-13,513
- Equity at exit
- $22,365
- IRR
- 0.7%
- Equity multiple
- 1.05×
- Total profit
- $1,968
- Equity at exit
- $12,969
Cash invested: $42,000 (down + closing). Projections, not guarantees.
Landlord ↔ Tenant lean methodology
- Overall (STATE)
- 15 Strongly Tenant-Friendly
- State New York
- 15 Strongly Tenant-Friendly · D+10
- County
- — inherits STATE
- City
- — inherits STATE
ZIP-level market 14456
- Home prices YoY
- -15.8%
- Active inventory
- 123
- Price-to-rent
- 9.2×
Monthly cashflow live
- Estimated rent
- $1,365 medium interval (Pro) →
- Mortgage (P&I)
- −$787
- Tax from tax record
- −$59 /mo · $703/yr
- Insurance
- −$62
- HOA
- −$0
- Vacancy / Maint / Mgmt
- −$287
- Net cashflow
- $170
Break-even live
Sensitivity live
| Price | -10% $255 | -5% $213 | +0% $170 | +5% $128 | +10% $85 |
|---|---|---|---|---|---|
| Rent | -10% $63 | -5% $116 | +0% $170 | +5% $224 | +10% $278 |
| Rate | -1.0pp $246 | -0.5pp $209 | base $170 | +0.5pp $132 | +1.0pp $92 |
UW: 25.0% down · 7.5% · 30yr · 1.5% tax · 5.0% vac · 8.0% maint · 8.0% mgmt
Financing live
Cash to close
- Down payment
- $37,500
- Closing costs
- $4,500
- Reserves months
- —
- Total cash needed
- —
Loan-product check · same deal, 3 products live
Conventional
25% down · 7.5% · 30yr
- Down + closing
- —
- Monthly P&I
- —
- Monthly cashflow
- —
- DSCR
- —
- Eligible?
- —
Personal DTI + credit; lowest rate.
DSCR
20% down · 8.5% · 30yr
- Down + closing
- —
- Monthly P&I
- —
- Monthly cashflow
- —
- DSCR
- —
- Eligible?
- —
No personal income docs; deal must DSCR.
Hard money
10% down · 12.0% · 12mo
- Down + closing
- —
- Monthly P&I
- —
- Monthly cashflow
- —
- DSCR
- —
- Eligible?
- —
Short-term bridge; refi at stabilization.
Rent comps 4 comps
| Address | Beds | Baths | Sqft | Rent | $/sqft | DOM | Units | Dist |
|---|---|---|---|---|---|---|---|---|
| 300 Sheridan Park Unit 029 Geneva, NY | 2.0 | 1.0 | 846 | $1,350 | $1.60 | 45d | 1 | 1.18mi |
| 300 Sheridan Park Unit 063 Geneva, NY | 2.0 | 1.0 | 846 | $1,350 | $1.60 | 4d | 1 | 1.18mi |
| 300 Sheridan Park Unit 011 Geneva, NY | 2.0 | 1.0 | 846 | $1,325 | $1.57 | 16d | 1 | 1.18mi |
| 300 Sheridan Park Unit 140 Geneva, NY | 2.0 | 1.0 | 1045 | $1,450 | $1.39 | 4d | 1 | 1.18mi |
Listing history 32 events
-
2026-06-21days on market $149,999 Active 42 DOM
-
2026-06-21days on market $149,999 Active 41 DOM
-
2026-06-18price $149,999 Active 39 DOM
-
2026-06-18days on market $154,999 Active 39 DOM
-
2026-06-17days on market $154,999 Active 38 DOM
-
2026-06-16days on market $154,999 Active 37 DOM
-
2026-06-15days on market $154,999 Active 36 DOM
-
2026-06-13days on market $154,999 Active 34 DOM
-
2026-06-12days on market $154,999 Active 33 DOM
-
2026-06-09days on market $154,999 Active 30 DOM
-
2026-06-08days on market $154,999 Active 29 DOM
-
2026-06-07status $154,999 Active 28 DOM
-
2026-06-03status $154,999 Pending 28 DOM
-
2026-06-02days on market $154,999 Active Under Contract 28 DOM
-
2026-06-01days on market $154,999 Active Under Contract 27 DOM
-
2026-05-31days on market $154,999 Active Under Contract 26 DOM
-
2026-05-05$154,999 Active 563-char remark
-
2025-07-18soldstatus $31,500
-
2025-07-17soldstatus $31,500 Closed 361-char remark
Show marketing remark (361 chars)
A unique opportunity for a full renovation. The interior has been stripped and is ready for a complete rebuild, offering a blank slate to create something truly custom. The property already features a brand-new roof, providing a strong starting point for the next phase of work. Perfect for a buyer with the vision and resources to take on a full-scale project.
-
2025-06-13status Pending 361-char remark
Show marketing remark (361 chars)
A unique opportunity for a full renovation. The interior has been stripped and is ready for a complete rebuild, offering a blank slate to create something truly custom. The property already features a brand-new roof, providing a strong starting point for the next phase of work. Perfect for a buyer with the vision and resources to take on a full-scale project.
-
2025-05-02$49,000 Active 361-char remark
Show marketing remark (361 chars)
A unique opportunity for a full renovation. The interior has been stripped and is ready for a complete rebuild, offering a blank slate to create something truly custom. The property already features a brand-new roof, providing a strong starting point for the next phase of work. Perfect for a buyer with the vision and resources to take on a full-scale project.
-
2022-06-29soldstatus $15,000 Closed Sale or Rented
Show marketing remark (190 chars)
This fixer upper could be a fantastic project for anyone looking to put some sweat equity into a property!! All the dirty work is done!! House is wide open to make it exactly what you want!!
-
2022-06-15soldstatus $15,000
-
2022-04-05status Pending Sale
Show marketing remark (190 chars)
This fixer upper could be a fantastic project for anyone looking to put some sweat equity into a property!! All the dirty work is done!! House is wide open to make it exactly what you want!!
-
2022-02-14$25,000 Active
Show marketing remark (190 chars)
This fixer upper could be a fantastic project for anyone looking to put some sweat equity into a property!! All the dirty work is done!! House is wide open to make it exactly what you want!!
-
2021-04-28status Under Contract- Do Not Show
-
2021-04-27historical
-
2021-03-05price $20,900
-
2021-02-04$24,900 Active
-
2020-08-31historical
-
2020-03-05$30,000 Active
-
2019-11-13soldstatus $29,000
ⓘ Source: listings_history table (triggers on properties + properties_extension) + one-shot
backfill from property_details.listing_events for pre-trigger history.
Tax reassessment forecast NY · Partial reset (capped growth)
- Current annual tax
- $703 · $59/mo
- Projected year-2 tax
- $1,619 · $135/mo
- Expected delta
- +$916/yr (+$76/mo · 130.2%)
ⓘ Screening estimate from a state-policy table — verify with the county assessor before closing.
Climate risk First Street
- Flood 6/10 Major FEMA zone X · 73% chance over 30 yrs
- Wildfire 3/10 Moderate
- Heat 3/10 Moderate 7 d/yr ≥97°F today · 16 d/yr by 30 yrs out
- Wind 1/10 Low
- Air quality 2/10 Low 0 unhealthy d/yr today · 1 by 30 yrs out
Nearby sold comps map
Loading sold comps map…
Walkable amenities ~0.75 mi
Loading nearby amenities…
Taxation est. · year 1
- Rental income
- $16,376
- − Mortgage interest
- −$8,402
- − Property taxes
- −$703
- − Insurance
- −$750
- − Repairs & maintenance
- −$1,310
- − Management
- −$1,310
- − Depreciation
- −$4,364
- Taxable loss
- −$463
- Est. tax savings @ 24.0%
- +$111
- After-tax cash flow
- $2,156/yr
For passive investors: Depreciation is non-cash, so a rental often shows a tax loss while cash-flowing — sheltering income. Rental losses are passive: they offset passive income freely, and up to $25,000/yr can offset ordinary (W-2) income if you actively participate and your MAGI is under $100k (phasing out to $0 by $150k); unused losses carry forward. On sale, claimed depreciation is recaptured at up to 25%, and gains may owe capital-gains tax (a 1031 exchange can defer both). Figures are a year-1 estimate at your 24.0% rate — not tax advice; consult a CPA.
Schools (NCES district)
- District
- Geneva City School District
- NCES district ID
- 3611970
- Math proficiency
- 36% ▲ 3.00%
- Reading proficiency
- 43% ▲ 11.00%
- Median HH income
- $44,012
- Composite
- 33.48/100
- National rank
- #5448
- State rank
- #528 of 590 in NY
Livability — Geneva
- Score
- 78/100
- State rank
- #177
- US rank
- #2760
Category grades
Schools grade is shown separately in the Schools card above.
Census & demographics
- Census place
- Geneva, NY
- Population (ZIP)
- 19,864
Population outlook (Ontario County) Hauer SSP2
- Today (2025)
- 111,230 people
- By 2030
- 111,401 · +0.2%
- By 2040
- 109,535 · -1.5%
- By 2050
- 104,895 · -5.7%
- By 2075
- 92,999 · -16.4%
- By 2100
- 73,723 · -33.7%
Race, ethnicity, and origin ACS 2023
- Neighborhood character
- Predominantly White (75%)
- Race & ethnicity
- White 75% Hispanic / Latino 13% Two or more races 7% Black 6% Asian 2%
- Hispanic origin (detail)
- Mexican 2% Puerto Rican 9%
- Common ancestry
- Iranian 5% Slovak 3% Italian 2%
- Foreign-born
- 6% · Canada, China
- Languages at home
- 87% English-only · Spanish 7% Other Indo-European 2% German/W. Germanic 1%
Political lean MEDSL · Ontario
- 2024 margin
- Toss-up / Even · D 49.4% · R 50.6%
- 2008→2024 swing
- -1.0pp toward R · 2008: -0.1pp · 2024: -1.2pp
- All cycles
- 2024: R+1.2 2020: R+0.0 2016: R+8.6 2012: R+1.6 2008: R+0.1
Not yet ingested
- Civics
- —
Market trends
- HPI YoY
- ▼ -57.56%
- Current HPI
- 307.9168
- Rent YoY
- —
- Metro
- —
- State GDP YoY
- ▲ 2.60%
- F500 in state
- 92
Industry mix (Fortune 500 HQ in NY)
| Industry | F500 HQs | Revenue |
|---|---|---|
| Financial Services | 10 | $950B |
|
||
| Consumer Goods | 9 | $162B |
|
||
| Insurance | 4 | $225B |
|
||
| Telecommunications | 2 | $144B |
|
||
| Pharmaceuticals | 2 | $112B |
|
||
| Media / Entertainment | 2 | $69B |
|
||
Price history
+417.2% since first listed20 events — show timeline
- 2026-06-18 Price Changed $149,999 UNYREIS
- 2026-06-07 Relisted — UNYREIS
- 2026-06-02 Pending — UNYREIS
- 2026-05-29 Contingent — UNYREIS
- 2026-05-05 Listed $154,999 UNYREIS
- 2025-07-18 Sold (Public Records) $31,500 Public Records
- 2025-07-17 Sold (MLS) $31,500 UNYREIS
- 2025-06-13 Pending — UNYREIS
- 2025-05-02 Listed $49,000 UNYREIS
- 2022-06-29 Sold (MLS) $15,000 UNYREIS
- 2022-06-15 Sold (Public Records) $15,000 Public Records
- 2022-04-05 Pending — UNYREIS
- 2022-02-14 Listed $25,000 UNYREIS
- 2021-04-28 Pending — UNYREIS
- 2021-04-27 Listing Removed — UNYREIS
- 2021-03-05 Price Changed $20,900 UNYREIS
- 2021-02-04 Listed $24,900 UNYREIS
- 2020-08-31 Listing Removed — UNYREIS
- 2020-03-05 Listed $30,000 UNYREIS
- 2019-11-13 Sold (Public Records) $29,000 Public Records
Property tax history
+0.7%/yrLatest (2025): $703 · -73.1% YoY. Source: county tax records.
Cash-flow waterfall
monthlySold comps — $/sqft
last 12 mo · ≤1 miLoading sold comps…