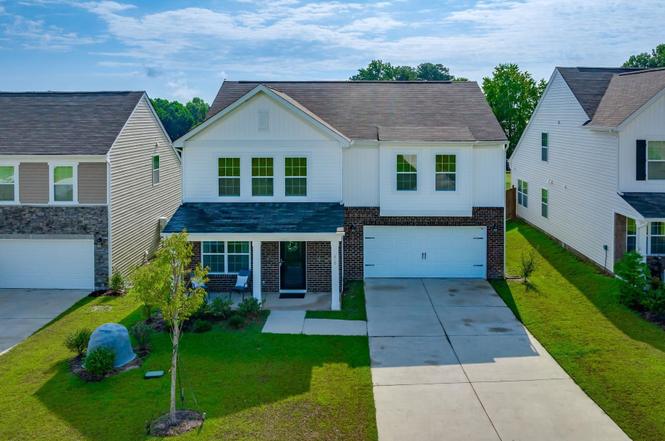
410 Windy Farm Rd · Gilbert, SC
Flood risk No data
- FEMA flood zone
- —
- Chance of flooding over 30 yrs
- —
- Est. flood insurance / yr
- —
Fire risk No data
- Est. fire insurance / yr
- —
Heat risk No data
- Hot days now (above threshold)
- —
- Hot days in 30 yrs
- —
Wind risk No data
- Chance of severe wind over 30 yrs
- —
Air-quality risk No data
- Unhealthy air days now
- —
- Unhealthy air days in 30 yrs
- —
Risk factors via First Street. Map © Google.
Why this score? — see what drove the C- grade
The composite is a weighted blend of 9 inputs, each scored 0–100. Each bar is that input's sub-score; the figure is the points it added to the 100-point composite (weight × sub-score).
- Cash flow +13.9/30.0
- Appreciation +10.0/10.0
- ARV discount +7.5/15.0
- DSCR +4.2/10.0
- Schools +4.2/10.0
- Livability +3.6/5.0
- 1% rule +3.3/10.0
- Rent growth +2.5/5.0
- Condition / age +2.5/5.0
$311,000
🖨 Deal sheet 📄 Offer letter ✓ Due diligence
Listing remarks
410 Windy Farm Road provides the perfect blend of space, style, and convenience! Located in the highly sought-after Lexington One School District and zoned for Rocky Creek Elementary, Beechwood Middle, and Lexington High School, this beautifully maintained 2023-built home features 5 bedrooms, 3 full bathrooms, and sits on a huge lot just minutes from everything that Lexington has! Step inside to discover a bright, open-concept layout designed for both everyday living and effortless entertaining. The main level includes a guest bedroom and full bath, ideal for visitors, a home office, or multi-generational living. At the heart of the home, the stunning kitchen showcases granite countertops,
Key facts
- Covered front porch
- Large backyard
- 0.3 acre lot
Tags
Property features AI
Finance
- HOA & community: Homeowners association present; Association covers cable TV and common area maintenance
Exterior
- Parking: Attached 2-car garage
- Utilities: Well water; Septic sewer
- Home design: Two-story home; Brick exterior above foundation; Slab foundation
- Construction: Brick siding above foundation; Slab foundation
- Exterior features: Covered front porch; Rear wood privacy fence
Interior
- Kitchen: Island; Pantry; Granite countertops; Tiled backsplash; Painted cabinets; Microwave above stove; Luxury vinyl plank flooring in kitchen
- Bedrooms: Master bedroom on second level with double vanity, private bath, walk-in closet, ceiling fan, and carpeted floors; Bedroom 2 on main level with shared bath, ceiling fan, and carpeted floors; Bedroom 3 on second level with shared bath, private closet, and carpeted floors; Bedroom 4 on second level with shared bath, private closet, and carpeted floors; Bedroom 5 with private bath, private closet, and carpeted floors
- Flooring: Carpet in bedrooms; Luxury vinyl plank flooring in formal dining, great room, and kitchen
- Bathrooms: Three full bathrooms (including two full secondary baths and one main full bath)
- Heating & cooling: Central cooling with a heat pump on first level; Central heating with gas on first and second levels
- Interior features: Attic access; Recessed lighting throughout main living areas; Loft
- Laundry & utility: Dishwasher; Refrigerator; Free-standing gas range
Neighborhood map
What this means for you Summary
Snapshot
- This is a 5-bed/3.0-bath single-family listed at $311k.
Deal economics
- At list price, monthly cash flow is $34 ($412/yr) — positive.
- The deal already cash-flows at list — no discount required.
- To meet the 1% rule (rent ≥ 1% of price), the offer needs to be $259k (16.7% below list).
- Recommended offer: $259k (16.7% below list) — sets the bar for 1% rule.
Location & tenants
- Location reads 71/100 on livability (#52 in SC) — a middle-class / working-renter tenant base. Strengths: cost of living A+, housing A+, crime B; Watch: amenities F, commute F, health & safety F.
- Lexington 01 (suburban): math 42% / reading 53% proficiency, ranked #11 of 80 in SC (top 14%) — families likely to look elsewhere, expect single-tenant / working-renter base with shorter leases.
- Zoned schools: Rocky Creek Elementary (math 56% / reading 54%, grade C, #119 of 597 statewide, top 20%, 863 students, 18% FRL); Lexington High (math 69% / reading 92%, grade A, #23 of 196 statewide, top 11%, 2,410 students, 17% FRL).
- Zoned-school proficiency averages 68% at this address vs 48% district-wide (+20 pts) — the actual schools serving this property are materially stronger than the Lexington 01 average implies; a family-tenant draw the district grade alone would hide.
- Market conditions: 273 active listings in the ZIP; 2 comparable units currently listed for rent nearby; 1,712 units permitted in Lexington County in 2024 (0 in 5+ unit buildings).
Forward outlook
- In year one you build about $33k of equity ($2k loan paydown + $31k appreciation (10.0% local appreciation)).
- Lexington County population projected at +26% by 2050 — long-run rental-demand tailwind backs the buy-and-hold thesis.
- At projected returns (10.0% appreciation + 3.0% rent growth), your $87k cash investment doubles in ~3 years — after that, you're playing with house money.
- By year 2, paydown + projected appreciation supports a ~$53k cash-out refi (75% LTV) — recoverable capital for the next deal without selling this one.
Negotiation context
- It's been on market 167 days — a 12% lower offer ($274k) is reasonable based on typical stale-listing flexibility.
- 6 sale attempts since 3y ago; this cycle's ask has dropped $49k (14%) from the opening price — seller is motivated, your offer sets the floor, not the list.
Questions for the listing agent
- It's been on market 167 days. Have you received any prior offers? Is the seller open to a 17% concession, seller financing, or rate buy-down credit?
- What does the HOA fee cover, when was the last increase, and are there any pending special assessments or reserve-fund shortfalls?
- Why hasn't it sold? Are there any deal-killer items the seller is aware of (foundation, flood, title, zoning, code violations)?
- Is there a deadline driving the sale (1031 exchange, divorce, estate, relocation)? That informs how much negotiation room exists.
- Schools are D-rated, which usually means shorter tenancies and higher turnover. Who's the typical renter profile here, and what's been the actual vacancy rate?
- What's the average days-on-market for RENTAL listings here right now (not sales)? A rising rental-DOM trend means longer vacancies and softer asking-rent achievability than the comps imply.
- What's the recent tenant-quality profile in this submarket — average credit score on applications, eviction rate, late-payment / NSF rate, and stable-employment percentage? A property-management company in the area should have these aggregated.
- How much new for-sale + rental construction is in the pipeline within 1–3 miles? Heavy new supply typically softens prices + rents 12–24 months out; constrained supply supports both.
Investment metrics
- 1% rule
- 0.83% ✗
- Cap rate
- 6.43%
- Cash-on-cash
- 0.47%
- DSCR
- 1.02
- GRM
- 10.0
CMA / ARV
No comps found within radius.
Projected returns pro-forma
10.0% appreciation · 3.0% rent growth · sell at horizon
- IRR
- 24.6%
- Equity multiple
- 2.97×
- Total profit
- $171,522
- Equity at exit
- $280,173
- IRR
- 21.8%
- Equity multiple
- 6.78×
- Total profit
- $503,291
- Equity at exit
- $604,205
Cash invested: $87,080 (down + closing). Projections, not guarantees.
Landlord ↔ Tenant lean methodology
- Overall (STATE)
- 90 Strongly Landlord-Friendly
- State South Carolina
- 90 Strongly Landlord-Friendly · R+6
- County
- — inherits STATE
- City
- — inherits STATE
ZIP-level market 29054
- Home prices YoY
- 4.7%
- Active inventory
- 273
- Price-to-rent
- 10.0×
Monthly cashflow live
- Estimated rent
- $2,589 medium interval (Pro) →
- Mortgage (P&I)
- −$1,631
- Tax from tax record
- −$151 /mo · $1,810/yr
- Insurance
- −$130
- HOA
- −$100
- Vacancy / Maint / Mgmt
- −$544
- Net cashflow
- $34
Break-even live
UW: 25.0% down · 7.5% · 30yr · 1.5% tax · 5.0% vac · 8.0% maint · 8.0% mgmt
Financing live
Cash to close
- Down payment
- $77,750
- Closing costs
- $9,330
- Reserves months
- —
- Total cash needed
- —
Loan-product check · same deal, 3 products live
Conventional
25% down · 7.5% · 30yr
- Down + closing
- —
- Monthly P&I
- —
- Monthly cashflow
- —
- DSCR
- —
- Eligible?
- —
Personal DTI + credit; lowest rate.
DSCR
20% down · 8.5% · 30yr
- Down + closing
- —
- Monthly P&I
- —
- Monthly cashflow
- —
- DSCR
- —
- Eligible?
- —
No personal income docs; deal must DSCR.
Hard money
10% down · 12.0% · 12mo
- Down + closing
- —
- Monthly P&I
- —
- Monthly cashflow
- —
- DSCR
- —
- Eligible?
- —
Short-term bridge; refi at stabilization.
Rent comps 2 comps
| Address | Beds | Baths | Sqft | Rent | $/sqft | DOM | Units | Dist |
|---|---|---|---|---|---|---|---|---|
| 216 Sundrop St Lexington, SC | 4.0 | 2.5 | 2321 | $2,295 | $0.99 | 3d | 1 | 1.07mi |
| 414 Tulip Way Lexington, SC | 5.0 | 3.5 | 2632 | $2,995 | $1.14 | 14d | 1 | 1.38mi |
HOA detail
- Monthly dues
- $100 · $1,200/yr
Listing history 39 events
-
2026-06-18days on market $311,000 Active 167 DOM
-
2026-06-17days on market $311,000 Active 166 DOM
-
2026-06-16remarks 699-char remark
-
2026-06-16pricedays on market $311,000 Active 165 DOM
-
2026-06-15days on market $329,500 Active 164 DOM
-
2026-06-14days on market $329,500 Active 162 DOM
-
2026-06-10pricedays on market $329,500 Active 159 DOM
-
2026-06-09days on market $334,500 Active 158 DOM
-
2026-06-08days on market $334,500 Active 157 DOM
-
2026-06-07days on market $334,500 Active 156 DOM
-
2026-06-03days on market $334,500 Active 152 DOM
-
2026-06-03days on market $334,500 Active 151 DOM
-
2026-06-02days on market $334,500 Active 150 DOM
-
2026-05-31days on market $334,500 Active 149 DOM
-
2026-05-15price $334,500
-
2026-05-12price $343,900
-
2026-05-01price $346,000
-
2026-04-24price $348,000
-
2026-02-17price $350,000
-
2026-01-02$359,900 Active
-
2025-11-14price $359,900
-
2025-11-01price $365,000
-
2025-09-09price $372,000
-
2025-07-24$375,000 Active
-
2025-04-24soldstatus $335,000
-
2025-03-16status Pending
-
2025-03-01historical Active - Contingent
-
2025-02-24$340,000 Active
-
2025-02-24historical
-
2025-01-23$340,000 Active
-
2023-11-28status Pending
-
2023-11-07price $301,999
-
2023-10-27price $309,999
-
2023-10-26status Active
-
2023-09-20status Pending
-
2023-09-20price $302,999
-
2023-08-29price $302,999
-
2023-07-19price $312,999
-
2023-07-15$324,739 Active
ⓘ Source: listings_history table (triggers on properties + properties_extension) + one-shot
backfill from property_details.listing_events for pre-trigger history.
Tax reassessment forecast SC · Resets to sale price
- Current annual tax
- $1,810 · $151/mo
- Projected year-2 tax
- $1,810 · $151/mo
- Expected delta
- $0/yr ($0/mo · 0.0%)
ⓘ Screening estimate from a state-policy table — verify with the county assessor before closing.
Nearby sold comps map
Loading sold comps map…
Walkable amenities ~0.75 mi
Loading nearby amenities…
Taxation est. · year 1
- Rental income
- $31,074
- − Mortgage interest
- −$17,421
- − Property taxes
- −$1,810
- − Insurance
- −$1,555
- − Repairs & maintenance
- −$2,486
- − Management
- −$2,486
- − HOA
- −$1,200
- − Depreciation
- −$9,047
- Taxable loss
- −$4,931
- Est. tax savings @ 24.0%
- +$1,183
- After-tax cash flow
- $1,596/yr
For passive investors: Depreciation is non-cash, so a rental often shows a tax loss while cash-flowing — sheltering income. Rental losses are passive: they offset passive income freely, and up to $25,000/yr can offset ordinary (W-2) income if you actively participate and your MAGI is under $100k (phasing out to $0 by $150k); unused losses carry forward. On sale, claimed depreciation is recaptured at up to 25%, and gains may owe capital-gains tax (a 1031 exchange can defer both). Figures are a year-1 estimate at your 24.0% rate — not tax advice; consult a CPA.
Schools (NCES district)
- District
- Lexington 01
- NCES district ID
- 4502700
- Math proficiency
- 42% ▼ -12.00%
- Reading proficiency
- 53% ▼ -2.00%
- Median HH income
- $61,298
- Composite
- 41.75/100
- National rank
- #3399
- State rank
- #11 of 80 in SC
Livability — Gilbert
- Score
- 71/100
- State rank
- #52
- US rank
- #7008
Category grades
Schools grade is shown separately in the Schools card above.
Census & demographics
- Population (ZIP)
- 10,137
Population outlook (Lexington County) Hauer SSP2
- Today (2025)
- 322,999 people
- By 2030
- 342,356 · +6.0%
- By 2040
- 377,715 · +16.9%
- By 2050
- 406,984 · +26.0%
- By 2075
- 465,447 · +44.1%
- By 2100
- 485,674 · +50.4%
Race, ethnicity, and origin ACS 2023
- Neighborhood character
- Predominantly White (86%)
- Race & ethnicity
- White 86% Hispanic / Latino 6% Two or more races 6% Black 2%
- Hispanic origin (detail)
- Mexican 4%
- Common ancestry
- Slovak 2% Italian 2% Serbian 2%
- Foreign-born
- 2% · Canada, Jamaica
- Languages at home
- 94% English-only · Spanish 5%
Political lean MEDSL · Lexington
- 2024 margin
- Solid R (+33.5) · D 32.5% · R 66.0% · Other 1.4%
- 2008→2024 swing
- +4.6pp toward D · 2008: -38.0pp · 2024: -33.5pp
- All cycles
- 2024: R+33.5 2020: R+30.1 2016: R+36.7 2012: R+37.8 2008: R+38.0
Not yet ingested
- Civics
- —
Market trends
- HPI YoY
- ▲ 20.87%
- Current HPI
- 461.9332
- Rent YoY
- —
- Metro
- —
- State GDP YoY
- ▲ 4.51%
- F500 in state
- 2
Industry mix (Fortune 500 HQ in SC)
| Industry | F500 HQs | Revenue |
|---|---|---|
| Packaging | 1 | $7B |
|
||
Price history
+3.0% since first listed25 events — show timeline
- 2026-05-15 Price Changed $334,500 Consolidated MLS
- 2026-05-12 Price Changed $343,900 Consolidated MLS
- 2026-05-01 Price Changed $346,000 Consolidated MLS
- 2026-04-24 Price Changed $348,000 Consolidated MLS
- 2026-02-17 Price Changed $350,000 Consolidated MLS
- 2026-01-02 Listed $359,900 Consolidated MLS
- 2025-11-14 Price Changed $359,900 Consolidated MLS
- 2025-11-01 Price Changed $365,000 Consolidated MLS
- 2025-09-09 Price Changed $372,000 Consolidated MLS
- 2025-07-24 Listed $375,000 Consolidated MLS
- 2025-04-24 Sold (Public Records) $335,000 Public Records
- 2025-03-16 Pending — Consolidated MLS
- 2025-03-01 Contingent — Consolidated MLS
- 2025-02-24 Listed $340,000 Consolidated MLS
- 2025-02-24 Delisted — Consolidated MLS
- 2025-01-23 Listed $340,000 Consolidated MLS
- 2023-11-28 Pending — Consolidated MLS
- 2023-11-07 Price Changed $301,999 Consolidated MLS
- 2023-10-27 Price Changed $309,999 Consolidated MLS
- 2023-10-26 Relisted — Consolidated MLS
- 2023-09-20 Pending — Consolidated MLS
- 2023-09-20 Price Changed $302,999 Consolidated MLS
- 2023-08-29 Price Changed $302,999 Consolidated MLS
- 2023-07-19 Price Changed $312,999 Consolidated MLS
- 2023-07-15 Listed $324,739 Consolidated MLS
Cash-flow waterfall
monthlySold comps — $/sqft
last 12 mo · ≤1 miLoading sold comps…