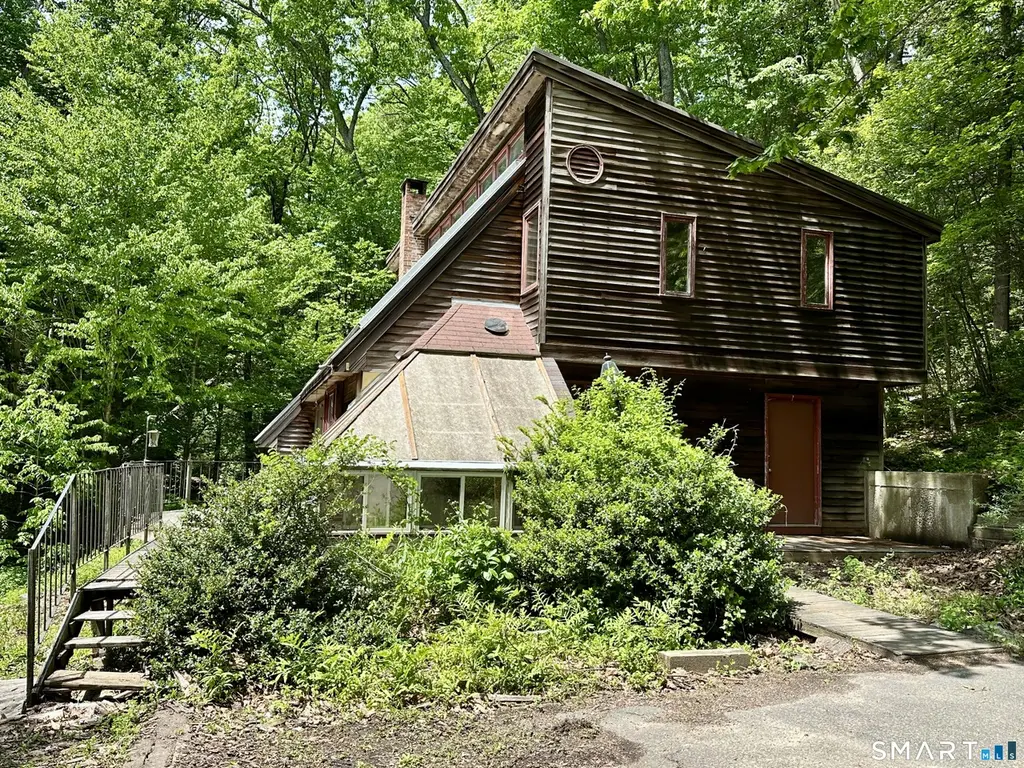
63 Fox Brook Rd · North Granby, CT
Flood risk No data
- FEMA flood zone
- —
- Chance of flooding over 30 yrs
- —
- Est. flood insurance / yr
- —
Fire risk No data
- Est. fire insurance / yr
- —
Heat risk No data
- Hot days now (above threshold)
- —
- Hot days in 30 yrs
- —
Wind risk No data
- Chance of severe wind over 30 yrs
- —
Air-quality risk No data
- Unhealthy air days now
- —
- Unhealthy air days in 30 yrs
- —
Risk factors via First Street. Map © Google.
Why this score? — see what drove the C grade
The composite is a weighted blend of 9 inputs, each scored 0–100. Each bar is that input's sub-score; the figure is the points it added to the 100-point composite (weight × sub-score).
- Cash flow +19.0/30.0
- ARV discount +7.5/15.0
- 1% rule +7.3/10.0
- DSCR +6.0/10.0
- Schools +6.0/10.0
- Livability +3.2/5.0
- Rent growth +2.5/5.0
- Condition / age +2.5/5.0
- Appreciation +1.7/10.0
$149,900
🖨 Deal sheet 📄 Offer letter ✓ Due diligence
Listing remarks
Incredible opportunity to own and restore this custom contemporary set in a peaceful, serene brookside setting right on Fox Brook. 2.2 acres in total. The open main level features vaulted ceilings, hardwood floors, a sunken living room, and a mudroom with laundry. Sliders lead to a deck overlooking the brook, with a path and steps providing direct access to the water's edge. Upstairs offers a large den area and three bedrooms, including a spacious primary suite with walk-in closet and private full bath. An attached greenhouse adds unique character and potential. Detached two-car garage. Please note this property requires renovations and is best suited for cash or rehab loan financing only.
Key facts
- Sunken living room
- 2.2 acres
- Mudroom with laundry
Tags
Property features AI
Exterior
- Parking: Detached garage; 2-car garage
- Utilities: Private well water; Septic system; Above-ground fuel tank
- Home design: Single-family home
- Construction: Frame construction; Concrete foundation; Brown exterior color
- Exterior features: Wood siding; Brook on the property; Lightly wooded lot
Interior
- Kitchen: No appliance details provided
- Bedrooms: 3 bedrooms
- Bathrooms: 2 full bathrooms; 1 half bathroom
- Heating & cooling: Ceiling fans; Wood/coal stove heat; Gravity warm air heating; Passive solar features; Propane hot water
- Interior features: Open floor plan; One fireplace; Crawl space basement
- Laundry & utility: Laundry on main level
Neighborhood map
What this means for you Summary
Snapshot
- This is a 3-bed/2.5-bath single-family listed at $150k.
Deal economics
- At list price, monthly cash flow is $156 ($2k/yr) — positive.
- The deal already cash-flows at list — no discount required.
- Meets the 1% rule at list price ($2k rent vs $150k).
Location & tenants
- Location reads 63/100 on livability (#132 in CT) — a middle-class / working-renter tenant base. Strengths: crime A+, employment A+, housing A+; Watch: amenities F, commute F, cost of living F.
- Hartland School District (rural): math 55% / reading 75% proficiency, ranked #69 of 192 in CT (top 36%) — acceptable for families but not a draw, mixed tenant base, ~2y average lease; only 6% free/reduced lunch — higher-income household profile.
- Market conditions: 8 active listings in the ZIP; 154 units permitted in Northwest Hills Planning Region in 2024 (6 in 5+ unit buildings).
Forward outlook
- Local home prices are declining (-3.0%/yr); year-one equity from $1k of loan paydown is wiped out by about $4k of value loss. Plan a longer hold.
Negotiation context
- Only 5 days on market — expect competitive offers; lowballing is unlikely to land.
Risks & watch-outs
- Watch-outs: property tax is 3.6% of price.
Questions for the listing agent
- Built in 1977 — when were the roof, HVAC, electrical panel, plumbing, and water heater last replaced?
- Property tax is high relative to price — has the assessment been appealed recently, and will the sale trigger a re-assessment?
- Is there a deadline driving the sale (1031 exchange, divorce, estate, relocation)? That informs how much negotiation room exists.
- What's the average days-on-market for RENTAL listings here right now (not sales)? A rising rental-DOM trend means longer vacancies and softer asking-rent achievability than the comps imply.
- What's the recent tenant-quality profile in this submarket — average credit score on applications, eviction rate, late-payment / NSF rate, and stable-employment percentage? A property-management company in the area should have these aggregated.
- How much new for-sale + rental construction is in the pipeline within 1–3 miles? Heavy new supply typically softens prices + rents 12–24 months out; constrained supply supports both.
Investment metrics
- 1% rule
- 1.23% ✓
- Cap rate
- 7.54%
- Cash-on-cash
- 4.46%
- DSCR
- 1.20
- GRM
- 6.8
CMA / ARV
- ARV (on-the-fly)
- $438,416
- Comps found
- 3
Show comp detail 3 sales within ~0.75 mi
| Address | Dist | Beds/Ba | Sqft | Sold | Price | $/sf | Match |
|---|---|---|---|---|---|---|---|
| 88 Fox Brook Rd | 0.03mi | 3/2.5 | 2,397 (+3%) | 13mo | $450,000 | $188 | 83 |
| 525 Granville Rd | 0.33mi | 4/2.0 (+1) | 2,352 (+1%) | 22mo | $370,000 | $157 | 58 |
| 40 Kensington Acres Rd | 0.28mi | 3/2.5 | 2,511 (+8%) | 24mo | $550,000 | $219 | 54 |
Match score weights: distance 35% · size 25% · config 20% · recency 20%. Top-matched comps best support the ARV.
Projected returns pro-forma
-3.0% appreciation · 3.0% rent growth · sell at horizon
- IRR
- -9.2%
- Equity multiple
- 0.66×
- Total profit
- $-14,166
- Equity at exit
- $22,351
- IRR
- 0.4%
- Equity multiple
- 1.03×
- Total profit
- $1,228
- Equity at exit
- $12,961
Cash invested: $41,972 (down + closing). Projections, not guarantees.
Landlord ↔ Tenant lean methodology
- Overall (STATE)
- 27 Tenant-Leaning
- State Connecticut
- 27 Tenant-Leaning · D+7
- County
- — inherits STATE
- City
- — inherits STATE
ZIP-level market 06027
- Home prices YoY
- -2.8%
- Active inventory
- 8
- Price-to-rent
- 6.8×
Monthly cashflow live
- Estimated rent
- $1,843 medium interval (Pro) →
- Mortgage (P&I)
- −$786
- Tax from tax record
- −$451 /mo · $5,413/yr
- Insurance
- −$62
- HOA
- −$0
- Vacancy / Maint / Mgmt
- −$387
- Net cashflow
- $156
Break-even live
UW: 25.0% down · 7.5% · 30yr · 1.5% tax · 5.0% vac · 8.0% maint · 8.0% mgmt
Financing live
Cash to close
- Down payment
- $37,475
- Closing costs
- $4,497
- Reserves months
- —
- Total cash needed
- —
Loan-product check · same deal, 3 products live
Conventional
25% down · 7.5% · 30yr
- Down + closing
- —
- Monthly P&I
- —
- Monthly cashflow
- —
- DSCR
- —
- Eligible?
- —
Personal DTI + credit; lowest rate.
DSCR
20% down · 8.5% · 30yr
- Down + closing
- —
- Monthly P&I
- —
- Monthly cashflow
- —
- DSCR
- —
- Eligible?
- —
No personal income docs; deal must DSCR.
Hard money
10% down · 12.0% · 12mo
- Down + closing
- —
- Monthly P&I
- —
- Monthly cashflow
- —
- DSCR
- —
- Eligible?
- —
Short-term bridge; refi at stabilization.
Listing history 6 events
-
2026-06-03status $149,900 Under Contract 5 DOM
-
2026-06-02days on market $149,900 Active 5 DOM
-
2026-06-01days on market $149,900 Active 4 DOM
-
2026-05-31days on market $149,900 Active 3 DOM
-
2026-05-31days on market $149,900 Active 2 DOM
-
2026-05-28$149,900 Active
ⓘ Source: listings_history table (triggers on properties + properties_extension) + one-shot
backfill from property_details.listing_events for pre-trigger history.
Tax reassessment forecast CT · Partial reset (capped growth)
- Current annual tax
- $5,413 · $451/mo
- Projected year-2 tax
- $5,413 · $451/mo
- Expected delta
- $0/yr ($0/mo · 0.0%)
ⓘ Screening estimate from a state-policy table — verify with the county assessor before closing.
Nearby sold comps map
Loading sold comps map…
Walkable amenities ~0.75 mi
Loading nearby amenities…
Taxation est. · year 1
- Rental income
- $22,111
- − Mortgage interest
- −$8,397
- − Property taxes
- −$5,413
- − Insurance
- −$750
- − Repairs & maintenance
- −$1,769
- − Management
- −$1,769
- − Depreciation
- −$4,361
- Taxable loss
- −$347
- Est. tax savings @ 24.0%
- +$83
- After-tax cash flow
- $1,955/yr
For passive investors: Depreciation is non-cash, so a rental often shows a tax loss while cash-flowing — sheltering income. Rental losses are passive: they offset passive income freely, and up to $25,000/yr can offset ordinary (W-2) income if you actively participate and your MAGI is under $100k (phasing out to $0 by $150k); unused losses carry forward. On sale, claimed depreciation is recaptured at up to 25%, and gains may owe capital-gains tax (a 1031 exchange can defer both). Figures are a year-1 estimate at your 24.0% rate — not tax advice; consult a CPA.
Schools (NCES district)
- District
- Hartland School District
- NCES district ID
- 0901950
- Math proficiency
- 55% ▲ 5.00%
- Reading proficiency
- 75% ▲ 5.00%
- Median HH income
- $88,705
- Composite
- 60.28/100
- National rank
- #1738
- State rank
- #69 of 192 in CT
Livability — North Granby
- Score
- 63/100
- State rank
- #132
- US rank
- #16054
Category grades
Schools grade is shown separately in the Schools card above.
Census & demographics
- City population
- 2,290
- Population (ZIP)
- 1,376
Population outlook (Northwest Hills County) Hauer SSP2
- By 2040
- 118,998
Race, ethnicity, and origin ACS 2023
- Neighborhood character
- Predominantly White (95%)
- Race & ethnicity
- White 95% Hispanic / Latino 4% Two or more races 3%
- Common ancestry
- Romanian 12% Lithuanian 7% Portuguese 5%
- Foreign-born
- 3% · Canada
- Languages at home
- 96% English-only · Spanish 3%
Political lean MEDSL · Northwest Hills
- 2024 margin
- Toss-up / Even · D 48.6% · R 49.9% · Other 1.6%
- All cycles
- 2024: R+1.3
Not yet ingested
- Civics
- —
Market trends
- HPI YoY
- ▼ -6.66%
- Current HPI
- 228.2331
- Rent YoY
- —
- Metro
- —
- State GDP YoY
- ▲ 1.06%
- F500 in state
- 38
Industry mix (Fortune 500 HQ in CT)
| Industry | F500 HQs | Revenue |
|---|---|---|
| Industrial Machinery | 4 | $38B |
|
||
| Insurance | 3 | $71B |
|
||
| Financial Services | 2 | $25B |
|
||
| Transportation / Logistics | 2 | $18B |
|
||
| Healthcare | 1 | $247B |
|
||
| Telecommunications | 1 | $55B |
|
||
Price history
1 event — show timeline
- 2026-05-28 Listed $149,900 Smart MLS
Property tax history
+0.9%/yrLatest (2025): $5,413 · +5.0% YoY. Source: county tax records.
Cash-flow waterfall
monthlySold comps — $/sqft
last 12 mo · ≤1 miLoading sold comps…