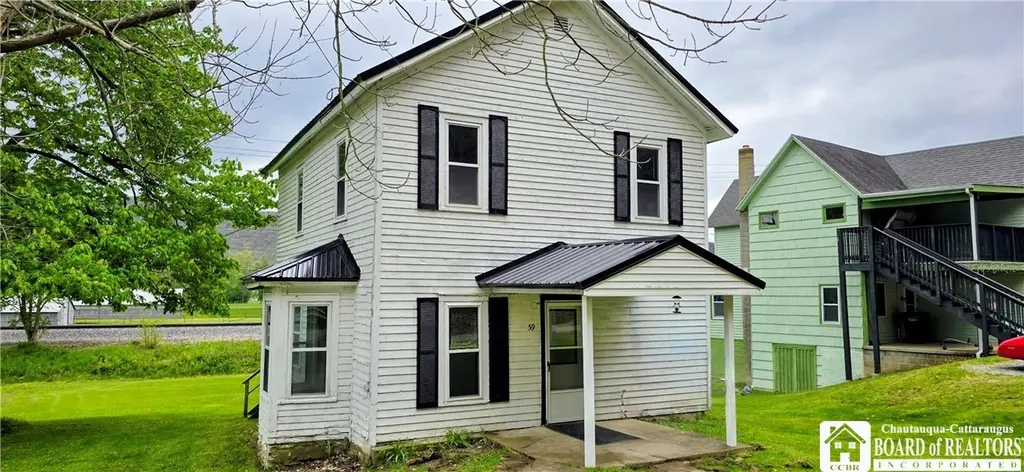
59 Lillibridge Rd · Portville, NY
Flood risk 5/10 · Moderate
- FEMA flood zone
- X (shaded)
- Chance of flooding over 30 yrs
- 0.27%
- Est. flood insurance / yr
- $473 – $860
Fire risk 3/10 · Minor
- Est. fire insurance / yr
- $691 – $1,283
Heat risk 2/10 · Minimal
- Hot days now (above 90°F)
- 7 days/yr
- Hot days in 30 yrs
- 17 days/yr
Wind risk 1/10 · Minimal
- Chance of severe wind over 30 yrs
- —
Air-quality risk 1/10 · Minimal
- Unhealthy air days now
- 0 days/yr
- Unhealthy air days in 30 yrs
- 0 days/yr
Risk factors via First Street. Map © Google.
Why this score? — see what drove the C- grade
The composite is a weighted blend of 9 inputs, each scored 0–100. Each bar is that input's sub-score; the figure is the points it added to the 100-point composite (weight × sub-score).
- Cash flow +12.7/30.0
- ARV discount +10.9/15.0
- Appreciation +8.8/10.0
- Schools +5.5/10.0
- 1% rule +4.4/10.0
- DSCR +3.8/10.0
- Livability +3.1/5.0
- Rent growth +2.5/5.0
- Condition / age +2.5/5.0
$119,900
🖨 Deal sheet 📄 Offer letter ✓ Due diligence
Listing remarks
Located in the heart of the Portville, this well-maintained 3 bedroom, 1.5 bath home offers a blend of charm, comfort, and updates throughout. Situated on a spacious yard with plenty of room for outdoor entertaining, gardening, or simply enjoying the peaceful setting. This property has seen many improvements over the years including the roof, windows, hot water tank, electric, insulation, flooring, and paint. Inside, you'll find inviting living spaces filled with natural light, functional layout options, and plenty of character to make you feel right at home. Conveniently located near village amenities while still offering a welcoming neighborhood feel, this property is ready for its next o
Key facts
- Spacious yard
- Hot water tank
- Outdoor entertaining
Tags
Property features AI
Exterior
- Parking: No garage
- Utilities: Electricity connected; Public water connected; Sewer connected; Cable available; High-speed internet available
- Home design: 2 stories; Existing construction
- Construction: Metal roof; Wood siding; Stone foundation; Blown-in insulation; Built previously (existing)
- Exterior features: Dirt driveway; Rectangular lot (60 x 136)
Interior
- Kitchen: Gas oven; Gas range; Refrigerator
- Flooring: Carpet; Vinyl; Varies
- Bathrooms: 1 full bathroom; 1 half bathroom; 1 main-level bathroom
- Heating & cooling: Gas heating; Forced air; Space heater
- Interior features: Thermal windows; Galley kitchen; Has basement with partial, crawl space, exterior entry and walk-up access
- Laundry & utility: Laundry on main level
Neighborhood map
What this means for you Summary
Snapshot
- This is a 3-bed/1.5-bath single-family listed at $120k.
Deal economics
- At list price, monthly cash flow is $-13 ($-158/yr) — negative.
- To cash-flow at today's rent, offer at most $118k (1.9% below list).
- To meet the 1% rule (rent ≥ 1% of price), the offer needs to be $113k (5.6% below list).
- Recommended offer: $113k (5.6% below list) — sets the bar for 1% rule.
Location & tenants
- Location reads 62/100 on livability (#877 in NY) — a middle-class / working-renter tenant base. Strengths: cost of living A+, housing A+, schools B; Watch: employment D, health & safety D, crime F.
- Portville Central School District (rural): math 63% / reading 65% proficiency, ranked #190 of 590 in NY (top 32%) — acceptable for families but not a draw, mixed tenant base, ~2y average lease.
- Market conditions: 25 active listings in the ZIP; 128 units permitted in Cattaraugus County in 2024 (21 in 5+ unit buildings).
Forward outlook
- In year one you build about $10k of equity ($829 loan paydown + $9k appreciation (7.7% local appreciation)).
- Cattaraugus County population projected at -28% by 2050 — secular population decline; favor cash flow + early exit over multi-decade hold.
- At projected returns (7.7% appreciation + 3.0% rent growth), your $34k cash investment doubles in ~4 years — after that, you're playing with house money.
- By year 4, paydown + projected appreciation supports a ~$35k cash-out refi (75% LTV) — recoverable capital for the next deal without selling this one.
Negotiation context
- It's been on market 35 days — a 3% lower offer ($116k) is reasonable based on typical stale-listing flexibility.
Risks & watch-outs
- Watch-outs: built in 1920 — expect roof / HVAC / electrical / plumbing capex.
- Climate carrying-cost: moderate flood risk — expect insurance premiums to compound above CPI over the hold.
Questions for the listing agent
- What do current leases actually rent for vs. the listed asking? Can we see a recent rent roll and the last 12 months of T-12 income?
- It's been on market 35 days. Have you received any prior offers? Is the seller open to a 6% concession, seller financing, or rate buy-down credit?
- Built in 1920 — when were the roof, HVAC, electrical panel, plumbing, and water heater last replaced?
- Is there a deadline driving the sale (1031 exchange, divorce, estate, relocation)? That informs how much negotiation room exists.
- Schools are B-rated — typically a magnet for longer-tenancy family renters. What's the average tenant stay here, and is there a school-zone premium baked into asking?
- Crime grade is F in this area — have there been break-ins, vandalism, or insurance claims at this property in the last 3 years? What carrier currently insures it and at what premium?
- What's the average days-on-market for RENTAL listings here right now (not sales)? A rising rental-DOM trend means longer vacancies and softer asking-rent achievability than the comps imply.
- What's the recent tenant-quality profile in this submarket — average credit score on applications, eviction rate, late-payment / NSF rate, and stable-employment percentage? A property-management company in the area should have these aggregated.
- How much new for-sale + rental construction is in the pipeline within 1–3 miles? Heavy new supply typically softens prices + rents 12–24 months out; constrained supply supports both.
Investment metrics
- 1% rule
- 0.94% ✗
- Cap rate
- 6.16%
- Cash-on-cash
- -0.47%
- DSCR
- 0.98
- GRM
- 8.8
CMA / ARV
- ARV (median comp)
- $129,557
- List price
- $119,900
- Delta
- -7.45%
- Verdict
- FAIR
- Comps
- 13 within 1.0 mi
Show comp detail 3 sales within ~0.75 mi
| Address | Dist | Beds/Ba | Sqft | Sold | Price | $/sf | Match |
|---|---|---|---|---|---|---|---|
| 11 Colwell St | 0.43mi | 3/1.0 | 1,272 (-1%) | 19mo | $60,000 | $47 | 60 |
| 104 S Main St | 0.75mi | 2/1.0 (-1) | 1,300 (+1%) | 8mo | $155,000 | $119 | 50 |
| 16 Goss Ave | 0.70mi | 3/1.0 | 1,450 (+13%) | 8mo | $137,000 | $94 | 38 |
Match score weights: distance 35% · size 25% · config 20% · recency 20%. Top-matched comps best support the ARV.
Projected returns pro-forma
7.68% appreciation · 3.0% rent growth · sell at horizon
- IRR
- 18.9%
- Equity multiple
- 2.38×
- Total profit
- $46,196
- Equity at exit
- $88,515
- IRR
- 17.9%
- Equity multiple
- 5.01×
- Total profit
- $134,749
- Equity at exit
- $173,299
Cash invested: $33,572 (down + closing). Projections, not guarantees.
Landlord ↔ Tenant lean methodology
- Overall (STATE)
- 15 Strongly Tenant-Friendly
- State New York
- 15 Strongly Tenant-Friendly · D+10
- County
- — inherits STATE
- City
- — inherits STATE
ZIP-level market 14770
- Home prices YoY
- 2.9%
- Active inventory
- 25
- Price-to-rent
- 8.8×
Monthly cashflow live
- Estimated rent
- $1,132 medium interval (Pro) →
- Mortgage (P&I)
- −$629
- Tax from tax record
- −$228 /mo · $2,742/yr
- Insurance
- −$50
- HOA
- −$0
- Vacancy / Maint / Mgmt
- −$238
- Net cashflow
- $-13
Break-even live
UW: 25.0% down · 7.5% · 30yr · 1.5% tax · 5.0% vac · 8.0% maint · 8.0% mgmt
Financing live
Cash to close
- Down payment
- $29,975
- Closing costs
- $3,597
- Reserves months
- —
- Total cash needed
- —
Loan-product check · same deal, 3 products live
Conventional
25% down · 7.5% · 30yr
- Down + closing
- —
- Monthly P&I
- —
- Monthly cashflow
- —
- DSCR
- —
- Eligible?
- —
Personal DTI + credit; lowest rate.
DSCR
20% down · 8.5% · 30yr
- Down + closing
- —
- Monthly P&I
- —
- Monthly cashflow
- —
- DSCR
- —
- Eligible?
- —
No personal income docs; deal must DSCR.
Hard money
10% down · 12.0% · 12mo
- Down + closing
- —
- Monthly P&I
- —
- Monthly cashflow
- —
- DSCR
- —
- Eligible?
- —
Short-term bridge; refi at stabilization.
Listing history 15 events
-
2026-06-18days on market $119,900 Active 35 DOM
-
2026-06-17days on market $119,900 Active 34 DOM
-
2026-06-16days on market $119,900 Active 33 DOM
-
2026-06-15days on market $119,900 Active 32 DOM
-
2026-06-13days on market $119,900 Active 30 DOM
-
2026-06-12days on market $119,900 Active 29 DOM
-
2026-06-09days on market $119,900 Active 26 DOM
-
2026-06-08days on market $119,900 Active 25 DOM
-
2026-06-07days on market $119,900 Active 24 DOM
-
2026-06-07days on market $119,900 Active 23 DOM
-
2026-06-04days on market $119,900 Active 20 DOM
-
2026-06-02days on market $119,900 Active 19 DOM
-
2026-06-01days on market $119,900 Active 18 DOM
-
2026-05-31days on market $119,900 Active 17 DOM
-
2026-05-14$119,900 Active 731-char remark
ⓘ Source: listings_history table (triggers on properties + properties_extension) + one-shot
backfill from property_details.listing_events for pre-trigger history.
Tax reassessment forecast NY · Partial reset (capped growth)
- Current annual tax
- $2,742 · $228/mo
- Projected year-2 tax
- $2,742 · $228/mo
- Expected delta
- $0/yr ($0/mo · 0.0%)
ⓘ Screening estimate from a state-policy table — verify with the county assessor before closing.
Climate risk First Street
- Flood 5/10 Major FEMA zone X (shaded) · 27% chance over 30 yrs
- Wildfire 3/10 Moderate
- Heat 2/10 Low 7 d/yr ≥90°F today · 17 d/yr by 30 yrs out
- Wind 1/10 Low
- Air quality 1/10 Low 0 unhealthy d/yr today · 0 by 30 yrs out
Nearby sold comps map
Loading sold comps map…
Walkable amenities ~0.75 mi
Loading nearby amenities…
Taxation est. · year 1
- Rental income
- $13,580
- − Mortgage interest
- −$6,716
- − Property taxes
- −$2,742
- − Insurance
- −$600
- − Repairs & maintenance
- −$1,086
- − Management
- −$1,086
- − Depreciation
- −$3,488
- Taxable loss
- −$2,138
- Est. tax savings @ 24.0%
- +$513
- After-tax cash flow
- $355/yr
For passive investors: Depreciation is non-cash, so a rental often shows a tax loss while cash-flowing — sheltering income. Rental losses are passive: they offset passive income freely, and up to $25,000/yr can offset ordinary (W-2) income if you actively participate and your MAGI is under $100k (phasing out to $0 by $150k); unused losses carry forward. On sale, claimed depreciation is recaptured at up to 25%, and gains may owe capital-gains tax (a 1031 exchange can defer both). Figures are a year-1 estimate at your 24.0% rate — not tax advice; consult a CPA.
Schools (NCES district)
- District
- Portville Central School District
- NCES district ID
- 3623640
- Math proficiency
- 63% ▲ 1.00%
- Reading proficiency
- 65% ▲ 5.00%
- Median HH income
- $52,207
- Composite
- 54.6/100
- National rank
- #1337
- State rank
- #190 of 590 in NY
Livability — Portville
- Score
- 62/100
- State rank
- #877
- US rank
- #17008
Category grades
Schools grade is shown separately in the Schools card above.
Census & demographics
- Census place
- Portville, NY
- Population (ZIP)
- 2,805
Population outlook (Cattaraugus County) Hauer SSP2
- Today (2025)
- 71,623 people
- By 2030
- 67,751 · -5.4%
- By 2040
- 59,488 · -16.9%
- By 2050
- 51,601 · -28.0%
- By 2075
- 35,025 · -51.1%
- By 2100
- 21,243 · -70.3%
Race, ethnicity, and origin ACS 2023
- Neighborhood character
- Predominantly White (93%)
- Race & ethnicity
- White 93% Two or more races 4% Black 2%
- Common ancestry
- Romanian 8% Slovak 4% Lithuanian 1%
- Foreign-born
- 2% · Canada
- Languages at home
- 99% English-only · Spanish 1%
Political lean MEDSL · Cattaraugus
- 2024 margin
- Solid R (+32.8) · D 33.6% · R 66.4%
- 2008→2024 swing
- -22.2pp toward R · 2008: -10.6pp · 2024: -32.8pp
- All cycles
- 2024: R+32.8 2020: R+29.5 2016: R+34.4 2012: R+13.4 2008: R+10.6
Not yet ingested
- Civics
- —
Market trends
- HPI YoY
- ▲ 7.68%
- Current HPI
- 276.8841
- Rent YoY
- —
- Metro
- —
- State GDP YoY
- ▲ 2.60%
- F500 in state
- 92
Industry mix (Fortune 500 HQ in NY)
| Industry | F500 HQs | Revenue |
|---|---|---|
| Financial Services | 10 | $950B |
|
||
| Consumer Goods | 9 | $162B |
|
||
| Insurance | 4 | $225B |
|
||
| Telecommunications | 2 | $144B |
|
||
| Pharmaceuticals | 2 | $112B |
|
||
| Media / Entertainment | 2 | $69B |
|
||
Price history
1 event — show timeline
- 2026-05-14 Listed $119,900 UNYREIS
Property tax history
+1.5%/yrLatest (2025): $2,742 · +5.1% YoY. Source: county tax records.
Cash-flow waterfall
monthlySold comps — $/sqft
last 12 mo · ≤1 miLoading sold comps…