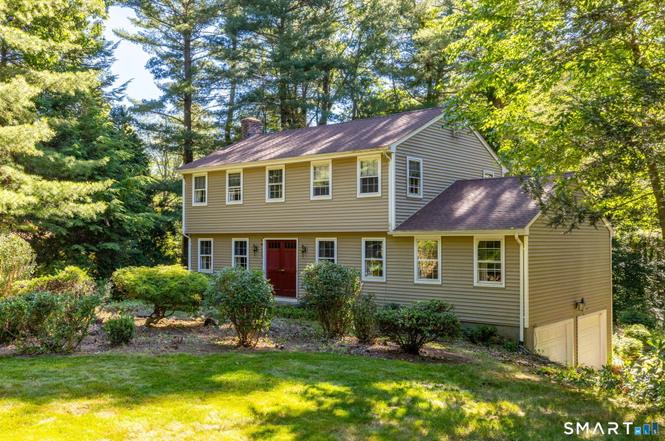
10 Horseshoe Dr · East Granby, CT
Flood risk 1/10 · Minimal
- FEMA flood zone
- X (unshaded)
- Chance of flooding over 30 yrs
- 0.0%
- Est. flood insurance / yr
- $473 – $860
Fire risk 2/10 · Minimal
- Est. fire insurance / yr
- $829 – $1,539
Heat risk 4/10 · Minor
- Hot days now (above 97°F)
- 7 days/yr
- Hot days in 30 yrs
- 16 days/yr
Wind risk 6/10 · Moderate
- Chance of severe wind over 30 yrs
- 27.0%
Air-quality risk 2/10 · Minimal
- Unhealthy air days now
- 1 days/yr
- Unhealthy air days in 30 yrs
- 2 days/yr
Risk factors via First Street. Map © Google.
Why this score? — see what drove the D+ grade
The composite is a weighted blend of 9 inputs, each scored 0–100. Each bar is that input's sub-score; the figure is the points it added to the 100-point composite (weight × sub-score).
- Cash flow +15.2/30.0
- ARV discount +7.5/15.0
- 1% rule +5.3/10.0
- Schools +5.2/10.0
- DSCR +4.7/10.0
- Rent growth +2.5/5.0
- Livability +2.5/5.0
- Condition / age +2.5/5.0
- Appreciation +0.0/10.0
$275,000
🖨 Deal sheet (PDF) 📄 Offer letter ✓ Due diligence
Listing remarks
Welcome to this classic 4-bedroom, 1.5-bathroom Colonial situated on a generous 0.93-acre level lot in charming East Granby, CT. Designed for seamless living, the main floor features a spacious combined living and dining area that flows effortlessly into the kitchen. Unwind in the welcoming family room, where a cozy fireplace serves as the centerpiece and large glass sliders open directly out to the back deck. Upstairs, all four bedrooms offer comfortable wall-to-wall carpeting and ample closet space. Step outside to enjoy a private, lightly treed backyard that serves up peaceful nature vibes and plenty of room for outdoor activities. The property's serene location is matched by its excepti
Key facts
- Scenic hiking trails
- Private backyard
- Level lot
Tags
Property features AI
Exterior
- Parking: Under-house garage; 2-car garage
- Utilities: Private well water; Septic system; Electric service
- Home design: Single family home
- Construction: Frame construction; Concrete foundation; Asphalt shingle roof; Aluminum siding
- Exterior features: Terrace; Deck; Gutters; Exterior lighting; Treed lot
Interior
- Kitchen: Wall oven; Refrigerator; Dishwasher
- Bedrooms: 4 bedrooms
- Bathrooms: 1 full bathroom; 1 half bathroom
- Heating & cooling: Electric baseboard heat
- Interior features: Auto garage door opener; Cable available; One fireplace; Full unfinished walk-out basement with storage; Attic with storage space and access via hatch; 8 total rooms
- Laundry & utility: Washer and dryer located on the main level; Electric domestic hot water
Neighborhood map
What this means for you Summary
Snapshot
- This is a 4-bed/1.5-bath single-family listed at $275k.
Deal economics
- At list price, monthly cash flow is $97 ($1k/yr) — positive.
- The deal already cash-flows at list — no discount required.
- Meets the 1% rule at list price ($3k rent vs $275k).
Location & tenants
- Location reads: area grade D — affects rentability + tenant quality, not the cash-flow math above.
- East Granby School District (rural): math 51% / reading 64% proficiency, ranked #54 of 153 in CT (top 35%) — acceptable for families but not a draw, mixed tenant base, ~2y average lease; only 8% free/reduced lunch — higher-income household profile.
- Zoned schools: East Granby High School (math 57% / reading 67%, grade B-, #40 of 194 statewide, top 21%, 258 students, 14% FRL).
- Market conditions: 26 active listings in the ZIP; 1,867 units permitted in Capitol Planning Region in 2024 (1,399 in 5+ unit buildings).
Forward outlook
- Local home prices are declining (-3.0%/yr); year-one equity from $2k of loan paydown is wiped out by about $8k of value loss. Plan a longer hold.
Negotiation context
- Only 4 days on market — expect competitive offers; lowballing is unlikely to land.
Risks & watch-outs
- Watch-outs: property tax is 2.6% of price.
- Climate carrying-cost: major wind risk, 27% chance of damaging wind over 30y — expect insurance premiums to compound above CPI over the hold.
Questions for the listing agent
- Built in 1974 — when were the roof, HVAC, electrical panel, plumbing, and water heater last replaced?
- Property tax is high relative to price — has the assessment been appealed recently, and will the sale trigger a re-assessment?
- Is there a deadline driving the sale (1031 exchange, divorce, estate, relocation)? That informs how much negotiation room exists.
- The area grade is low — what's the realistic commute time and amenity access for the typical tenant pool here? Any planned neighborhood developments (good or bad) we should know about?
- What's the average days-on-market for RENTAL listings here right now (not sales)? A rising rental-DOM trend means longer vacancies and softer asking-rent achievability than the comps imply.
- What's the recent tenant-quality profile in this submarket — average credit score on applications, eviction rate, late-payment / NSF rate, and stable-employment percentage? A property-management company in the area should have these aggregated.
- How much new for-sale + rental construction is in the pipeline within 1–3 miles? Heavy new supply typically softens prices + rents 12–24 months out; constrained supply supports both.
Investment metrics
- 1% rule
- 1.03% ✓
- Cap rate
- 6.72%
- Cash-on-cash
- 1.52%
- DSCR
- 1.07
- GRM
- 8.1
CMA / ARV
No comps found within radius.
Projected returns pro-forma
-3.0% appreciation · 3.0% rent growth · sell at horizon
- IRR
- -13.8%
- Equity multiple
- 0.50×
- Total profit
- $-38,173
- Equity at exit
- $41,003
- IRR
- -4.8%
- Equity multiple
- 0.68×
- Total profit
- $-24,471
- Equity at exit
- $23,777
Cash invested: $77,000 (down + closing). Projections, not guarantees.
Landlord ↔ Tenant lean methodology
- Overall (STATE)
- 27 Tenant-Leaning
- State Connecticut
- 27 Tenant-Leaning · D+7
- County
- — inherits STATE
- City
- — inherits STATE
ZIP-level market 06026
- Home prices YoY
- -18.4%
- Active inventory
- 26
- Price-to-rent
- 8.1×
Monthly cashflow live
- Estimated rent
- $2,844 medium interval (Pro) →
- Mortgage (P&I)
- −$1,442
- Tax from tax record
- −$592 /mo · $7,110/yr
- Insurance
- −$115
- HOA
- −$0
- Vacancy / Maint / Mgmt
- −$597
- Net cashflow
- $97
Break-even live
Sensitivity live
| Price | -10% $253 | -5% $175 | +0% $97 | +5% $19 | +10% $-58 |
|---|---|---|---|---|---|
| Rent | -10% $-127 | -5% $-15 | +0% $97 | +5% $210 | +10% $322 |
| Rate | -1.0pp $236 | -0.5pp $167 | base $97 | +0.5pp $26 | +1.0pp $-47 |
UW: 25.0% down · 7.5% · 30yr · 1.5% tax · 5.0% vac · 8.0% maint · 8.0% mgmt
Financing live
Cash to close
- Down payment
- $68,750
- Closing costs
- $8,250
- Reserves months
- —
- Total cash needed
- —
Loan-product check · same deal, 3 products live
Conventional
25% down · 7.5% · 30yr
- Down + closing
- —
- Monthly P&I
- —
- Monthly cashflow
- —
- DSCR
- —
- Eligible?
- —
Personal DTI + credit; lowest rate.
DSCR
20% down · 8.5% · 30yr
- Down + closing
- —
- Monthly P&I
- —
- Monthly cashflow
- —
- DSCR
- —
- Eligible?
- —
No personal income docs; deal must DSCR.
Hard money
10% down · 12.0% · 12mo
- Down + closing
- —
- Monthly P&I
- —
- Monthly cashflow
- —
- DSCR
- —
- Eligible?
- —
Short-term bridge; refi at stabilization.
Listing history 3 events
-
2026-06-21days on market $275,000 Active 4 DOM
-
2026-06-17remarks 699-char remark
-
2026-06-17$275,000 Active 1 DOM
ⓘ Source: listings_history table (triggers on properties + properties_extension) + one-shot
backfill from property_details.listing_events for pre-trigger history.
Tax reassessment forecast CT · Partial reset (capped growth)
- Current annual tax
- $7,110 · $592/mo
- Projected year-2 tax
- $7,110 · $592/mo
- Expected delta
- $0/yr ($0/mo · 0.0%)
ⓘ Screening estimate from a state-policy table — verify with the county assessor before closing.
Climate risk First Street
- Flood 1/10 Low FEMA zone X (unshaded) · 0% chance over 30 yrs
- Wildfire 2/10 Low
- Heat 4/10 Moderate 7 d/yr ≥97°F today · 16 d/yr by 30 yrs out
- Wind 6/10 Major 27% chance of damaging wind over 30 yrs
- Air quality 2/10 Low 1 unhealthy d/yr today · 2 by 30 yrs out
Nearby sold comps map
Loading sold comps map…
Walkable amenities ~0.75 mi
Loading nearby amenities…
Taxation est. · year 1
- Rental income
- $34,123
- − Mortgage interest
- −$15,404
- − Property taxes
- −$7,110
- − Insurance
- −$1,375
- − Repairs & maintenance
- −$2,730
- − Management
- −$2,730
- − Depreciation
- −$8,000
- Taxable loss
- −$3,226
- Est. tax savings @ 24.0%
- +$774
- After-tax cash flow
- $1,941/yr
For passive investors: Depreciation is non-cash, so a rental often shows a tax loss while cash-flowing — sheltering income. Rental losses are passive: they offset passive income freely, and up to $25,000/yr can offset ordinary (W-2) income if you actively participate and your MAGI is under $100k (phasing out to $0 by $150k); unused losses carry forward. On sale, claimed depreciation is recaptured at up to 25%, and gains may owe capital-gains tax (a 1031 exchange can defer both). Figures are a year-1 estimate at your 24.0% rate — not tax advice; consult a CPA.
Schools (NCES district)
- District
- East Granby School District
- NCES district ID
- 0901170
- Math proficiency
- 51% ▼ -14.00%
- Reading proficiency
- 64% ▼ -9.00%
- Median HH income
- $78,289
- Composite
- 51.66/100
- National rank
- #1695
- State rank
- #54 of 153 in CT
Livability — East Granby
No livability data for this city. (Only ~50 U.S. cities are tracked.)
Census & demographics
- Population (ZIP)
- 5,176
Population outlook (Capitol County) Hauer SSP2
- By 2040
- 1,063,519
Race, ethnicity, and origin ACS 2023
- Neighborhood character
- Predominantly White (77%)
- Race & ethnicity
- White 77% Two or more races 9% Hispanic / Latino 6% Black 4% Asian 3%
- Hispanic origin (detail)
- Puerto Rican 3%
- Common ancestry
- Romanian 7% Portuguese 3% Slovak 2%
- Foreign-born
- 10% · Canada, China, South Korea
- Languages at home
- 86% English-only · Spanish 5% Other Asian/Pacific 2% French/Haitian/Cajun 2%
Political lean MEDSL · Capitol
- 2024 margin
- Strong D (+21.9) · D 60.1% · R 38.2% · Other 1.7%
- All cycles
- 2024: D+21.9
Not yet ingested
- Civics
- —
Market trends
- HPI YoY
- ▼ -52.66%
- Current HPI
- 234.323
- Rent YoY
- —
- Metro
- —
- State GDP YoY
- ▲ 1.06%
- F500 in state
- 38
Industry mix (Fortune 500 HQ in CT)
| Industry | F500 HQs | Revenue |
|---|---|---|
| Industrial Machinery | 4 | $38B |
|
||
| Insurance | 3 | $71B |
|
||
| Financial Services | 2 | $25B |
|
||
| Transportation / Logistics | 2 | $18B |
|
||
| Healthcare | 1 | $247B |
|
||
| Telecommunications | 1 | $55B |
|
||
Price history
1 event — show timeline
- 2026-06-17 Listed $275,000 Smart MLS
Property tax history
+1.8%/yrLatest (2025): $7,110 · +2.4% YoY. Source: county tax records.
Cash-flow waterfall
monthlySold comps — $/sqft
last 12 mo · ≤1 miLoading sold comps…