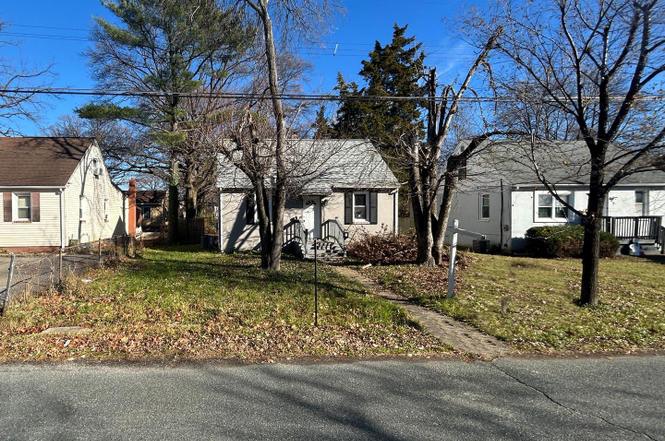
3 Vincent Ave · Essex, MD
Flood risk 7/10 · Major
- FEMA flood zone
- X (unshaded)
- Chance of flooding over 30 yrs
- 0.99%
- Est. flood insurance / yr
- $473 – $860
Fire risk 1/10 · Minimal
- Est. fire insurance / yr
- $755 – $1,403
Heat risk 8/10 · Major
- Hot days now (above 104°F)
- 7 days/yr
- Hot days in 30 yrs
- 15 days/yr
Wind risk 6/10 · Moderate
- Chance of severe wind over 30 yrs
- 47.0%
Air-quality risk 5/10 · Moderate
- Unhealthy air days now
- 6 days/yr
- Unhealthy air days in 30 yrs
- 8 days/yr
Risk factors via First Street. Map © Google.
Why this score? — see what drove the C+ grade
The composite is a weighted blend of 9 inputs, each scored 0–100. Each bar is that input's sub-score; the figure is the points it added to the 100-point composite (weight × sub-score).
- Cash flow +24.2/30.0
- ARV discount +15.0/15.0
- DSCR +7.8/10.0
- 1% rule +6.3/10.0
- Livability +4.0/5.0
- Rent growth +2.8/5.0
- Condition / age +2.5/5.0
- Schools +2.3/10.0
- Appreciation +0.0/10.0
$199,900
🖨 Deal sheet 📄 Offer letter ✓ Due diligence
Listing remarks
Discover this cape cod home with a blend of classic character and modern comfort in the community of Essex. With 1,344 square feet of thoughtfully designed space, this residence features four bedrooms and two full bathrooms, perfect for relaxation. Step inside to discover a warm and welcoming interior adorned with hardwood and carpet floors. The eat-in kitchen, equipped with stainless steel appliances, granite countertops and white cabinetry, invites culinary creativity and casual dining. Enjoy the convenience of a main floor laundry area, making daily chores a breeze. Outside, the property boasts a lovely 0.14-acre lot with a level yard, framed by mature trees that offer privacy and a touc
Key facts
- Level yard
- Cape cod home
- Eat-in kitchen
Tags
Property features AI
Exterior
- Parking: On-street parking (public, unassigned)
- Utilities: Public water; Public sewer; Electric available; Phone available
- Home design: Detached property; Level-entry main access
- Construction: Built (year source: assessor); Stucco, concrete, frame and vinyl siding combination; Asphalt roof; Crawl space and permanent foundation; Double-pane windows
- Exterior features: Sidewalks; Rear yard fencing; Front yard; Level lot with trees/wooded rear
Interior
- Kitchen: Stainless steel appliances; Eat-in kitchen with table space
- Bedrooms: Two main-level bedrooms; Two bedrooms on the first upper level
- Flooring: Hardwood; Carpet; Concrete; Tile/brick
- Bathrooms: Two full bathrooms (one on main level, one on first upper level)
- Heating & cooling: Central heating (electric); Central air conditioning (electric); Ceiling fans; 200+ amp electric service; Electric hot water
- Interior features: Tub/shower; Ceiling fans; Eat-in kitchen and table space; Tray ceilings; Drywall and paneled walls; Six-panel doors; Wood floors; Carpeted areas; Concrete and tile/brick surfaces; Level-entry main access
- Laundry & utility: Main-floor laundry
Neighborhood map
What this means for you Summary
Snapshot
- This is a 4-bed/2.0-bath single-family listed at $200k.
Deal economics
- At list price, monthly cash flow is $345 ($4k/yr) — positive.
- The deal already cash-flows at list — no discount required.
- Meets the 1% rule at list price ($2k rent vs $200k).
- Recommended offer: $182k (9.0% below list) — sets the bar for market timing.
- Cap rate 8.7% vs local median 4.8% in Essex — top-decile yield for the area; either an underpriced asset or a hidden risk that comps aren't pricing in. Stress-test before assuming the spread holds.
Location & tenants
- Location reads 79/100 on livability (#60 in MD, #2,277 nationally) — a middle-class / working-renter tenant base. Strengths: commute A+, housing A+, health & safety A; Watch: amenities D+, schools D, crime F.
- Baltimore County Public Schools (suburban): math 15% / reading 34% proficiency, ranked #11 of 24 in MD (top 46%) — low school quality limits family demand, transient renter base, plan for 1-2y turnover.
- Market conditions: Rents rising (+1.1%/yr); 138 active listings in the ZIP; 34 comparable units currently listed for rent nearby; rentals at typical pace (median 24d on market — plan ~3-4 weeks tenant-placement turnaround); 41% of comp listings sitting > 30 days — soft ceiling on asking rent; 1,511 units permitted in Baltimore County in 2024 (643 in 5+ unit buildings).
- This rent runs 40% of the median local income ($67k/yr) — at the standard rent-burdened threshold; future hikes will face affordability resistance.
Forward outlook
- Local home prices are declining (-3.0%/yr); year-one equity from $1k of loan paydown is wiped out by about $6k of value loss. Plan a longer hold.
- Baltimore County population projected at +12% by 2050 — modest demand growth; plan on rents tracking national, not racing it.
Negotiation context
- It's been on market 98 days — a 9% lower offer ($182k) is reasonable based on typical stale-listing flexibility.
- 19 sale attempts since 28y ago; this cycle's ask has dropped $30k (13%) from the opening price — seller is motivated, your offer sets the floor, not the list.
Risks & watch-outs
- Watch-outs: flood insurance adds $56/mo; built in 1937 — expect roof / HVAC / electrical / plumbing capex.
- Climate carrying-cost: major flood risk; major wind risk, 47% chance of damaging wind over 30y; extreme-heat days projected 7→15/yr by 2055 (HVAC capex compounding) — expect insurance premiums to compound above CPI over the hold.
Questions for the listing agent
- It's been on market 98 days. Have you received any prior offers? Is the seller open to a 9% concession, seller financing, or rate buy-down credit?
- Built in 1937 — when were the roof, HVAC, electrical panel, plumbing, and water heater last replaced?
- What's the actual annual flood-insurance premium (NFIP or private), and is the property in a SFHA with mandatory coverage?
- Why hasn't it sold? Are there any deal-killer items the seller is aware of (foundation, flood, title, zoning, code violations)?
- Is there a deadline driving the sale (1031 exchange, divorce, estate, relocation)? That informs how much negotiation room exists.
- Schools are D-rated, which usually means shorter tenancies and higher turnover. Who's the typical renter profile here, and what's been the actual vacancy rate?
- Crime grade is F in this area — have there been break-ins, vandalism, or insurance claims at this property in the last 3 years? What carrier currently insures it and at what premium?
- What's the average days-on-market for RENTAL listings here right now (not sales)? A rising rental-DOM trend means longer vacancies and softer asking-rent achievability than the comps imply.
- What's the recent tenant-quality profile in this submarket — average credit score on applications, eviction rate, late-payment / NSF rate, and stable-employment percentage? A property-management company in the area should have these aggregated.
- How much new for-sale + rental construction is in the pipeline within 1–3 miles? Heavy new supply typically softens prices + rents 12–24 months out; constrained supply supports both.
Investment metrics
- 1% rule
- 1.13% ✓
- Cap rate
- 8.69%
- Cash-on-cash
- 8.58%
- DSCR
- 1.38
- GRM
- 7.4
CMA / ARV
- ARV (on-the-fly)
- $292,992
- Comps found
- 5
Show comp detail 5 sales within ~0.75 mi
| Address | Dist | Beds/Ba | Sqft | Sold | Price | $/sf | Match |
|---|---|---|---|---|---|---|---|
| 705 Virginia Ave | 0.50mi | 3/2.0 (-1) | 1,352 (+1%) | 13mo | $341,000 | $252 | 60 |
| 948 Woodlynn Rd | 0.51mi | 4/1.5 | 1,422 (+6%) | 14mo | $310,000 | $218 | 52 |
| 920 Lance Ave | 0.59mi | 3/2.0 (-1) | 1,456 (+8%) | 13mo | $285,000 | $196 | 43 |
| 214 Stemmers Run Rd | 0.72mi | 3/2.0 (-1) | 1,440 (+7%) | 12mo | $274,000 | $190 | 39 |
| 741 Essex Ave | 0.63mi | 3/2.0 (-1) | 1,440 (+7%) | 22mo | $365,000 | $253 | 35 |
Match score weights: distance 35% · size 25% · config 20% · recency 20%. Top-matched comps best support the ARV.
Projected returns pro-forma
-3.0% appreciation · 1.08% rent growth · sell at horizon
- IRR
- -7.2%
- Equity multiple
- 0.74×
- Total profit
- $-14,664
- Equity at exit
- $29,806
- IRR
- -0.3%
- Equity multiple
- 0.98×
- Total profit
- $-1,153
- Equity at exit
- $17,284
Cash invested: $55,972 (down + closing). Projections, not guarantees.
Landlord ↔ Tenant lean methodology
- Overall (STATE)
- 27 Tenant-Leaning
- State Maryland
- 27 Tenant-Leaning · D+14
- County
- — inherits STATE
- City
- — inherits STATE
ZIP-level market 21221
- Rents YoY
- 1.1%
- Active inventory
- 138
- Price-to-rent
- 7.4×
Monthly cashflow live
- Estimated rent
- $2,263 high interval (Pro) →
- Mortgage (P&I)
- −$1,048
- Tax from tax record
- −$256 /mo · $3,072/yr
- Insurance
- −$83
- Flood insurance flood zone
- −$56 /mo · $666/yr
- HOA
- −$0
- Vacancy / Maint / Mgmt
- −$475
- Net cashflow
- $345
Break-even live
UW: 25.0% down · 7.5% · 30yr · 1.5% tax · 5.0% vac · 8.0% maint · 8.0% mgmt
Financing live
Cash to close
- Down payment
- $49,975
- Closing costs
- $5,997
- Reserves months
- —
- Total cash needed
- —
Loan-product check · same deal, 3 products live
Conventional
25% down · 7.5% · 30yr
- Down + closing
- —
- Monthly P&I
- —
- Monthly cashflow
- —
- DSCR
- —
- Eligible?
- —
Personal DTI + credit; lowest rate.
DSCR
20% down · 8.5% · 30yr
- Down + closing
- —
- Monthly P&I
- —
- Monthly cashflow
- —
- DSCR
- —
- Eligible?
- —
No personal income docs; deal must DSCR.
Hard money
10% down · 12.0% · 12mo
- Down + closing
- —
- Monthly P&I
- —
- Monthly cashflow
- —
- DSCR
- —
- Eligible?
- —
Short-term bridge; refi at stabilization.
Rent comps 34 comps
| Address | Beds | Baths | Sqft | Rent | $/sqft | DOM | Units | Dist |
|---|---|---|---|---|---|---|---|---|
| 54 Stemmers Run Rd Essex, MD | 3.0 | 2.5 | 1260 | $1,950 | $1.55 | 43d | 1 | 0.44mi |
| 706 Seawall Rd Essex, MD | 3.0 | 1.0 | 1114 | $1,900 | $1.71 | 5d | 1 | 0.60mi |
| 1402 Nicolay Way Unit 1 Essex, MD | 3.0 | 1.5 | 1432 | $1,925 | $1.34 | 5d | 1 | 0.70mi |
| 1402 Nicolay Way Essex, MD | 3.0 | 2.0 | 1432 | $1,925 | $1.34 | 3d | 1 | 0.70mi |
| 1409 Nicolay Way Essex, MD | 3.0 | 2.0 | 1008 | $1,950 | $1.93 | 5d | 1 | 0.73mi |
| 1043 Debbie Ave Essex, MD | 4.0 | 2.5 | 1860 | $2,300 | $1.24 | 12d | 1 | 0.75mi |
| 146 Marine Oaks Dr Essex, MD | 3.0 | 1.5 | 1516 | $2,700 | $1.78 | 23d | 1 | 0.77mi |
| 326 Stemmers Run Rd Essex, MD | 4.0 | 2.0 | 1144 | $2,300 | $2.01 | 43d | 1 | 0.80mi |
| 1710 Huber Rd Essex, MD | 3.0 | 2.5 | 1848 | $2,900 | $1.57 | 43d | 1 | 0.86mi |
| 421 Torner Rd Essex, MD | 3.0 | 2.0 | 1024 | $2,050 | $2.00 | 21d | 1 | 0.87mi |
| 39 Walkern Rd Essex, MD | 5.0 | 2.0 | 1682 | $2,350 | $1.40 | 43d | 1 | 0.87mi |
| 832 N Marlyn Ave Essex, MD | 3.0 | 2.0 | 1416 | $2,300 | $1.62 | 43d | 1 | 0.92mi |
| 1302 Sugarwood Cir #102 Essex, MD | 3.0 | 1.0 | 922 | $1,800 | $1.95 | 43d | 1 | 0.92mi |
| 28 Ebbing Ct Essex, MD | 3.0 | 2.5 | 1464 | $2,195 | $1.50 | 10d | 1 | 0.92mi |
| 406 Essexwood Ct Essex, MD | 3.0 | 2.5 | 1280 | $2,400 | $1.88 | 43d | 1 | 0.94mi |
| 233 Orville Rd Essex, MD | 3.0 | 2.0 | 1144 | $1,850 | $1.62 | 43d | 1 | 1.08mi |
| 1022 Foxwood Ln Essex, MD | 3.0 | 2.0 | 1152 | $2,200 | $1.91 | 16d | 1 | 1.10mi |
| 1005 Kayden Ln Essex, MD | 3.0 | 1.5 | 1152 | $2,200 | $1.91 | 43d | 1 | 1.17mi |
| 909 S Marlyn Ave Essex, MD | 2.0–3.0 | 1.0–1.5 | 888 | $1,775 | $2.00 | 5d | 1 | 1.19mi |
| 951 Bayner Rd Unit 951 Essex, MD | 3.0 | 2.0 | 1152 | $2,200 | $1.91 | 43d | 1 | 1.25mi |
| 511 Riverside Rd Essex, MD | 3.0 | 2.0 | 1332 | $2,700 | $2.03 | 16d | 1 | 1.32mi |
| 1112 Tace Dr Essex, MD | 3.0 | 1.0 | 1728 | $1,781 | $1.03 | 2d | 14 | 1.33mi |
| 433 Grovethorn Rd Middle River, MD | 3.0 | 2.0 | 1024 | $2,000 | $1.95 | 21d | 1 | 1.35mi |
| 60 S Hawthorne Rd Middle River, MD | 3.0 | 1.0 | 1234 | $2,250 | $1.82 | 43d | 1 | 1.35mi |
| 165 Hampshire Rd Essex, MD | 3.0 | 2.0 | 969 | $1,895 | $1.96 | 43d | 1 | 1.37mi |
| 47 S Hawthorne Rd Middle River, MD | 3.0 | 1.0 | 1024 | $1,900 | $1.86 | 23d | 1 | 1.38mi |
| 953 Walnut Grove Rd Essex, MD | 3.0 | 2.0–2.5 | 1600 | $2,115 | $1.32 | 1d | 18 | 1.39mi |
| 2125 Hawthorne Rd Middle River, MD | 3.0 | 2.0 | 1299 | $2,100 | $1.62 | 43d | 1 | 1.43mi |
| 120 Kingston Rd Middle River, MD | 3.0 | 2.0 | 1024 | $1,950 | $1.90 | 23d | 1 | 1.43mi |
| 2202 Firethorn Rd Middle River, MD | 3.0 | 2.5 | 1324 | $2,300 | $1.74 | 43d | 1 | 1.47mi |
| 2207 Firethorn Rd Middle River, MD | 3.0 | 1.5 | 1600 | $2,400 | $1.50 | 16d | 1 | 1.47mi |
| 2167 Graythorn Rd Middle River, MD | 3.0 | 1.5 | 1324 | $1,900 | $1.44 | 23d | 1 | 1.47mi |
| 2203 Redthorn Rd Middle River, MD | 3.0 | 2.0 | 1144 | $2,200 | $1.92 | 10d | 1 | 1.48mi |
| 2128 Cockspur Rd Middle River, MD | 3.0 | 1.5 | 1272 | $2,100 | $1.65 | 23d | 1 | 1.50mi |
Listing history 50 events
-
2026-04-29status Pending
-
2026-03-10price $199,900
-
2026-01-21$229,900 Active
-
2026-01-14soldstatus $230,000
-
2025-02-13historical
-
2024-12-31historical Active Under Contract
-
2024-12-19price $249,900
-
2024-12-10$255,000 Active
-
2022-09-20soldstatus $230,000
-
2022-05-04Active Under Contract
-
2022-05-04soldstatus $230,000 Closed
-
2022-04-22soldstatus $230,000 Closed
-
2022-03-18historical Active Under Contract
-
2022-03-14$224,900 Active
-
2022-03-07soldstatus $230,000 Closed
-
2022-02-07historical Active Under Contract
-
2022-01-28status Active
-
2022-01-09historical Active Under Contract
-
2022-01-03status Active
-
2021-12-31historical
-
2021-12-01status Active
-
2021-11-30historical
-
2021-11-18price $224,900
-
2021-11-12status Active
-
2021-11-05historical
-
2021-10-11price $229,900
-
2021-09-16price $237,400
-
2021-08-24status Active
-
2021-08-20historical Active Under Contract
-
2021-08-03status Active
-
2021-07-06historical
-
2021-06-10status Active
-
2021-05-28historical Active Under Contract
-
2021-05-17$239,900 Active
-
2019-04-17historical
-
2018-12-07price $207,500
-
2018-10-25$209,900 Active
-
2018-10-25historical
-
2018-09-14$219,900 Active
-
2018-07-11historical
-
2018-07-11historical Temporarily Off-Market
-
2018-05-05price $194,900
-
2018-05-05price
-
2018-03-14price $199,900
-
2018-03-14price
-
2018-03-14price $10,000
-
2018-03-14price
-
2018-02-05price
-
2017-11-20$209,900 Active
-
2017-11-20Active
ⓘ Source: listings_history table (triggers on properties + properties_extension) + one-shot
backfill from property_details.listing_events for pre-trigger history.
Tax reassessment forecast MD · Partial reset (capped growth)
- Current annual tax
- $3,072 · $256/mo
- Projected year-2 tax
- $3,072 · $256/mo
- Expected delta
- $0/yr ($0/mo · 0.0%)
ⓘ Screening estimate from a state-policy table — verify with the county assessor before closing.
Climate risk First Street
- Flood 7/10 Severe FEMA zone X (unshaded) · 99% chance over 30 yrs
- Wildfire 1/10 Low
- Heat 8/10 Severe 7 d/yr ≥104°F today · 15 d/yr by 30 yrs out
- Wind 6/10 Major 47% chance of damaging wind over 30 yrs
- Air quality 5/10 Major 6 unhealthy d/yr today · 8 by 30 yrs out
Nearby sold comps map
Loading sold comps map…
Walkable amenities ~0.75 mi
Loading nearby amenities…
Taxation est. · year 1
- Rental income
- $27,155
- − Mortgage interest
- −$11,198
- − Property taxes
- −$3,072
- − Insurance
- −$1,666
- − Repairs & maintenance
- −$2,172
- − Management
- −$2,172
- − Depreciation
- −$5,815
- Taxable income
- $1,059
- Est. tax owed @ 24.0%
- −$254
- After-tax cash flow
- $3,881/yr
For passive investors: Depreciation is non-cash, so a rental often shows a tax loss while cash-flowing — sheltering income. Rental losses are passive: they offset passive income freely, and up to $25,000/yr can offset ordinary (W-2) income if you actively participate and your MAGI is under $100k (phasing out to $0 by $150k); unused losses carry forward. On sale, claimed depreciation is recaptured at up to 25%, and gains may owe capital-gains tax (a 1031 exchange can defer both). Figures are a year-1 estimate at your 24.0% rate — not tax advice; consult a CPA.
Schools (NCES district)
- District
- Baltimore County Public Schools
- NCES district ID
- 2400120
- Math proficiency
- 15% ▼ -16.00%
- Reading proficiency
- 34% ▼ -5.00%
- Median HH income
- $66,746
- Composite
- 23.17/100
- National rank
- #7948
- State rank
- #11 of 24 in MD
Livability — Essex
- Score
- 79/100
- State rank
- #60
- US rank
- #2277
Category grades
Schools grade is shown separately in the Schools card above.
Census & demographics
- Census place
- Essex, MD
- County
- Baltimore County · 769,527 people
- City population
- 43,487
- Metro
- Baltimore-Columbia-Towson, MD
- Population (ZIP)
- 43,487
- Household income
- $67,340
- Rent vs Own
- Severe rent burden
- 1757.0
Population outlook (Baltimore County) Hauer SSP2
- Today (2025)
- 885,518 people
- By 2030
- 909,272 · +2.7%
- By 2040
- 951,547 · +7.5%
- By 2050
- 990,955 · +11.9%
- By 2075
- 1,086,411 · +22.7%
- By 2100
- 1,135,078 · +28.2%
Race, ethnicity, and origin ACS 2023
- Neighborhood character
- Diverse neighborhood (Simpson 0.60)
- Race & ethnicity
- White 54% Black 32% Two or more races 7% Hispanic / Latino 7% Asian 1%
- Hispanic origin (detail)
- Mexican 2% Puerto Rican 1% Dominican 1%
- Common ancestry
- Romanian 5% Lithuanian 1% Slovak 1%
- Foreign-born
- 8% · Canada, China
- Languages at home
- 89% English-only · Spanish 6% French/Haitian/Cajun 1%
Political lean MEDSL · Baltimore
- 2024 margin
- Strong D (+24.5) · D 61.0% · R 36.5% · Other 2.5%
- 2008→2024 swing
- +9.9pp toward D · 2008: 14.6pp · 2024: 24.5pp
- All cycles
- 2024: D+24.5 2020: D+27.0 2016: D+17.4 2012: D+16.4 2008: D+14.6
Not yet ingested
- Civics
- —
Market trends
- HPI YoY
- ▼ -232.14%
- Current HPI
- 237.1069
- Rent YoY
- ▲ 1.08%
- Metro
- Baltimore-Columbia-Towson, MD
- State GDP YoY
- ▲ 2.97%
- F500 in state
- 12
Industry mix (Fortune 500 HQ in MD)
| Industry | F500 HQs | Revenue |
|---|---|---|
| Aerospace / Defense | 1 | $71B |
|
||
| Utilities | 1 | $25B |
|
||
| Hotels | 1 | $24B |
|
||
| Consumer Goods | 1 | $7B |
|
||
| Real Estate | 1 | $6B |
|
||
| Chemicals | 1 | $2B |
|
||
Price history
+100.6% since first listed58 events — show timeline
- 2026-04-29 Pending — BRIGHT MLS
- 2026-03-10 Price Changed $199,900 BRIGHT MLS
- 2026-01-21 Listed $229,900 BRIGHT MLS
- 2026-01-14 Sold (Public Records) $230,000 Public Records
- 2025-02-13 Listing Removed — BRIGHT MLS
- 2024-12-31 Contingent — BRIGHT MLS
- 2024-12-19 Price Changed $249,900 BRIGHT MLS
- 2024-12-10 Listed $255,000 BRIGHT MLS
- 2022-09-20 Sold (Public Records) $230,000 Public Records
- 2022-05-04 Listed — BRIGHT MLS
- 2022-05-04 Sold (MLS) $230,000 BRIGHT MLS
- 2022-04-22 Sold (MLS) $230,000 BRIGHT MLS
- 2022-03-18 Contingent — BRIGHT MLS
- 2022-03-14 Listed $224,900 BRIGHT MLS
- 2022-03-07 Sold (MLS) $230,000 BRIGHT MLS
- 2022-02-07 Contingent — BRIGHT MLS
- 2022-01-28 Relisted — BRIGHT MLS
- 2022-01-09 Contingent — BRIGHT MLS
- 2022-01-03 Relisted — BRIGHT MLS
- 2021-12-31 Listing Removed — BRIGHT MLS
- 2021-12-01 Relisted — BRIGHT MLS
- 2021-11-30 Listing Removed — BRIGHT MLS
- 2021-11-18 Price Changed $224,900 BRIGHT MLS
- 2021-11-12 Relisted — BRIGHT MLS
- 2021-11-05 Listing Removed — BRIGHT MLS
- 2021-10-11 Price Changed $229,900 BRIGHT MLS
- 2021-09-16 Price Changed $237,400 BRIGHT MLS
- 2021-08-24 Relisted — BRIGHT MLS
- 2021-08-20 Contingent — BRIGHT MLS
- 2021-08-03 Relisted — BRIGHT MLS
- 2021-07-06 Listing Removed — BRIGHT MLS
- 2021-06-10 Relisted — BRIGHT MLS
- 2021-05-28 Contingent — BRIGHT MLS
- 2021-05-17 Listed $239,900 BRIGHT MLS
- 2019-04-17 Listing Removed — BRIGHT MLS
- 2018-12-07 Price Changed $207,500 BRIGHT MLS
- 2018-10-25 Listing Removed — BRIGHT MLS
- 2018-10-25 Listed $209,900 BRIGHT MLS
- 2018-09-14 Listed $219,900 BRIGHT MLS
- 2018-07-11 Delisted — MRIS
- 2018-07-11 Listing Removed — BRIGHT MLS
- 2018-05-05 Price Changed $194,900 BRIGHT MLS
- 2018-05-05 Price Changed — MRIS
- 2018-03-14 Price Changed $199,900 BRIGHT MLS
- 2018-03-14 Price Changed — MRIS
- 2018-03-14 Price Changed $10,000 BRIGHT MLS
- 2018-03-14 Price Changed — MRIS
- 2018-02-05 Price Changed — MRIS
- 2017-11-20 Listed — MRIS
- 2017-11-20 Listed $209,900 BRIGHT MLS
- 2000-08-15 Sold (Public Records) $99,600 Public Records
- 2000-06-30 Sold (MLS) $99,600 MRIS
- 2000-05-29 Delisted — MRIS
- 2000-01-07 Listed $99,650 MRIS
- 1999-12-13 Delisted — MRIS
- 1999-06-14 Listed — MRIS
- 1999-06-09 Delisted — MRIS
- 1998-12-10 Listed — MRIS
Property tax history
+2.8%/yrLatest (2025): $3,072 · +2.9% YoY. Source: county tax records.
Cash-flow waterfall
monthlySold comps — $/sqft
last 12 mo · ≤1 miLoading sold comps…