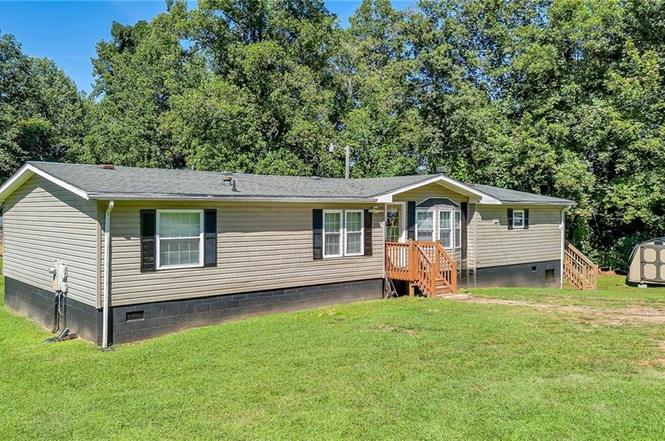
267 Uphill Ln · Wilkesboro, NC
Flood risk 1/10 · Minimal
- FEMA flood zone
- X (unshaded)
- Chance of flooding over 30 yrs
- 0.0%
- Est. flood insurance / yr
- $507 – $1,088
Fire risk 4/10 · Minor
- Est. fire insurance / yr
- $906 – $1,684
Heat risk 4/10 · Minor
- Hot days now (above 97°F)
- 7 days/yr
- Hot days in 30 yrs
- 18 days/yr
Wind risk 2/10 · Minimal
- Chance of severe wind over 30 yrs
- 1.0%
Air-quality risk 1/10 · Minimal
- Unhealthy air days now
- 0 days/yr
- Unhealthy air days in 30 yrs
- 0 days/yr
Risk factors via First Street. Map © Google.
Why this score? — see what drove the C grade
The composite is a weighted blend of 9 inputs, each scored 0–100. Each bar is that input's sub-score; the figure is the points it added to the 100-point composite (weight × sub-score).
- Cash flow +22.4/30.0
- Appreciation +7.7/10.0
- DSCR +7.2/10.0
- 1% rule +4.8/10.0
- Schools +4.3/10.0
- Livability +3.5/5.0
- ARV discount +3.2/15.0
- Rent growth +2.5/5.0
- Condition / age +2.5/5.0
$209,000
🖨 Deal sheet 📄 Offer letter ✓ Due diligence
Listing remarks
This beautifully updated home in Boomer, NC, is completely move-in ready! Recent upgrades include new windows, doors, flooring, tile, backsplash, fresh interior paint, vinyl siding, and a brand-new back deck. The spacious layout offers an open kitchen and a dedicated laundry room. Outside, the landscaping and gravel driveway are complete, making this home truly turn-key. Don’t miss your chance—schedule a showing today!
Key facts
- New doors
- New tile
- New flooring
Tags
Property features AI
Finance
- Financial info: Annual tax amount listed
- HOA & community: No homeowners association
Exterior
- Parking: Driveway with gravel surface
- Security: Deadbolt locks
- Utilities: Well water source; Septic sewer; Electric water heater; Electric power
- Home design: Manufactured home (manufactured house); One story
- Construction: Built in 1998; Block and vinyl siding construction
- Exterior features: 1 acre lot; Well water; Septic tank; No pool
Interior
- Kitchen: Built-in refrigerator; Dishwasher; Free-standing range
- Bedrooms: Primary bedroom on main level
- Flooring: Tile; See remarks
- Bathrooms: 2 full bathrooms
- Heating & cooling: Heat pump for heating and cooling; Electric heating fuel
- Interior features: Ceiling fans; Deadbolt locks; Kitchen island; Separate shower; Primary bedroom on main level
- Laundry & utility: Washer hookup; Dryer connection on main level; Electric water heater
Neighborhood map
What this means for you Summary
Snapshot
- This is a 3-bed/2.0-bath manufactured listed at $209k.
Deal economics
- At list price, monthly cash flow is $347 ($4k/yr) — positive.
- The deal already cash-flows at list — no discount required.
- To meet the 1% rule (rent ≥ 1% of price), the offer needs to be $205k (1.8% below list).
- Recommended offer: $184k (12.0% below list) — sets the bar for market timing.
- Cap rate 8.3% vs local median 2.4% in Wilkesboro — top-decile yield for the area; either an underpriced asset or a hidden risk that comps aren't pricing in. Stress-test before assuming the spread holds.
Location & tenants
- Location reads 69/100 on livability (#166 in NC) — a middle-class / working-renter tenant base. Strengths: cost of living A+, health & safety A+; Watch: schools D+, employment D, crime F.
- Wilkes County Schools (rural): math 55% / reading 50% proficiency, ranked #59 of 178 in NC (top 33%) — acceptable for families but not a draw, mixed tenant base, ~2y average lease.
- Market conditions: 29 active listings in the ZIP; 134 units permitted in Wilkes County in 2024 (0 in 5+ unit buildings).
Forward outlook
- In year one you build about $13k of equity ($1k loan paydown + $11k appreciation (5.3% local appreciation)).
- Wilkes County population projected at -18% by 2050 — secular population decline; favor cash flow + early exit over multi-decade hold.
- At projected returns (5.3% appreciation + 3.0% rent growth), your $59k cash investment doubles in ~4 years — after that, you're playing with house money.
- By year 3, paydown + projected appreciation supports a ~$31k cash-out refi (75% LTV) — recoverable capital for the next deal without selling this one.
Negotiation context
- It's been on market 227 days — a 12% lower offer ($184k) is reasonable based on typical stale-listing flexibility.
- 4 sale attempts; this cycle's ask has dropped $41k (16%) from the opening price — seller is motivated, your offer sets the floor, not the list.
Questions for the listing agent
- It's been on market 227 days. Have you received any prior offers? Is the seller open to a 12% concession, seller financing, or rate buy-down credit?
- Why hasn't it sold? Are there any deal-killer items the seller is aware of (foundation, flood, title, zoning, code violations)?
- Is there a deadline driving the sale (1031 exchange, divorce, estate, relocation)? That informs how much negotiation room exists.
- Schools are D-rated, which usually means shorter tenancies and higher turnover. Who's the typical renter profile here, and what's been the actual vacancy rate?
- Crime grade is F in this area — have there been break-ins, vandalism, or insurance claims at this property in the last 3 years? What carrier currently insures it and at what premium?
- What's the average days-on-market for RENTAL listings here right now (not sales)? A rising rental-DOM trend means longer vacancies and softer asking-rent achievability than the comps imply.
- What's the recent tenant-quality profile in this submarket — average credit score on applications, eviction rate, late-payment / NSF rate, and stable-employment percentage? A property-management company in the area should have these aggregated.
- How much new for-sale + rental construction is in the pipeline within 1–3 miles? Heavy new supply typically softens prices + rents 12–24 months out; constrained supply supports both.
Investment metrics
- 1% rule
- 0.98% ✗
- Cap rate
- 8.28%
- Cash-on-cash
- 7.11%
- DSCR
- 1.32
- GRM
- 8.5
CMA / ARV
- ARV (on-the-fly)
- $190,920
- Comps found
- 1
Show comp detail 1 sale within ~0.75 mi
| Address | Dist | Beds/Ba | Sqft | Sold | Price | $/sf | Match |
|---|---|---|---|---|---|---|---|
| 178 Bruno Ln | 0.47mi | 3/2.0 | 1,796 (+4%) | 16mo | $200,000 | $111 | 57 |
Match score weights: distance 35% · size 25% · config 20% · recency 20%. Top-matched comps best support the ARV.
Projected returns pro-forma
5.32% appreciation · 3.0% rent growth · sell at horizon
- IRR
- 19.7%
- Equity multiple
- 2.26×
- Total profit
- $73,993
- Equity at exit
- $122,503
- IRR
- 19.3%
- Equity multiple
- 4.47×
- Total profit
- $202,778
- Equity at exit
- $214,863
Cash invested: $58,520 (down + closing). Projections, not guarantees.
Landlord ↔ Tenant lean methodology
- Overall (STATE)
- 85 Strongly Landlord-Friendly
- State North Carolina
- 85 Strongly Landlord-Friendly · R+3
- County
- — inherits STATE
- City
- — inherits STATE
ZIP-level market 28606
- Home prices YoY
- 1.7%
- Active inventory
- 29
- Price-to-rent
- 8.5×
Monthly cashflow live
- Estimated rent
- $2,052 medium interval (Pro) →
- Mortgage (P&I)
- −$1,096
- Tax from tax record
- −$92 /mo · $1,101/yr
- Insurance
- −$87
- HOA
- −$0
- Vacancy / Maint / Mgmt
- −$431
- Net cashflow
- $347
Break-even live
UW: 25.0% down · 7.5% · 30yr · 1.5% tax · 5.0% vac · 8.0% maint · 8.0% mgmt
Financing live
Cash to close
- Down payment
- $52,250
- Closing costs
- $6,270
- Reserves months
- —
- Total cash needed
- —
Loan-product check · same deal, 3 products live
Conventional
25% down · 7.5% · 30yr
- Down + closing
- —
- Monthly P&I
- —
- Monthly cashflow
- —
- DSCR
- —
- Eligible?
- —
Personal DTI + credit; lowest rate.
DSCR
20% down · 8.5% · 30yr
- Down + closing
- —
- Monthly P&I
- —
- Monthly cashflow
- —
- DSCR
- —
- Eligible?
- —
No personal income docs; deal must DSCR.
Hard money
10% down · 12.0% · 12mo
- Down + closing
- —
- Monthly P&I
- —
- Monthly cashflow
- —
- DSCR
- —
- Eligible?
- —
Short-term bridge; refi at stabilization.
Listing history 25 events
-
2026-06-19days on market $209,000 Active 227 DOM
-
2026-06-18days on market $209,000 Active 226 DOM
-
2026-06-17days on market $209,000 Active 225 DOM
-
2026-06-16days on market $209,000 Active 224 DOM
-
2026-06-15days on market $209,000 Active 223 DOM
-
2026-06-14days on market $209,000 Active 221 DOM
-
2026-06-12days on market $209,000 Active 220 DOM
-
2026-06-09days on market $209,000 Active 217 DOM
-
2026-06-08days on market $209,000 Active 216 DOM
-
2026-06-07days on market $209,000 Active 215 DOM
-
2026-06-03days on market $209,000 Active 211 DOM
-
2026-06-02days on market $209,000 Active 210 DOM
-
2026-06-01days on market $209,000 Active 209 DOM
-
2026-05-31days on market $209,000 Active 208 DOM
-
2026-05-30days on market $209,000 Active 207 DOM
-
2026-04-16price $209,000
-
2026-04-09status Active
-
2026-03-28historical Due Diligence Period
-
2026-03-19status Active
-
2026-03-19price $215,000
-
2026-03-01historical
-
2025-12-02status Active
-
2025-10-24historical
-
2025-09-25price $225,000
-
2025-09-05$250,000 Active
ⓘ Source: listings_history table (triggers on properties + properties_extension) + one-shot
backfill from property_details.listing_events for pre-trigger history.
Tax reassessment forecast NC · Resets to sale price
- Current annual tax
- $1,101 · $92/mo
- Projected year-2 tax
- $1,714 · $143/mo
- Expected delta
- +$613/yr (+$51/mo · 55.6%)
ⓘ Screening estimate from a state-policy table — verify with the county assessor before closing.
Climate risk First Street
- Flood 1/10 Low FEMA zone X (unshaded) · 0% chance over 30 yrs
- Wildfire 4/10 Moderate
- Heat 4/10 Moderate 7 d/yr ≥97°F today · 18 d/yr by 30 yrs out
- Wind 2/10 Low 100% chance of damaging wind over 30 yrs
- Air quality 1/10 Low 0 unhealthy d/yr today · 0 by 30 yrs out
Nearby sold comps map
Loading sold comps map…
Walkable amenities ~0.75 mi
Loading nearby amenities…
Taxation est. · year 1
- Rental income
- $24,630
- − Mortgage interest
- −$11,707
- − Property taxes
- −$1,101
- − Insurance
- −$1,045
- − Repairs & maintenance
- −$1,970
- − Management
- −$1,970
- − Depreciation
- −$6,080
- Taxable income
- $755
- Est. tax owed @ 24.0%
- −$181
- After-tax cash flow
- $3,978/yr
For passive investors: Depreciation is non-cash, so a rental often shows a tax loss while cash-flowing — sheltering income. Rental losses are passive: they offset passive income freely, and up to $25,000/yr can offset ordinary (W-2) income if you actively participate and your MAGI is under $100k (phasing out to $0 by $150k); unused losses carry forward. On sale, claimed depreciation is recaptured at up to 25%, and gains may owe capital-gains tax (a 1031 exchange can defer both). Figures are a year-1 estimate at your 24.0% rate — not tax advice; consult a CPA.
Schools (NCES district)
- District
- Wilkes County Schools
- NCES district ID
- 3704950
- Math proficiency
- 55% ▲ 13.00%
- Reading proficiency
- 50% ▲ 5.00%
- Median HH income
- $34,538
- Composite
- 43.41/100
- National rank
- #3017
- State rank
- #59 of 178 in NC
Livability — Wilkesboro
- Score
- 69/100
- State rank
- #166
- US rank
- #8892
Category grades
Schools grade is shown separately in the Schools card above.
Census & demographics
- City population
- 13,412
- Population (ZIP)
- 1,743
Population outlook (Wilkes County) Hauer SSP2
- Today (2025)
- 66,349 people
- By 2030
- 64,411 · -2.9%
- By 2040
- 59,800 · -9.9%
- By 2050
- 54,770 · -17.5%
- By 2075
- 45,211 · -31.9%
- By 2100
- 36,956 · -44.3%
Race, ethnicity, and origin ACS 2023
- Neighborhood character
- Predominantly White (96%)
- Race & ethnicity
- White 96% Two or more races 3%
- Common ancestry
- Serbian 2% Romanian 1%
- Languages at home
- 99% English-only · German/W. Germanic 1%
Political lean MEDSL · Wilkes
- 2024 margin
- Solid R (+59.6) · D 19.9% · R 79.5%
- 2008→2024 swing
- -21.5pp toward R · 2008: -38.2pp · 2024: -59.6pp
- All cycles
- 2024: R+59.6 2020: R+56.6 2016: R+55.2 2012: R+42.7 2008: R+38.2
Not yet ingested
- Civics
- —
Market trends
- HPI YoY
- ▲ 5.32%
- Current HPI
- 318.0226
- Rent YoY
- —
- Metro
- —
- State GDP YoY
- ▲ 3.28%
- F500 in state
- 26
Industry mix (Fortune 500 HQ in NC)
| Industry | F500 HQs | Revenue |
|---|---|---|
| Financial Services | 2 | $213B |
|
||
| Retail | 2 | $95B |
|
||
| Industrial Conglomerate | 1 | $38B |
|
||
| Metals / Steel | 1 | $35B |
|
||
| Utilities | 1 | $30B |
|
||
| Industrial Machinery | 1 | $19B |
|
||
Price history
-16.4% since first listed10 events — show timeline
- 2026-04-16 Price Changed $209,000 Triad MLS
- 2026-04-09 Relisted — Triad MLS
- 2026-03-28 Contingent — Triad MLS
- 2026-03-19 Relisted — Triad MLS
- 2026-03-19 Price Changed $215,000 Triad MLS
- 2026-03-01 Delisted — Triad MLS
- 2025-12-02 Relisted — Triad MLS
- 2025-10-24 Delisted — Triad MLS
- 2025-09-25 Price Changed $225,000 Triad MLS
- 2025-09-05 Listed $250,000 Triad MLS
Property tax history
+42.4%/yrLatest (2025): $1,101 · +26.7% YoY. Source: county tax records.
Cash-flow waterfall
monthlySold comps — $/sqft
last 12 mo · ≤1 miLoading sold comps…