10488 Pierce St NE · Blaine, MN
Flood risk 1/10 · Minimal
- FEMA flood zone
- X (unshaded)
- Chance of flooding over 30 yrs
- 0.0%
- Est. flood insurance / yr
- $507 – $1,088
Fire risk 1/10 · Minimal
- Est. fire insurance / yr
- $888 – $1,650
Heat risk 2/10 · Minimal
- Hot days now (above 100°F)
- 7 days/yr
- Hot days in 30 yrs
- 14 days/yr
Wind risk 2/10 · Minimal
- Chance of severe wind over 30 yrs
- —
Air-quality risk 2/10 · Minimal
- Unhealthy air days now
- 2 days/yr
- Unhealthy air days in 30 yrs
- 2 days/yr
Risk factors via First Street. Map © Google.
Why this score? — see what drove the D grade
The composite is a weighted blend of 9 inputs, each scored 0–100. Each bar is that input's sub-score; the figure is the points it added to the 100-point composite (weight × sub-score).
- 1% rule +10.0/10.0
- ARV discount +7.5/15.0
- Cash flow +6.7/30.0
- Schools +4.7/10.0
- Condition / age +4.0/5.0
- Rent growth +3.7/5.0
- Livability +3.6/5.0
- DSCR +1.0/10.0
- Appreciation +0.0/10.0
$140,000
🖨 Deal sheet (PDF) 📄 Offer letter ✓ Due diligence
Listing remarks
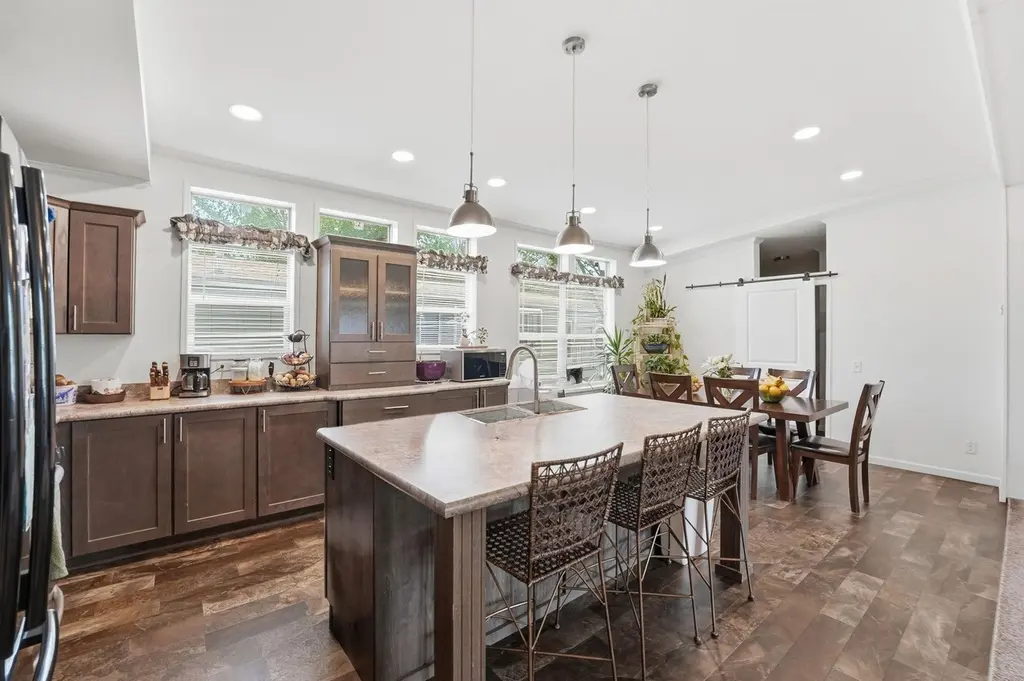
Come check out this recently manufactured 2019 home on a corner lot, immediately adjacent to the community park! This property has been wonderfully maintained by its original owners. The living room, kitchen, and dining area are all bathed in natural light, and intentionally designed for entertaining and hosting, when desired. The kitchen holds plenty of cabinetry, ventilation, and a large center island. The primary bedroom is situated on the opposite end of the other bedrooms, creating a clear separation of living. In one of the premier manufactured home communities in the state, Blaine Int'l is affordable and prioritizes your safety and comfort. Extra wide streets, a clubhouse, exercise f
Key facts
- Built 2019
- Listed 30 days
Property features AI
Finance
- HOA & community: Blaine International Village community; Monthly association fee of $1,050 (includes water and sewer); Land is leased with a monthly land lease of $1,050
Exterior
- Parking: Concrete parking (no garage or carport)
- Utilities: City water connected; City sewer connected; Natural gas
- Home design: Residential manufactured home; Single-story (one level); Entry level: Main
- Construction: Built on other foundation (foundation type: Other); Foundation dimensions approximately 50.25 x 25.42; Roof age 8 years or newer
- Exterior features: Vinyl exterior; Paved streets and private road frontage; association maintains the road; Other on-site structures
Interior
- Kitchen: Dishwasher; Microwave; Range; Refrigerator
- Bedrooms: 3 bedrooms (all on main level)
- Bathrooms: 2 full bathrooms, including a full primary bath on the main level
- Heating & cooling: Forced air heating; Central air conditioning
- Interior features: Kitchen/Dining room layout; Kitchen center island
- Laundry & utility: In-unit laundry with washer and dryer; Gas water heater
Neighborhood map
What this means for you Summary
Snapshot
- This is a 3-bed/2.0-bath manufactured listed at $140k. Condition is rated good.
Deal economics
- At list price, monthly cash flow is $-222 ($-3k/yr) — negative.
- To cash-flow at today's rent, offer at most $101k (28.0% below list).
- Meets the 1% rule at list price ($2k rent vs $140k).
- Recommended offer: $101k (28.0% below list) — sets the bar for cash-flow.
Location & tenants
- Location reads 71/100 on livability (#315 in MN) — a middle-class / working-renter tenant base. Strengths: employment A+, housing A+, crime A; Watch: amenities F, commute F.
- Anoka-Hennepin Public School District (suburban): math 49% / reading 55% proficiency, ranked #71 of 301 in MN (top 24%) — acceptable for families but not a draw, mixed tenant base, ~2y average lease.
- Zoned schools: Madison Elementary (math 57% / reading 62%, grade B-, #216 of 857 statewide, top 29%, 407 students, 55% FRL); Northdale Middle (math 40% / reading 55%, grade C-, #93 of 258 statewide, top 37%, 1,274 students, 46% FRL); Blaine High School (math 46% / reading 67%, grade C, #77 of 471 statewide, top 17%, 2,969 students, 37% FRL) — zoned schools average 46% FRL vs 24% district-wide (21 pts higher); higher-poverty schools than district average — tighter screening recommended.
- Market conditions: Rents rising fast (+4.8%/yr); 114 active listings in the ZIP; 7 comparable units currently listed for rent nearby; rentals leasing fast (median 14d on market — plan ~1-2 weeks tenant-placement turnaround); solid renter incomes; 1,083 units permitted in Anoka County in 2024 (134 in 5+ unit buildings).
Forward outlook
- Local home prices are declining (-3.0%/yr); year-one equity from $968 of loan paydown is wiped out by about $4k of value loss. Plan a longer hold.
- Anoka County population projected at +11% by 2050 — modest demand growth; plan on rents tracking national, not racing it.
Negotiation context
- It's been on market 31 days — a 3% lower offer ($136k) is reasonable based on typical stale-listing flexibility.
Risks & watch-outs
- Watch-outs: HOA is 49% of rent.
Questions for the listing agent
- What do current leases actually rent for vs. the listed asking? Can we see a recent rent roll and the last 12 months of T-12 income?
- It's been on market 31 days. Have you received any prior offers? Is the seller open to a 28% concession, seller financing, or rate buy-down credit?
- What does the HOA fee cover, when was the last increase, and are there any pending special assessments or reserve-fund shortfalls?
- Is there a deadline driving the sale (1031 exchange, divorce, estate, relocation)? That informs how much negotiation room exists.
- Schools are B-rated — typically a magnet for longer-tenancy family renters. What's the average tenant stay here, and is there a school-zone premium baked into asking?
- The area grade is low — what's the realistic commute time and amenity access for the typical tenant pool here? Any planned neighborhood developments (good or bad) we should know about?
- What's the average days-on-market for RENTAL listings here right now (not sales)? A rising rental-DOM trend means longer vacancies and softer asking-rent achievability than the comps imply.
- What's the recent tenant-quality profile in this submarket — average credit score on applications, eviction rate, late-payment / NSF rate, and stable-employment percentage? A property-management company in the area should have these aggregated.
- How much new for-sale + rental construction is in the pipeline within 1–3 miles? Heavy new supply typically softens prices + rents 12–24 months out; constrained supply supports both.
Investment metrics
- 1% rule
- 1.54% ✓
- Cap rate
- 4.39%
- Cash-on-cash
- -6.78%
- DSCR
- 0.70
- GRM
- 5.4
CMA / ARV
No comps found within radius.
Projected returns pro-forma
-3.0% appreciation · 4.79% rent growth · sell at horizon
- IRR
- -23.1%
- Equity multiple
- 0.18×
- Total profit
- $-32,219
- Equity at exit
- $20,874
- IRR
- -9.5%
- Equity multiple
- 0.31×
- Total profit
- $-26,859
- Equity at exit
- $12,105
Cash invested: $39,200 (down + closing). Projections, not guarantees.
Landlord ↔ Tenant lean methodology
- Overall (STATE)
- 46 Balanced
- State Minnesota
- 46 Balanced · D+2
- County
- — inherits STATE
- City
- — inherits STATE
ZIP-level market 55434
- Rents YoY
- 4.8%
- Active inventory
- 114
- Price-to-rent
- 5.4×
Monthly cashflow live
- Estimated rent
- $2,158 high interval (Pro) →
- Mortgage (P&I)
- −$734
- Tax from tax record
- −$84 /mo · $1,009/yr
- Insurance
- −$58
- HOA
- −$1,050
- Vacancy / Maint / Mgmt
- −$453
- Net cashflow
- $-222
Break-even live
Sensitivity live
| Price | -10% $-142 | -5% $-182 | +0% $-222 | +5% $-261 | +10% $-301 |
|---|---|---|---|---|---|
| Rent | -10% $-392 | -5% $-307 | +0% $-222 | +5% $-136 | +10% $-51 |
| Rate | -1.0pp $-151 | -0.5pp $-186 | base $-222 | +0.5pp $-258 | +1.0pp $-295 |
UW: 25.0% down · 7.5% · 30yr · 1.5% tax · 5.0% vac · 8.0% maint · 8.0% mgmt
Financing live
Cash to close
- Down payment
- $35,000
- Closing costs
- $4,200
- Reserves months
- —
- Total cash needed
- —
Loan-product check · same deal, 3 products live
Conventional
25% down · 7.5% · 30yr
- Down + closing
- —
- Monthly P&I
- —
- Monthly cashflow
- —
- DSCR
- —
- Eligible?
- —
Personal DTI + credit; lowest rate.
DSCR
20% down · 8.5% · 30yr
- Down + closing
- —
- Monthly P&I
- —
- Monthly cashflow
- —
- DSCR
- —
- Eligible?
- —
No personal income docs; deal must DSCR.
Hard money
10% down · 12.0% · 12mo
- Down + closing
- —
- Monthly P&I
- —
- Monthly cashflow
- —
- DSCR
- —
- Eligible?
- —
Short-term bridge; refi at stabilization.
Rent comps 7 comps
| Address | Beds | Baths | Sqft | Rent | $/sqft | DOM | Units | Dist |
|---|---|---|---|---|---|---|---|---|
| 1509 111th Dr NE Unit D Minneapolis, MN | 3.0 | 3.0 | 1792 | $2,500 | $1.40 | 3d | 1 | 0.91mi |
| 1509 111th Dr NE Unit D Minneapolis, MN | 3.0 | 3.0 | 1800 | $2,500 | $1.39 | 13d | 1 | 0.91mi |
| 249 99th Ave NE Unit 241-107 Blaine, MN | 2.0 | 1.0 | 875 | $1,445 | $1.65 | 45d | 1 | 1.16mi |
| 249 99th Ave NE Unit 241-307 Blaine, MN | 2.0 | 1.0 | 875 | $1,445 | $1.65 | 21d | 1 | 1.16mi |
| 249 99th Ave NE Unit 249-308 Blaine, MN | 2.0 | 1.0 | 875 | $1,430 | $1.63 | 45d | 1 | 1.16mi |
| 9436 Ulysses St NE Minneapolis, MN | 2.0 | 1.0–2.0 | 775 | $2,095 | $2.70 | 0d | 10 | 1.23mi |
| 9460 Ulysses St NE Blaine, MN | 2.0 | 1.0–2.0 | 846 | $2,294 | $2.71 | 0d | 6 | 1.24mi |
HOA detail
- Monthly dues
- $1,050 · $12,600/yr
Listing history 18 events
-
2026-06-21days on market $140,000 Active 31 DOM
-
2026-06-18days on market $140,000 Active 28 DOM
-
2026-06-17days on market $140,000 Active 27 DOM
-
2026-06-16days on market $140,000 Active 26 DOM
-
2026-06-15days on market $140,000 Active 25 DOM
-
2026-06-13days on market $140,000 Active 23 DOM
-
2026-06-13days on market $140,000 Active 22 DOM
-
2026-06-09days on market $140,000 Active 19 DOM
-
2026-06-08days on market $140,000 Active 18 DOM
-
2026-06-07days on market $140,000 Active 17 DOM
-
2026-06-04days on market $140,000 Active 14 DOM
-
2026-06-03days on market $140,000 Active 13 DOM
-
2026-06-02days on market $140,000 Active 12 DOM
-
2026-06-02price $140,000 Active 11 DOM
-
2026-06-01days on market $150,000 Active 11 DOM
-
2026-05-31days on market $150,000 Active 10 DOM
-
2026-05-22$150,000 Active
-
2026-05-20historical $150,000
ⓘ Source: listings_history table (triggers on properties + properties_extension) + one-shot
backfill from property_details.listing_events for pre-trigger history.
Tax reassessment forecast MN · Partial reset (capped growth)
- Current annual tax
- $1,009 · $84/mo
- Projected year-2 tax
- $1,288 · $107/mo
- Expected delta
- +$280/yr (+$23/mo · 27.7%)
ⓘ Screening estimate from a state-policy table — verify with the county assessor before closing.
Climate risk First Street
- Flood 1/10 Low FEMA zone X (unshaded) · 0% chance over 30 yrs
- Wildfire 1/10 Low
- Heat 2/10 Low 7 d/yr ≥100°F today · 14 d/yr by 30 yrs out
- Wind 2/10 Low
- Air quality 2/10 Low 2 unhealthy d/yr today · 2 by 30 yrs out
Nearby sold comps map
Loading sold comps map…
Walkable amenities ~0.75 mi
Loading nearby amenities…
Taxation est. · year 1
- Rental income
- $25,899
- − Mortgage interest
- −$7,842
- − Property taxes
- −$1,009
- − Insurance
- −$700
- − Repairs & maintenance
- −$2,072
- − Management
- −$2,072
- − HOA
- −$12,600
- − Depreciation
- −$4,073
- Taxable loss
- −$4,469
- Est. tax savings @ 24.0%
- +$1,072
- After-tax cash flow
- $-1,586/yr
For passive investors: Depreciation is non-cash, so a rental often shows a tax loss while cash-flowing — sheltering income. Rental losses are passive: they offset passive income freely, and up to $25,000/yr can offset ordinary (W-2) income if you actively participate and your MAGI is under $100k (phasing out to $0 by $150k); unused losses carry forward. On sale, claimed depreciation is recaptured at up to 25%, and gains may owe capital-gains tax (a 1031 exchange can defer both). Figures are a year-1 estimate at your 24.0% rate — not tax advice; consult a CPA.
Condition & rehab AI · 12 photos
This 2019 manufactured home is in excellent condition with modern updates and a well-maintained exterior. It's move-in ready and would benefit from landscaping and painting to further enhance its value.
Value-add opportunities
- Both landscaping — enhances curb appeal and adds value
- Both painting — refreshes interior and exterior
- Both HVAC maintenance — improves comfort and energy efficiency
Renovation cost estimate screening
Value-add ROI direction
- Both landscaping — enhances curb appeal and adds value ↑
- Both painting — refreshes interior and exterior ↑
- Both HVAC maintenance — improves comfort and energy efficiency ↑
ⓘ Cost ranges are severity-bucket heuristics (US national rule-of-thumb). Get contractor quotes + a written scope before underwriting a rehab budget.
Schools (NCES district)
- District
- Anoka-Hennepin Public School District
- NCES district ID
- 2703180
- Math proficiency
- 49% ▼ -14.00%
- Reading proficiency
- 55% ▼ -10.00%
- Median HH income
- $73,837
- Composite
- 46.7/100
- National rank
- #2400
- State rank
- #71 of 301 in MN
Livability — Blaine
- Score
- 71/100
- State rank
- #315
- US rank
- #7073
Category grades
Schools grade is shown separately in the Schools card above.
Census & demographics
- Census place
- Blaine, MN
- County
- Anoka County · 277,116 people
- City population
- 67,472
- Metro
- Minneapolis-St. Paul-Bloomington, MN-WI
- Population (ZIP)
- 33,029
- Household income
- $90,336
- Rent vs Own
- Severe rent burden
- 526.0
Population outlook (Anoka County) Hauer SSP2
- Today (2025)
- 375,223 people
- By 2030
- 387,850 · +3.4%
- By 2040
- 407,239 · +8.5%
- By 2050
- 417,541 · +11.3%
- By 2075
- 448,447 · +19.5%
- By 2100
- 464,954 · +23.9%
Race, ethnicity, and origin ACS 2023
- Neighborhood character
- Predominantly White (69%)
- Race & ethnicity
- White 69% Asian 10% Black 9% Two or more races 8% Hispanic / Latino 6%
- Hispanic origin (detail)
- Mexican 4%
- Common ancestry
- Portuguese 10% Romanian 5% Italian 2%
- Foreign-born
- 15% · Canada, Vietnam, China
- Languages at home
- 79% English-only · Spanish 5% Other Asian/Pacific 2% Vietnamese 2%
Political lean MEDSL · Anoka
- 2024 margin
- Toss-up / Even · D 46.6% · R 51.0% · Other 2.4%
- 2008→2024 swing
- -2.0pp toward R · 2008: -2.4pp · 2024: -4.4pp
- All cycles
- 2024: R+4.4 2020: R+1.9 2016: R+9.7 2012: R+2.6 2008: R+2.4
Not yet ingested
- Civics
- —
Market trends
- HPI YoY
- ▼ -230.62%
- Current HPI
- 254.0422
- Rent YoY
- ▲ 4.79%
- Metro
- Minneapolis-St. Paul-Bloomington, MN-WI
- State GDP YoY
- ▲ 2.41%
- F500 in state
- 34
Industry mix (Fortune 500 HQ in MN)
| Industry | F500 HQs | Revenue |
|---|---|---|
| Healthcare | 2 | $407B |
|
||
| Retail | 2 | $150B |
|
||
| Consumer Goods | 2 | $32B |
|
||
| Industrial Machinery | 2 | $6B |
|
||
| Agriculture | 1 | $40B |
|
||
| Healthcare / Medical Devices | 1 | $32B |
|
||
Price history
+0.0% since first listed2 events — show timeline
- 2026-05-22 Listed $150,000 NORTHSTARMLS as Distributed by MLS Grid
- 2026-05-20 Coming Soon $150,000 NORTHSTARMLS as Distributed by MLS Grid
Property tax history
+2.5%/yrLatest (2026): $1,009 · -11.7% YoY. Source: county tax records.
Cash-flow waterfall
monthlySold comps — $/sqft
last 12 mo · ≤1 miLoading sold comps…