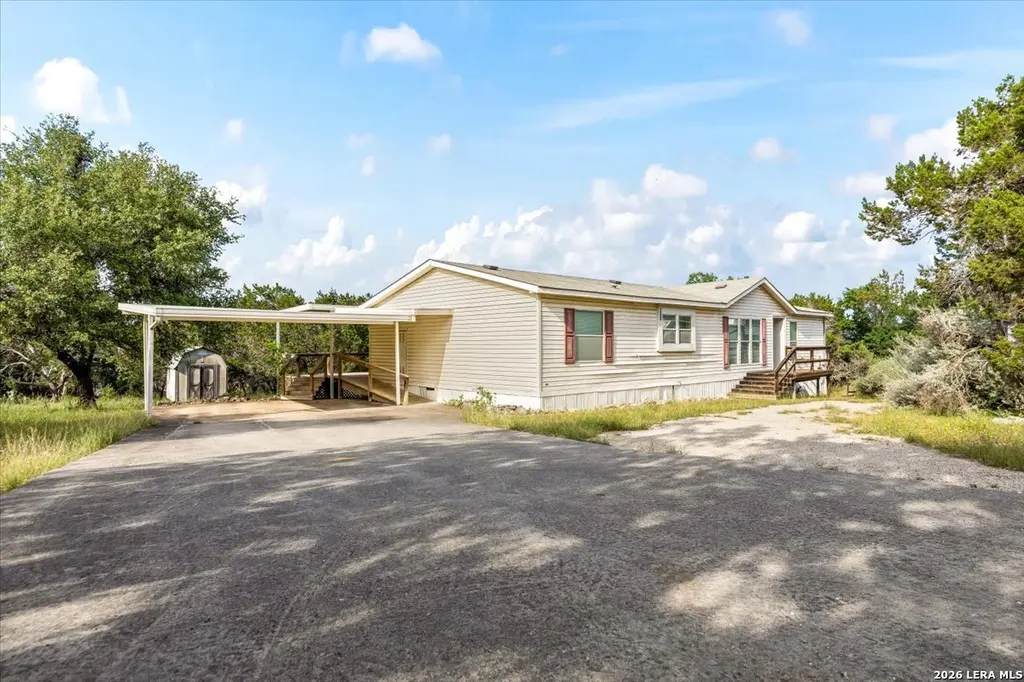
611 Hedgestone · Canyon Lake, TX
Flood risk 1/10 · Minimal
- FEMA flood zone
- X (unshaded)
- Chance of flooding over 30 yrs
- 0.0%
- Est. flood insurance / yr
- $507 – $1,088
Fire risk 4/10 · Minor
- Est. fire insurance / yr
- $1,222 – $2,270
Heat risk 8/10 · Major
- Hot days now (above 107°F)
- 7 days/yr
- Hot days in 30 yrs
- 22 days/yr
Wind risk 6/10 · Moderate
- Chance of severe wind over 30 yrs
- 68.0%
Air-quality risk 2/10 · Minimal
- Unhealthy air days now
- 0 days/yr
- Unhealthy air days in 30 yrs
- 1 days/yr
Risk factors via First Street. Map © Google.
Why this score? — see what drove the C grade
The composite is a weighted blend of 9 inputs, each scored 0–100. Each bar is that input's sub-score; the figure is the points it added to the 100-point composite (weight × sub-score).
- Cash flow +22.9/30.0
- ARV discount +7.5/15.0
- DSCR +7.4/10.0
- Schools +5.2/10.0
- 1% rule +5.1/10.0
- Livability +3.4/5.0
- Condition / age +2.5/5.0
- Rent growth +2.2/5.0
- Appreciation +0.0/10.0
$199,900
🖨 Deal sheet 📄 Offer letter ✓ Due diligence
Listing remarks
WOW! Private oversized lot in a great Canyon Lake location. Surrounded by mature oak trees & Peaceful Texas Hill Country feel yet close to restaurants, grocery stores, medical offices & everyday conveniences. Recently updated HVAC, New Roof in 2022, 2 storage sheds, spacious back porch, ramp access & luxury walk-in shower. Plenty of room to relax, entertain & make it your own. Enjoy the breezes, privacy & Hill Country lifestyle this property offers.
Key facts
- Mature oak trees
- Spacious back porch
- 2 storage sheds
Tags
Property features AI
Finance
- Other: Subdivision: TANGLEWOOD SHORES
- Financial info: Down payment resource not available
- HOA & community: Mandatory HOA with $24 annual fee; Association transfer fee of $175; Subdivision amenities include a pool and playground
Exterior
- Parking: Details not provided
- Security: Details not provided
- Utilities: City water; Septic system; Water system available
- Home design: Pre-owned single-family residence; Accessible/adaptive home; Bathroom on first floor; Bedroom on first floor; Ramp to main level
- Construction: Approximately 30 years old; Siding exterior; Composition roof; Other foundation (see remarks)
- Exterior features: Covered patio; Deck/balcony; Mature trees / partially wooded; Storm doors; Ramped entrance
Interior
- Kitchen: Kitchen (13 x 13); Stove/Range; Microwave; Dishwasher
- Bedrooms: Master bedroom on lower level with walk-in closet (14 x 13); Bedroom 2 (9 x 14); Bedroom 3 (14 x 13)
- Flooring: Carpeting; Vinyl flooring; Laminate flooring
- Bathrooms: 2 full bathrooms; Master bath with separate tub and shower and double vanity; Grab bars in bathroom(s); Stall shower
- Heating & cooling: Central heating (electric); Central air conditioning
- Interior features: Ceiling fans; Living/Dining room combination; Utility room inside; Ground level / no steps; All bedrooms on main/lower level; Walk-in closets; All window coverings remain; Smoke alarm
- Laundry & utility: Laundry on main level / utility room inside; Washer connection; Dryer connection
Neighborhood map
What this means for you Summary
Snapshot
- This is a 3-bed/2.0-bath manufactured listed at $200k.
Deal economics
- At list price, monthly cash flow is $351 ($4k/yr) — positive.
- The deal already cash-flows at list — no discount required.
- Meets the 1% rule at list price ($2k rent vs $200k).
- Recommended offer: $197k (1.5% below list) — sets the bar for market timing.
- Cap rate 8.4% vs local median 2.3% in Canyon Lake — top-decile yield for the area; either an underpriced asset or a hidden risk that comps aren't pricing in. Stress-test before assuming the spread holds.
Location & tenants
- Location reads 67/100 on livability (#534 in TX) — a middle-class / working-renter tenant base. Strengths: employment A+, housing A+, cost of living A; Watch: amenities F, commute F, health & safety F.
- Comal ISD (rural): math 57% / reading 59% proficiency, ranked #58 of 826 in TX (top 7%) — acceptable for families but not a draw, mixed tenant base, ~2y average lease.
- Zoned schools: Rebecca Creek El (math 55% / reading 52%, grade C, #686 of 4,322 statewide, top 16%, 605 students, 51% FRL); Canyon Lake H S (math 46% / reading 56%, grade D+, #482 of 1,632 statewide, top 30%, 1,038 students, 37% FRL).
- Market conditions: Rents soft (-1.2%/yr); 1014 active listings in the ZIP; 10 comparable units currently listed for rent nearby; rentals lingering (median 44d on market — plan ~5-8 weeks vacancy on turnover, expect pricing pressure); 50% of comp listings sitting > 30 days — soft ceiling on asking rent; solid renter incomes; 3,420 units permitted in Comal County in 2024 (1,164 in 5+ unit buildings).
Forward outlook
- Local home prices are declining (-3.0%/yr); year-one equity from $1k of loan paydown is wiped out by about $6k of value loss. Plan a longer hold.
- Comal County population projected at +70% by 2050 — long-run rental-demand tailwind backs the buy-and-hold thesis.
Negotiation context
- It's been on market 28 days — a 2% lower offer ($197k) is reasonable based on typical stale-listing flexibility.
Risks & watch-outs
- Climate carrying-cost: major wind risk, 68% chance of damaging wind over 30y; extreme-heat days projected 7→22/yr by 2055 (HVAC capex compounding) — expect insurance premiums to compound above CPI over the hold.
Questions for the listing agent
- What does the HOA fee cover, when was the last increase, and are there any pending special assessments or reserve-fund shortfalls?
- Is there a deadline driving the sale (1031 exchange, divorce, estate, relocation)? That informs how much negotiation room exists.
- What's the average days-on-market for RENTAL listings here right now (not sales)? A rising rental-DOM trend means longer vacancies and softer asking-rent achievability than the comps imply.
- What's the recent tenant-quality profile in this submarket — average credit score on applications, eviction rate, late-payment / NSF rate, and stable-employment percentage? A property-management company in the area should have these aggregated.
- How much new for-sale + rental construction is in the pipeline within 1–3 miles? Heavy new supply typically softens prices + rents 12–24 months out; constrained supply supports both.
Investment metrics
- 1% rule
- 1.01% ✓
- Cap rate
- 8.40%
- Cash-on-cash
- 7.53%
- DSCR
- 1.34
- GRM
- 8.3
CMA / ARV
No comps found within radius.
Projected returns pro-forma
-3.0% appreciation · 0.0% rent growth · sell at horizon
- IRR
- -8.0%
- Equity multiple
- 0.71×
- Total profit
- $-15,993
- Equity at exit
- $29,806
- IRR
- -2.5%
- Equity multiple
- 0.85×
- Total profit
- $-8,206
- Equity at exit
- $17,284
Cash invested: $55,972 (down + closing). Projections, not guarantees.
Landlord ↔ Tenant lean methodology
- Overall (STATE)
- 87 Strongly Landlord-Friendly
- State Texas
- 87 Strongly Landlord-Friendly · R+5
- County
- — inherits STATE
- City
- — inherits STATE
ZIP-level market 78133
- Home prices YoY
- -33.8%
- Rents YoY
- -1.2%
- Active inventory
- 1014
- Price-to-rent
- 8.3×
Monthly cashflow live
- Estimated rent
- $2,019 high interval (Pro) →
- Mortgage (P&I)
- −$1,048
- Tax from tax record
- −$110 /mo · $1,318/yr
- Insurance
- −$83
- HOA
- −$2
- Vacancy / Maint / Mgmt
- −$424
- Net cashflow
- $351
Break-even live
UW: 25.0% down · 7.5% · 30yr · 1.5% tax · 5.0% vac · 8.0% maint · 8.0% mgmt
Financing live
Cash to close
- Down payment
- $49,975
- Closing costs
- $5,997
- Reserves months
- —
- Total cash needed
- —
Loan-product check · same deal, 3 products live
Conventional
25% down · 7.5% · 30yr
- Down + closing
- —
- Monthly P&I
- —
- Monthly cashflow
- —
- DSCR
- —
- Eligible?
- —
Personal DTI + credit; lowest rate.
DSCR
20% down · 8.5% · 30yr
- Down + closing
- —
- Monthly P&I
- —
- Monthly cashflow
- —
- DSCR
- —
- Eligible?
- —
No personal income docs; deal must DSCR.
Hard money
10% down · 12.0% · 12mo
- Down + closing
- —
- Monthly P&I
- —
- Monthly cashflow
- —
- DSCR
- —
- Eligible?
- —
Short-term bridge; refi at stabilization.
Rent comps 10 comps
| Address | Beds | Baths | Sqft | Rent | $/sqft | DOM | Units | Dist |
|---|---|---|---|---|---|---|---|---|
| 578 Misty Glen Dr Canyon Lake, TX | 3.0 | 2.0 | 1277 | $1,850 | $1.45 | 12d | 1 | 0.13mi |
| 1123 Hedgestone Canyon Lake, TX | 3.0 | 2.0 | 1344 | $1,450 | $1.08 | 23d | 1 | 0.33mi |
| 1660 McIver Canyon Lake, TX | 3.0 | 2.5 | 1378 | $3,450 | $2.50 | 43d | 1 | 0.37mi |
| 2121 Fuller Dr Canyon Lake, TX | 3.0 | 1.0 | 1130 | $1,550 | $1.37 | 43d | 1 | 1.00mi |
| 1200 Willow Dr Canyon Lake, TX | 2.0 | 2.5 | 1360 | $1,875 | $1.38 | 43d | 1 | 1.19mi |
| 1285 Live Oak Dr Canyon Lake, TX | 3.0 | 2.0 | 1314 | $1,795 | $1.37 | 43d | 1 | 1.24mi |
| 537 Tamarack Dr Canyon Lake, TX | 3.0 | 1.0 | 1357 | $1,820 | $1.34 | 4d | 1 | 1.29mi |
| 691 Tamarack Dr Canyon Lake, TX | 3.0 | 2.0 | 1659 | $1,495 | $0.90 | 23d | 1 | 1.32mi |
| 1251 Canyon Shrs Unit 1 Canyon Lake, TX | 3.0 | 2.0 | 1300 | $1,800 | $1.38 | 23d | 1 | 1.47mi |
| 1251 Canyon Shrs Canyon Lake, TX | 3.0 | 2.0 | 1300 | $1,800 | $1.38 | 43d | 1 | 1.47mi |
HOA detail
- Monthly dues
- $2 · $24/yr
Listing history 15 events
-
2026-06-18days on market $199,900 Active 28 DOM
-
2026-06-17days on market $199,900 Active 27 DOM
-
2026-06-16days on market $199,900 Active 26 DOM
-
2026-06-15days on market $199,900 Active 25 DOM
-
2026-06-13days on market $199,900 Active 23 DOM
-
2026-06-09days on market $199,900 Active 19 DOM
-
2026-06-08days on market $199,900 Active 18 DOM
-
2026-06-07days on market $199,900 Active 17 DOM
-
2026-06-04days on market $199,900 Active 14 DOM
-
2026-06-03days on market $199,900 Active 13 DOM
-
2026-06-02days on market $199,900 Active 12 DOM
-
2026-06-01statusdays on market $199,900 Active 11 DOM
-
2026-05-31days on market $199,900 New 10 DOM
-
2026-05-21$199,900 New
-
1994-11-22soldstatus
ⓘ Source: listings_history table (triggers on properties + properties_extension) + one-shot
backfill from property_details.listing_events for pre-trigger history.
Tax reassessment forecast TX · Resets to sale price
- Current annual tax
- $1,318 · $110/mo
- Projected year-2 tax
- $3,658 · $305/mo
- Expected delta
- +$2,340/yr (+$195/mo · 177.5%)
ⓘ Screening estimate from a state-policy table — verify with the county assessor before closing.
Climate risk First Street
- Flood 1/10 Low FEMA zone X (unshaded) · 0% chance over 30 yrs
- Wildfire 4/10 Moderate
- Heat 8/10 Severe 7 d/yr ≥107°F today · 22 d/yr by 30 yrs out
- Wind 6/10 Major 68% chance of damaging wind over 30 yrs
- Air quality 2/10 Low 0 unhealthy d/yr today · 1 by 30 yrs out
Nearby sold comps map
Loading sold comps map…
Walkable amenities ~0.75 mi
Loading nearby amenities…
Taxation est. · year 1
- Rental income
- $24,223
- − Mortgage interest
- −$11,198
- − Property taxes
- −$1,318
- − Insurance
- −$1,000
- − Repairs & maintenance
- −$1,938
- − Management
- −$1,938
- − HOA
- −$24
- − Depreciation
- −$5,815
- Taxable income
- $992
- Est. tax owed @ 24.0%
- −$238
- After-tax cash flow
- $3,976/yr
For passive investors: Depreciation is non-cash, so a rental often shows a tax loss while cash-flowing — sheltering income. Rental losses are passive: they offset passive income freely, and up to $25,000/yr can offset ordinary (W-2) income if you actively participate and your MAGI is under $100k (phasing out to $0 by $150k); unused losses carry forward. On sale, claimed depreciation is recaptured at up to 25%, and gains may owe capital-gains tax (a 1031 exchange can defer both). Figures are a year-1 estimate at your 24.0% rate — not tax advice; consult a CPA.
Schools (NCES district)
- District
- Comal ISD
- NCES district ID
- 4814730
- Math proficiency
- 57% ▼ -9.00%
- Reading proficiency
- 59% ▼ -2.00%
- Median HH income
- $74,792
- Composite
- 51.79/100
- National rank
- #1671
- State rank
- #58 of 826 in TX
Livability — Canyon Lake
- Score
- 67/100
- State rank
- #534
- US rank
- #10441
Category grades
Schools grade is shown separately in the Schools card above.
Census & demographics
- Census place
- Canyon Lake, TX
- County
- Comal County · 206,262 people
- City population
- 42,159
- Metro
- San Antonio-New Braunfels, TX
- Population (ZIP)
- 21,959
- Household income
- $83,853
- Rent vs Own
- Severe rent burden
- 402.0
Population outlook (Comal County) Hauer SSP2
- Today (2025)
- 175,637 people
- By 2030
- 199,911 · +13.8%
- By 2040
- 249,436 · +42.0%
- By 2050
- 299,430 · +70.5%
- By 2075
- 423,857 · +141.3%
- By 2100
- 512,048 · +191.5%
Race, ethnicity, and origin ACS 2023
- Neighborhood character
- Predominantly White (74%)
- Race & ethnicity
- White 74% Hispanic / Latino 20% Two or more races 10% Black 2%
- Hispanic origin (detail)
- Mexican 15%
- Common ancestry
- Lithuanian 3% Romanian 3% Italian 3%
- Foreign-born
- 4% · Canada
- Languages at home
- 91% English-only · Spanish 7%
Political lean MEDSL · Comal
- 2024 margin
- Solid R (+45.5) · D 26.8% · R 72.2%
- 2008→2024 swing
- +1.9pp toward D · 2008: -47.4pp · 2024: -45.5pp
- All cycles
- 2024: R+45.5 2020: R+42.7 2016: R+50.1 2012: R+54.1 2008: R+47.4
Not yet ingested
- Civics
- —
Market trends
- HPI YoY
- ▼ -111.36%
- Current HPI
- 218.4633
- Rent YoY
- ▼ -1.20%
- Metro
- San Antonio-New Braunfels, TX
- State GDP YoY
- ▲ 3.95%
- F500 in state
- 110
Industry mix (Fortune 500 HQ in TX)
| Industry | F500 HQs | Revenue |
|---|---|---|
| Energy | 16 | $1,198B |
|
||
| Technology | 5 | $198B |
|
||
| Engineering / Construction | 4 | $72B |
|
||
| Energy Services | 3 | $60B |
|
||
| Utilities | 3 | $41B |
|
||
| Healthcare | 2 | $330B |
|
||
Price history
2 events — show timeline
- 2026-05-21 Listed $199,900 LERA
- 1994-11-22 Sold (Public Records) — Public Records
Property tax history
+1.2%/yrLatest (2026): $1,318 · +10.0% YoY. Source: county tax records.
Cash-flow waterfall
monthlySold comps — $/sqft
last 12 mo · ≤1 miLoading sold comps…