 Triplex
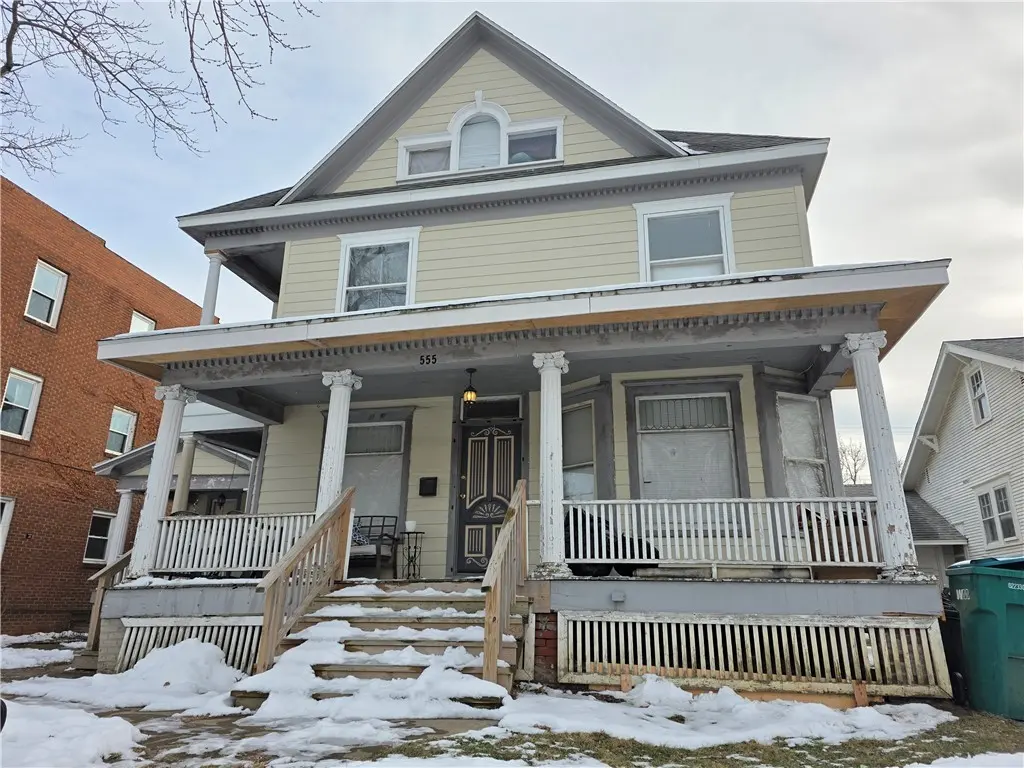
555 W Main St · Decatur, IL
Flood risk 1/10 · Minimal
- FEMA flood zone
- X (unshaded)
- Chance of flooding over 30 yrs
- 0.0%
- Est. flood insurance / yr
- $473 – $860
Fire risk 1/10 · Minimal
- Est. fire insurance / yr
- $804 – $1,492
Heat risk 4/10 · Minor
- Hot days now (above 106°F)
- 7 days/yr
- Hot days in 30 yrs
- 19 days/yr
Wind risk 2/10 · Minimal
- Chance of severe wind over 30 yrs
- 1.0%
Air-quality risk 2/10 · Minimal
- Unhealthy air days now
- 1 days/yr
- Unhealthy air days in 30 yrs
- 1 days/yr
Risk factors via First Street. Map © Google.
Why this score? — see what drove the C grade
The composite is a weighted blend of 9 inputs, each scored 0–100. Each bar is that input's sub-score; the figure is the points it added to the 100-point composite (weight × sub-score).
- Cash flow +30.0/30.0
- 1% rule +10.0/10.0
- DSCR +10.0/10.0
- Livability +3.0/5.0
- Rent growth +2.5/5.0
- Condition / age +2.2/5.0
- Schools +0.4/10.0
- ARV discount +0.0/15.0
- Appreciation +0.0/10.0
$149,900
🖨 Deal sheet 📄 Offer letter ✓ Due diligence
Multi-family units
County records classify this as Multi-Family (2-4 Unit). Listing-text estimate: 3 units. confirmed
Listing remarks MLS
This is a fantastic opportunity to expand your portfolio! This property offers 3 fully occupied units that comes with all appliances. Updates include: Roof replaced in 2012, electric rewired with 200 amp service 2015, 2nd/3rd floor HVAC system replaced 2015, main floor & addition furnace replaced 2023. Property has 1 gas meter, 1 water meter, and a detached garage with an overhead door operator. Unit 551: built-on addition w/ 1 bed/ 1 bath & additional bedroom in basement. Approximately 800 square feet. Unit 555: Main floor - 2 beds/1 bath. Approximately 1,200 square feet. Unit 553: 2nd & 3rd floor - 3 beds/2 bath with its own washer/dryer. Approximately 2,000 square feet. Units 551 & 555 share washer/dryer kept in basement. * Photos taken prior to occupancy, more photos to come soon! Average monthly power/gas bill: $500 Average water bill: $200 Trash: $30 Mowing (during spring/summer months): $100
Key facts
- Furnace replaced
- Hvac system replaced
- Electric rewired
Tags
Neighborhood map
What this means for you Summary
Snapshot
- This is a 1×1bd/1ba + 1×2bd/1ba + 1×3bd/2ba units multifamily listed at $150k. Condition is rated fair.
Deal economics
- At list price, monthly cash flow is $1k ($15k/yr) — positive. Per door: $412/mo.
- The deal already cash-flows at list — no discount required.
- Meets the 1% rule at list price ($3k rent vs $150k).
- Recommended offer: $132k (12.0% below list) — sets the bar for market timing.
- Cap rate 16.2% vs local median 7.0% in Decatur — top-decile yield for the area; either an underpriced asset or a hidden risk that comps aren't pricing in. Stress-test before assuming the spread holds.
Location & tenants
- Location reads 59/100 on livability (#1,076 in IL) — a working-class tenant base; expect higher turnover. Strengths: cost of living A+, housing A+; Watch: schools F, crime F, amenities F.
- Decatur SD 61 (urban): math 3% / reading 6% proficiency, ranked #605 of 620 in IL (top 98%) — low school quality limits family demand, transient renter base, plan for 1-2y turnover; 73% free/reduced lunch — lower-income household profile, screen leases tightly.
- Market conditions: 75 active listings in the ZIP; 36 comparable units currently listed for rent nearby; rentals lingering (median 44d on market — plan ~5-8 weeks vacancy on turnover, expect pricing pressure); 94% of comp listings sitting > 30 days — soft ceiling on asking rent; 63 units permitted in Macon County in 2024 (0 in 5+ unit buildings).
- At $2,877/mo this rent would consume 68% of the median local household income ($51k/yr) (locally 321% of renters already pay >50% of income on rent) — very limited rent-growth headroom before tenants either downsize or default.
Forward outlook
- Local home prices are declining (-3.0%/yr); year-one equity from $1k of loan paydown is wiped out by about $4k of value loss. Plan a longer hold.
- Macon County population projected at -24% by 2050 — secular population decline; favor cash flow + early exit over multi-decade hold.
- At projected returns (-3.0% appreciation + 3.0% rent growth), your $42k cash investment doubles in ~4 years — after that, you're playing with house money.
Negotiation context
- It's been on market 190 days — a 12% lower offer ($132k) is reasonable based on typical stale-listing flexibility.
Risks & watch-outs
- Watch-outs: built in 1897 — expect roof / HVAC / electrical / plumbing capex.
Questions for the listing agent
- It's been on market 190 days. Have you received any prior offers? Is the seller open to a 12% concession, seller financing, or rate buy-down credit?
- Can we see the unit-by-unit rent roll, current vacancy, and any below-market leases? What's the average tenancy length?
- What capital expenditures (roof, boiler, parking lot, exteriors) have been made in the last 5 years, and what's planned in the next 2?
- Have any recent inspections been done? Can we get a copy of the seller's disclosures and any deferred-maintenance estimates?
- Built in 1897 — when were the roof, HVAC, electrical panel, plumbing, and water heater last replaced?
- Why hasn't it sold? Are there any deal-killer items the seller is aware of (foundation, flood, title, zoning, code violations)?
- Is there a deadline driving the sale (1031 exchange, divorce, estate, relocation)? That informs how much negotiation room exists.
- Schools are F-rated, which usually means shorter tenancies and higher turnover. Who's the typical renter profile here, and what's been the actual vacancy rate?
- Crime grade is F in this area — have there been break-ins, vandalism, or insurance claims at this property in the last 3 years? What carrier currently insures it and at what premium?
- What's the average days-on-market for RENTAL listings here right now (not sales)? A rising rental-DOM trend means longer vacancies and softer asking-rent achievability than the comps imply.
- What's the recent tenant-quality profile in this submarket — average credit score on applications, eviction rate, late-payment / NSF rate, and stable-employment percentage? A property-management company in the area should have these aggregated.
- How much new apartment / multifamily construction is in the pipeline within 1–3 miles? Heavy new supply (>2% of stock underway) typically softens rents 12–24 months out; light construction supports rent growth.
Investment metrics
- 1% rule
- 1.92% ✓
- Cap rate
- 16.19%
- Cash-on-cash
- 35.36%
- DSCR
- 2.57
- GRM
- 4.3
CMA / ARV
- ARV (median comp)
- $107,957
- List price
- $149,900
- Delta
- 38.85%
- Verdict
- OVERPRICED
- Comps
- 15 within 1.0 mi
Show comp detail 7 sales within ~0.75 mi
| Address | Dist | Beds/Ba | Sqft | Sold | Price | $/sf | Match |
|---|---|---|---|---|---|---|---|
| 540 W Main St | 0.03mi | —/— | — | 9mo | $375,000 | — | 78 |
| 450 Macon St | 0.14mi | —/— | 1,500 | 6mo | $249,900 | $167 | 76 |
| 646 Macon St | 0.14mi | —/— | 2,556 | 9mo | $67,900 | $27 | 73 |
| 554 & 562 W Main St | 0.03mi | —/— | — | 16mo | $433,600 | — | 73 |
| 422 W William St | 0.21mi | —/— | 3,520 | 7mo | $312,900 | $89 | 72 |
| 703 W William St | 0.18mi | —/— | 2,560 | 14mo | $110,000 | $43 | 67 |
| 548 W Macon St | 0.11mi | —/— | 1,784 | 20mo | $96,900 | $54 | 65 |
Match score weights: distance 35% · size 25% · config 20% · recency 20%. Top-matched comps best support the ARV.
Projected returns pro-forma
-3.0% appreciation · 3.0% rent growth · sell at horizon
- IRR
- 31.0%
- Equity multiple
- 2.30×
- Total profit
- $54,532
- Equity at exit
- $22,351
- IRR
- 38.2%
- Equity multiple
- 4.55×
- Total profit
- $149,103
- Equity at exit
- $12,961
Cash invested: $41,972 (down + closing). Projections, not guarantees.
Landlord ↔ Tenant lean methodology
- Overall (STATE)
- 43 Moderately Tenant-Leaning
- State Illinois
- 43 Moderately Tenant-Leaning · D+7
- County
- — inherits STATE
- City
- — inherits STATE
ZIP-level market 62522
- Home prices YoY
- -16.9%
- Active inventory
- 75
- Price-to-rent
- 13.9×
Monthly cashflow live
- Estimated rent
- $2,877 high interval (Pro) →
- Mortgage (P&I)
- −$786
- Tax est. 1.5%
- −$187 /mo · $2,248/yr
- Insurance
- −$62
- HOA
- −$0
- Vacancy / Maint / Mgmt
- −$604
- Net cashflow
- $1,237
Break-even live
3-unit breakdown (identical units grouped — click to expand)
| Units | Beds | Baths | Est. rent |
|---|---|---|---|
| 1× unit | 1 | 1 | $900 |
| 1× unit | 2 | 1 | $948 |
| 1× unit | 3 | 2 | $1,028 |
| Total (3 units) | $2,877 | ||
UW: 25.0% down · 7.5% · 30yr · 1.5% tax · 5.0% vac · 8.0% maint · 8.0% mgmt
Financing live
Cash to close
- Down payment
- $37,475
- Closing costs
- $4,497
- Reserves months
- —
- Total cash needed
- —
Loan-product check · same deal, 3 products live
Conventional
25% down · 7.5% · 30yr
- Down + closing
- —
- Monthly P&I
- —
- Monthly cashflow
- —
- DSCR
- —
- Eligible?
- —
Personal DTI + credit; lowest rate.
DSCR
20% down · 8.5% · 30yr
- Down + closing
- —
- Monthly P&I
- —
- Monthly cashflow
- —
- DSCR
- —
- Eligible?
- —
No personal income docs; deal must DSCR.
Hard money
10% down · 12.0% · 12mo
- Down + closing
- —
- Monthly P&I
- —
- Monthly cashflow
- —
- DSCR
- —
- Eligible?
- —
Short-term bridge; refi at stabilization.
Rent comps 36 comps
| Address | Beds | Baths | Sqft | Rent | $/sqft | DOM | Units | Dist |
|---|---|---|---|---|---|---|---|---|
| 603 W William St Unit 1 Decatur, IL | 2.0 | 1.0 | — | $1,100 | — | 43d | 1 | 0.16mi |
| 735 W William St Decatur, IL | 1.0 | 1.0 | — | $700 | — | 43d | 1 | 0.20mi |
| 150 W Wood St Decatur, IL | 1.0 | 1.0 | 1228 | $1,100 | $0.90 | 43d | 1 | 0.34mi |
| 135 E Prairie Ave Decatur, IL | 1.0 | 1.0 | — | $1,650 | — | 43d | 1 | 0.43mi |
| 520 S Church St Decatur, IL | 3.0 | 1.5 | 1250 | $1,199 | $0.96 | 13d | 1 | 0.44mi |
| 853 N College St Decatur, IL | 2.0 | 1.0 | 936 | $925 | $0.99 | 43d | 1 | 0.58mi |
| 1045 N Monroe St Decatur, IL | 3.0 | 2.0 | 1094 | $1,000 | $0.91 | 43d | 1 | 0.75mi |
| 1305 W Macon St Decatur, IL | 1.0 | 1.0 | — | $540 | — | 43d | 1 | 0.78mi |
| 1035 S Main St Decatur, IL | 2.0 | 1.0 | 847 | $880 | $1.04 | 13d | 7 | 0.83mi |
| 1058 N Main St Unit 1 Decatur, IL | 1.0 | 1.0 | — | $725 | — | 43d | 1 | 0.84mi |
| 1204 N Church St Decatur, IL | 2.0 | 1.0 | — | $1,100 | — | 43d | 1 | 0.93mi |
| 1245 N Union St Decatur, IL | 3.0 | 2.0 | 1111 | $995 | $0.90 | 43d | 1 | 0.94mi |
| 1441 W Macon St Apt 3 Decatur, IL | 1.0 | 1.0 | — | $575 | — | 43d | 1 | 0.95mi |
| 759 E Lawrence St Decatur, IL | 3.0 | 1.0 | 1080 | $695 | $0.64 | 43d | 1 | 0.96mi |
| 803 E Whitmer St Decatur, IL | 3.0 | 1.0 | 900 | $935 | $1.04 | 43d | 1 | 1.00mi |
| 1311 N Walnut Grove Ave Decatur, IL | 2.0 | 1.0 | 781 | $1,100 | $1.41 | 43d | 1 | 1.04mi |
| 105 N Illinois St Decatur, IL | 3.0 | 1.0 | — | $799 | — | 43d | 1 | 1.13mi |
| 1527 N Main St Unit 1 Decatur, IL | 1.0 | 1.0 | — | $740 | — | 43d | 1 | 1.16mi |
| 830 E Rogers Ave Decatur, IL | 3.0 | 2.0 | — | $795 | — | 43d | 1 | 1.19mi |
| 644 W Division St Decatur, IL | 3.0 | 2.0 | 1365 | $1,200 | $0.88 | 43d | 1 | 1.24mi |
| 1017 N Taylor Ave Decatur, IL | 2.0 | 1.0 | — | $790 | — | 43d | 1 | 1.25mi |
| 1345 N Fairview Ave Decatur, IL | 3.0 | 1.0 | 785 | $985 | $1.25 | 43d | 1 | 1.26mi |
| 1237 E Johns Ave Decatur, IL | 2.0 | 1.0 | 1000 | $895 | $0.90 | 43d | 1 | 1.26mi |
| 1245 Sedgwick St Decatur, IL | 2.0 | 1.0 | 1055 | $895 | $0.85 | 43d | 1 | 1.28mi |
| 1304 E Lawrence St Decatur, IL | 2.0 | 1.0 | 850 | $850 | $1.00 | 43d | 1 | 1.31mi |
| 925 W Olive St Decatur, IL | 1.0 | 1.0 | — | $650 | — | 43d | 1 | 1.34mi |
| 1305 E Whitmer St Decatur, IL | 2.0 | 1.0 | — | $800 | — | 43d | 1 | 1.35mi |
| 347 N Stone St Decatur, IL | 2.0 | 1.0 | 850 | $875 | $1.03 | 43d | 1 | 1.36mi |
| 698 S Stone St Decatur, IL | 2.0 | 1.0 | 900 | $795 | $0.88 | 43d | 1 | 1.40mi |
| 165 S East Ave Unit NA Decatur, IL | 2.0 | 1.0 | 850 | $800 | $0.94 | 43d | 1 | 1.41mi |
| 254 W Peoria Ave Decatur, IL | 2.0 | 1.0 | — | $820 | — | 43d | 1 | 1.42mi |
| 1908 N Union St Decatur, IL | 2.0 | 1.0 | 704 | $899 | $1.28 | 43d | 1 | 1.42mi |
| 1524 E Prairie St Decatur, IL | 3.0 | 1.0 | 1400 | $1,250 | $0.89 | 43d | 1 | 1.44mi |
| 1455 E Whitmer St Decatur, IL | 2.0 | 1.0 | 1050 | $915 | $0.87 | 43d | 1 | 1.45mi |
| 1700 W Grand Ave Unit NA Decatur, IL | 1.0 | 1.0 | 418 | $575 | $1.38 | 43d | 1 | 1.46mi |
| 51 7th Dr Unit NA Decatur, IL | 3.0 | 1.5 | 8900 | $1,400 | $0.16 | 43d | 1 | 1.48mi |
Listing history 17 events
-
2026-06-19days on market $149,900 Active 190 DOM
-
2026-06-18days on market $149,900 Active 189 DOM
-
2026-06-17days on market $149,900 Active 188 DOM
-
2026-06-16days on market $149,900 Active 187 DOM
-
2026-06-15days on market $149,900 Active 186 DOM
-
2026-06-14days on market $149,900 Active 184 DOM
-
2026-06-13days on market $149,900 Active 183 DOM
-
2026-06-10days on market $149,900 Active 181 DOM
-
2026-06-09days on market $149,900 Active 180 DOM
-
2026-06-08days on market $149,900 Active 179 DOM
-
2026-06-07days on market $149,900 Active 178 DOM
-
2026-06-05days on market $149,900 Active 175 DOM
-
2026-06-02days on market $149,900 Active 173 DOM
-
2026-06-01days on market $149,900 Active 172 DOM
-
2026-05-31days on market $149,900 Active 171 DOM
-
2026-05-30days on market $149,900 Active 170 DOM
-
2025-12-11$149,900 Active 941-char remark
Show marketing remark (941 chars)
This is a fantastic opportunity to expand your portfolio! This property offers 3 fully occupied units that comes with all appliances. Updates include: Roof replaced in 2012, electric rewired with 200 amp service 2015, 2nd/3rd floor HVAC system replaced 2015, main floor & addition furnace replaced 2023. Property has 1 gas meter, 1 water meter, and a detached garage with an overhead door operator. Unit 551: built-on addition w/ 1 bed/ 1 bath & additional bedroom in basement. Approximately 800 square feet. Unit 555: Main floor - 2 beds/1 bath. Approximately 1,200 square feet. Unit 553: 2nd & 3rd floor - 3 beds/2 bath with its own washer/dryer. Approximately 2,000 square feet. Units 551 & 555 share washer/dryer kept in basement. * Photos taken prior to occupancy, more photos to come soon! Average monthly power/gas bill: $500 Average water bill: $200 Trash: $30 Mowing (during spring/summer months): $100
ⓘ Source: listings_history table (triggers on properties + properties_extension) + one-shot
backfill from property_details.listing_events for pre-trigger history.
Climate risk First Street
- Flood 1/10 Low FEMA zone X (unshaded) · 0% chance over 30 yrs
- Wildfire 1/10 Low
- Heat 4/10 Moderate 7 d/yr ≥106°F today · 19 d/yr by 30 yrs out
- Wind 2/10 Low 100% chance of damaging wind over 30 yrs
- Air quality 2/10 Low 1 unhealthy d/yr today · 1 by 30 yrs out
Nearby sold comps map
Loading sold comps map…
Walkable amenities ~0.75 mi
Loading nearby amenities…
Taxation est. · year 1
- Rental income
- $34,524
- − Mortgage interest
- −$8,397
- − Property taxes
- −$2,248
- − Insurance
- −$750
- − Repairs & maintenance
- −$2,762
- − Management
- −$2,762
- − Depreciation
- −$4,361
- Taxable income
- $13,245
- Est. tax owed @ 24.0%
- −$3,179
- After-tax cash flow
- $11,664/yr
For passive investors: Depreciation is non-cash, so a rental often shows a tax loss while cash-flowing — sheltering income. Rental losses are passive: they offset passive income freely, and up to $25,000/yr can offset ordinary (W-2) income if you actively participate and your MAGI is under $100k (phasing out to $0 by $150k); unused losses carry forward. On sale, claimed depreciation is recaptured at up to 25%, and gains may owe capital-gains tax (a 1031 exchange can defer both). Figures are a year-1 estimate at your 24.0% rate — not tax advice; consult a CPA.
Condition & rehab AI · 12 photos
This multi-family property requires moderate repairs to exterior siding and paint, but is otherwise in good condition. Upgrades to the exterior will significantly enhance its curb appeal and value.
Repairs flagged
- Major Exterior siding — Signs of damage and weathering
- Major Exterior paint — Peeling and chipping
Value-add opportunities
- Both Paint exterior — Enhances curb appeal and value
- Both Replace exterior siding — Improves home's appearance and value
- Both Replace exterior paint — Enhances curb appeal and value
Renovation cost estimate screening
| Repair item | Severity | Est. cost |
|---|---|---|
| Exterior siding · Signs of damage and weathering | Major | $15,000–50,000 |
| Exterior paint · Peeling and chipping | Major | $15,000–50,000 |
| Total estimated repair cost · 2 items | $30,000–100,000 |
Value-add ROI direction
- Both Paint exterior — Enhances curb appeal and value ↑
- Both Replace exterior siding — Improves home's appearance and value ↑
- Both Replace exterior paint — Enhances curb appeal and value ↑
ⓘ Cost ranges are severity-bucket heuristics (US national rule-of-thumb). Get contractor quotes + a written scope before underwriting a rehab budget.
Schools (NCES district)
- District
- Decatur SD 61
- NCES district ID
- 1711850
- Math proficiency
- 3% ▼ -4.00%
- Reading proficiency
- 6% ▼ -6.00%
- Median HH income
- $38,864
- Composite
- 3.99/100
- National rank
- #10059
- State rank
- #605 of 620 in IL
Livability — Decatur
- Score
- 59/100
- State rank
- #1076
- US rank
- #20533
Category grades
Schools grade is shown separately in the Schools card above.
Census & demographics
- Census place
- Decatur, IL
- County
- Macon County · 78,333 people
- City population
- 78,333
- Metro
- Decatur, IL
- Population (ZIP)
- 15,185
- Household income
- $50,669
- Rent vs Own
- Severe rent burden
- 321.0
Population outlook (Macon County) Hauer SSP2
- Today (2025)
- 99,568 people
- By 2030
- 94,973 · -4.6%
- By 2040
- 85,250 · -14.4%
- By 2050
- 75,920 · -23.8%
- By 2075
- 55,962 · -43.8%
- By 2100
- 36,468 · -63.4%
Race, ethnicity, and origin ACS 2023
- Neighborhood character
- Majority White (62%)
- Race & ethnicity
- White 62% Black 28% Two or more races 7% Hispanic / Latino 2% Asian 1%
- Common ancestry
- Romanian 1% Italian 1% Slovak 1%
- Foreign-born
- 2% · Canada, China, Jamaica
- Languages at home
- 97% English-only · Spanish 2%
Political lean MEDSL · Macon
- 2024 margin
- R (+18.9) · D 39.8% · R 58.7% · Other 1.4%
- 2008→2024 swing
- -20.0pp toward R · 2008: 1.1pp · 2024: -18.9pp
- All cycles
- 2024: R+18.9 2020: R+17.7 2016: R+18.1 2012: R+5.2 2008: D+1.1
Not yet ingested
- Civics
- —
Market trends
- HPI YoY
- ▼ -36.64%
- Current HPI
- 180.7847
- Rent YoY
- —
- Metro
- Decatur, IL
- State GDP YoY
- ▲ 1.59%
- F500 in state
- 60
Industry mix (Fortune 500 HQ in IL)
| Industry | F500 HQs | Revenue |
|---|---|---|
| Insurance | 4 | $201B |
|
||
| Consumer Goods | 4 | $87B |
|
||
| Industrial Machinery | 3 | $64B |
|
||
| Healthcare | 2 | $55B |
|
||
| Retail / Pharmacy | 1 | $148B |
|
||
| Agriculture / Food | 1 | $86B |
|
||
Price history
1 event — show timeline
- 2025-12-11 Listed $149,900 CIBR
Cash-flow waterfall
monthlySold comps — $/sqft
last 12 mo · ≤1 miLoading sold comps…