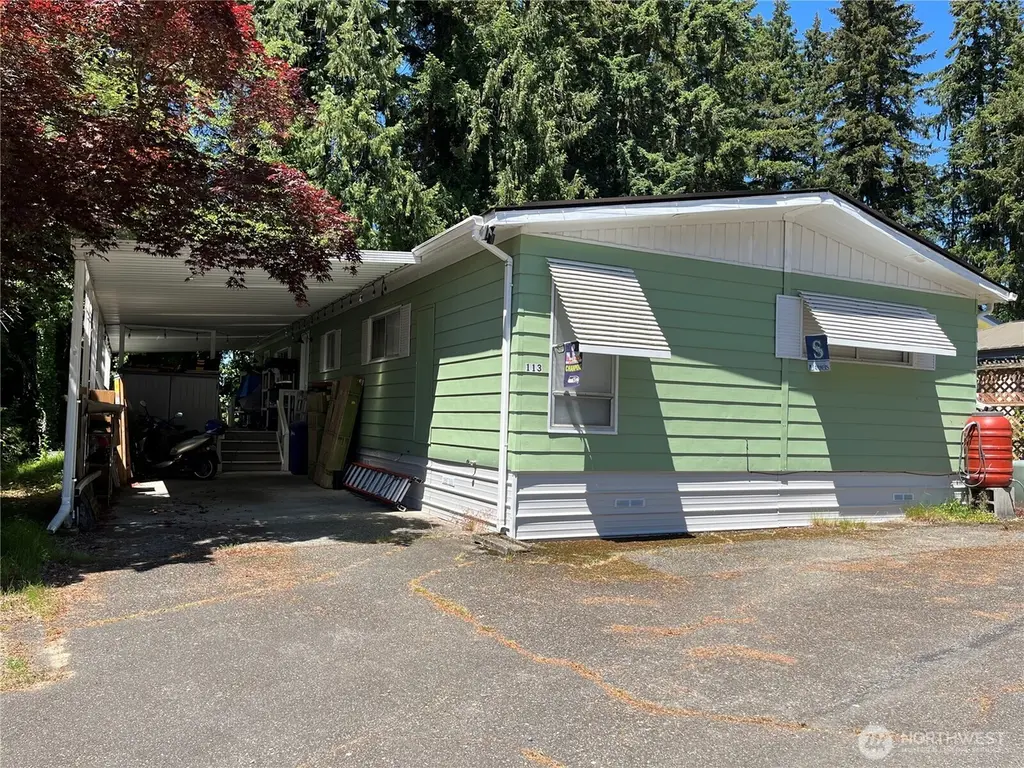
3333 228th St SE #113 · Bothell, WA
Flood risk No data
- FEMA flood zone
- —
- Chance of flooding over 30 yrs
- —
- Est. flood insurance / yr
- —
Fire risk No data
- Est. fire insurance / yr
- —
Heat risk No data
- Hot days now (above threshold)
- —
- Hot days in 30 yrs
- —
Wind risk No data
- Chance of severe wind over 30 yrs
- —
Air-quality risk No data
- Unhealthy air days now
- —
- Unhealthy air days in 30 yrs
- —
Risk factors via First Street. Map © Google.
Why this score? — see what drove the B- grade
The composite is a weighted blend of 9 inputs, each scored 0–100. Each bar is that input's sub-score; the figure is the points it added to the 100-point composite (weight × sub-score).
- Cash flow +30.0/30.0
- 1% rule +10.0/10.0
- DSCR +10.0/10.0
- Schools +6.7/10.0
- Livability +4.2/5.0
- Rent growth +2.9/5.0
- Condition / age +2.5/5.0
- ARV discount +0.0/15.0
- Appreciation +0.0/10.0
$169,950
🖨 Deal sheet (PDF) 📄 Offer letter ✓ Due diligence
Listing remarks
This updated home sits in a welcoming 55+ park where maintenance is minimal and connections with neighbors come easily. Step inside to discover new granite countertops paired with sleek stainless steel appliances in the large kitchen. Beautiful vinyl plank flooring flows throughout the open living areas, creating a clean, contemporary feel while the generous windows frame peaceful views of the surrounding nature. These spaces naturally draw you in, whether you're relaxing with morning coffee or gathering with friends in the evening. The primary suite provides a quiet retreat, while the two additional bedrooms offer flexibility for guests, hobbies, or a home office. Other updates include a n
Key facts
- Large deck
- Burke-gilman trail
- Granite countertops
Tags
Property features AI
Finance
- Other: Calculated living area: 1,488; Foundation details recorded in tax records; Buyer broker compensation: 3%
- Financial info: Listing terms: Cash, Conventional
- HOA & community: Senior community; Park approved for sale; Park name: Canyon MHC; Park amenities include clubhouse and RV parking; Located in cul-de-sac toward back of the park; Bus line nearby; Land lease: $1,200
Exterior
- Parking: Carport; RV parking (park amenity)
- Utilities: Electric energy source; Electric water heater (located outside panel in carport); Power by PUD; Cable: Xfinity; Internet: Xfinity; Water source: see remarks
- Home design: Manufactured double-wide home; One story; Entry; Mobile home remains; Style: Manufactured Double Wide
- Construction: Metal/vinyl construction; Composition roof; Concrete ribbon foundation with tie downs; Make: REX; Manufactured home (not built after 6/15/1976)
- Exterior features: Metal/vinyl siding; Patio/porch/deck; Cul-de-sac lot; Paved access; Has view
Interior
- Kitchen: Dishwasher; Stove/Range
- Bedrooms: 3 bedrooms
- Flooring: Vinyl plank
- Bathrooms: 1 full bath; 1 three-quarter bath; 1 bathtub; 2 showers; Bath off primary
- Heating & cooling: Forced air heating; Heat pump cooling
- Interior features: Water heater; Skylights; Drapes; Landscaped
- Laundry & utility: Washer; Dryer; Utility room
Neighborhood map
What this means for you Summary
Snapshot
- This is a 3-bed/1.0-bath manufactured listed at $170k.
Deal economics
- At list price, monthly cash flow is $2k ($19k/yr) — positive.
- The deal already cash-flows at list — no discount required.
- Meets the 1% rule at list price ($3k rent vs $170k).
- Recommended offer: $167k (1.5% below list) — sets the bar for market timing.
- Cap rate 17.3% vs local median 1.5% in Bothell — top-decile yield for the area; either an underpriced asset or a hidden risk that comps aren't pricing in. Stress-test before assuming the spread holds.
Location & tenants
- Location reads 83/100 on livability (#53 in WA, #962 nationally) — a professional / high-income tenant draw. Strengths: schools A+, commute A+, employment A+; Watch: amenities C-, cost of living F.
- Northshore School District (suburban): math 69% / reading 78% proficiency, ranked #9 of 291 in WA (top 3%) — strong family-tenant draw, lease renewals of 3-5y typical; only 12% free/reduced lunch — higher-income household profile.
- Market conditions: Rents rising (+1.8%/yr); 254 active listings in the ZIP; 10 comparable units currently listed for rent nearby; rentals leasing fast (median 3d on market — plan ~1-2 weeks tenant-placement turnaround); high-income renter base; 3,982 units permitted in Snohomish County in 2024 (1,492 in 5+ unit buildings).
Forward outlook
- Local home prices are declining (-3.0%/yr); year-one equity from $1k of loan paydown is wiped out by about $5k of value loss. Plan a longer hold.
- Snohomish County population projected at +30% by 2050 — long-run rental-demand tailwind backs the buy-and-hold thesis.
- At projected returns (-3.0% appreciation + 1.8% rent growth), your $48k cash investment doubles in ~4 years — after that, you're playing with house money.
Negotiation context
- It's been on market 15 days — a 2% lower offer ($167k) is reasonable based on typical stale-listing flexibility.
- 5 sale attempts since 21y ago with the ask held roughly flat each time — persistent listings suggest the price (not the market) is what's stuck; bring a comps-based counter.
Questions for the listing agent
- Built in 1973 — when were the roof, HVAC, electrical panel, plumbing, and water heater last replaced?
- Is there a deadline driving the sale (1031 exchange, divorce, estate, relocation)? That informs how much negotiation room exists.
- Schools are A-rated — typically a magnet for longer-tenancy family renters. What's the average tenant stay here, and is there a school-zone premium baked into asking?
- What's the average days-on-market for RENTAL listings here right now (not sales)? A rising rental-DOM trend means longer vacancies and softer asking-rent achievability than the comps imply.
- What's the recent tenant-quality profile in this submarket — average credit score on applications, eviction rate, late-payment / NSF rate, and stable-employment percentage? A property-management company in the area should have these aggregated.
- How much new for-sale + rental construction is in the pipeline within 1–3 miles? Heavy new supply typically softens prices + rents 12–24 months out; constrained supply supports both.
Investment metrics
- 1% rule
- 1.93% ✓
- Cap rate
- 17.27%
- Cash-on-cash
- 39.19%
- DSCR
- 2.74
- GRM
- 4.3
CMA / ARV
- ARV (on-the-fly)
- $133,920
- Comps found
- 2
Show comp detail 2 sales within ~0.75 mi
| Address | Dist | Beds/Ba | Sqft | Sold | Price | $/sf | Match |
|---|---|---|---|---|---|---|---|
| 3333 228th St SE #94 | 0.00mi | 2/2.0 (-1) | 1,440 (-3%) | 2mo | $30,000 | $21 | 84 |
| 3333 228th St SE #100 | 0.00mi | 3/2.0 | 1,336 (-10%) | 6mo | $120,000 | $90 | 74 |
Match score weights: distance 35% · size 25% · config 20% · recency 20%. Top-matched comps best support the ARV.
Projected returns pro-forma
-3.0% appreciation · 1.75% rent growth · sell at horizon
- IRR
- 34.1%
- Equity multiple
- 2.41×
- Total profit
- $67,332
- Equity at exit
- $25,340
- IRR
- 40.3%
- Equity multiple
- 4.56×
- Total profit
- $169,630
- Equity at exit
- $14,694
Cash invested: $47,586 (down + closing). Projections, not guarantees.
Landlord ↔ Tenant lean methodology
- Overall (STATE)
- 28 Tenant-Leaning
- State Washington
- 28 Tenant-Leaning · D+8
- County
- — inherits STATE
- City
- — inherits STATE
ZIP-level market 98021
- Rents YoY
- 1.8%
- Active inventory
- 254
- Price-to-rent
- 4.3×
Monthly cashflow live
- Estimated rent
- $3,285 high interval (Pro) →
- Mortgage (P&I)
- −$891
- Tax from tax record
- −$79 /mo · $945/yr
- Insurance
- −$71
- HOA
- −$0
- Vacancy / Maint / Mgmt
- −$690
- Net cashflow
- $1,554
Break-even live
Sensitivity live
| Price | -10% $1,650 | -5% $1,602 | +0% $1,554 | +5% $1,506 | +10% $1,458 |
|---|---|---|---|---|---|
| Rent | -10% $1,295 | -5% $1,424 | +0% $1,554 | +5% $1,684 | +10% $1,814 |
| Rate | -1.0pp $1,640 | -0.5pp $1,597 | base $1,554 | +0.5pp $1,510 | +1.0pp $1,465 |
UW: 25.0% down · 7.5% · 30yr · 1.5% tax · 5.0% vac · 8.0% maint · 8.0% mgmt
Financing live
Cash to close
- Down payment
- $42,488
- Closing costs
- $5,098
- Reserves months
- —
- Total cash needed
- —
Loan-product check · same deal, 3 products live
Conventional
25% down · 7.5% · 30yr
- Down + closing
- —
- Monthly P&I
- —
- Monthly cashflow
- —
- DSCR
- —
- Eligible?
- —
Personal DTI + credit; lowest rate.
DSCR
20% down · 8.5% · 30yr
- Down + closing
- —
- Monthly P&I
- —
- Monthly cashflow
- —
- DSCR
- —
- Eligible?
- —
No personal income docs; deal must DSCR.
Hard money
10% down · 12.0% · 12mo
- Down + closing
- —
- Monthly P&I
- —
- Monthly cashflow
- —
- DSCR
- —
- Eligible?
- —
Short-term bridge; refi at stabilization.
Rent comps 10 comps
| Address | Beds | Baths | Sqft | Rent | $/sqft | DOM | Units | Dist |
|---|---|---|---|---|---|---|---|---|
| 23028 27th Ave SE Bothell, WA | 1.0–3.0 | 1.0–2.0 | 880 | $3,348 | $3.80 | 2d | 16 | 0.53mi |
| 2207 227th St SE Bothell, WA | 1.0–3.0 | 1.0–2.0 | 846 | $2,767 | $3.27 | 2d | 8 | 0.73mi |
| 23940 40th Dr SE Bothell, WA | 1.0–3.0 | 1.0–2.5 | 1151 | $3,637 | $3.16 | 2d | 12 | 0.92mi |
| 1630 228th St SE Bothell, WA | 1.0–3.0 | 1.0–2.0 | 940 | $3,057 | $3.25 | 2d | 11 | 1.05mi |
| 2319 210th St SE Bothell, WA | 4.0 | 2.5 | 1742 | $3,800 | $2.18 | 24d | 1 | 1.23mi |
| 20707 31st Dr SE Bothell, WA | 2.0 | 2.0 | 1334 | $2,740 | $2.05 | 18d | 1 | 1.23mi |
| 21623 16th Dr SE Bothell, WA | 1.0–3.0 | 1.0–2.0 | 990 | $3,295 | $3.33 | 2d | 11 | 1.28mi |
| 2129 Maltby Rd Bothell, WA | 3.0 | 2.0 | 1207 | $2,195 | $1.82 | 5d | 4 | 1.49mi |
| 20012 101st Pl NE Bothell, WA | 4.0 | 2.0 | 1593 | $3,900 | $2.45 | 15d | 1 | 1.50mi |
| 20012 101st Pl NE Bothell, WA | 4.0 | 2.0 | 1593 | $3,300 | $2.07 | 2d | 1 | 1.50mi |
Listing history 11 events
-
2026-06-18days on market $169,950 Active 15 DOM
-
2026-06-17days on market $169,950 Active 14 DOM
-
2026-06-16days on market $169,950 Active 13 DOM
-
2026-06-15days on market $169,950 Active 12 DOM
-
2026-06-13days on market $169,950 Active 10 DOM
-
2026-06-13days on market $169,950 Active 9 DOM
-
2026-06-09days on market $169,950 Active 6 DOM
-
2026-06-08days on market $169,950 Active 5 DOM
-
2026-06-07days on market $169,950 Active 4 DOM
-
2026-06-04remarks 699-char remark
-
2026-06-04$169,950 Active 1 DOM
ⓘ Source: listings_history table (triggers on properties + properties_extension) + one-shot
backfill from property_details.listing_events for pre-trigger history.
Tax reassessment forecast WA · Resets to sale price
- Current annual tax
- $945 · $79/mo
- Projected year-2 tax
- $1,666 · $139/mo
- Expected delta
- +$720/yr (+$60/mo · 76.2%)
ⓘ Screening estimate from a state-policy table — verify with the county assessor before closing.
Nearby sold comps map
Loading sold comps map…
Walkable amenities ~0.75 mi
Loading nearby amenities…
Taxation est. · year 1
- Rental income
- $39,417
- − Mortgage interest
- −$9,520
- − Property taxes
- −$945
- − Insurance
- −$850
- − Repairs & maintenance
- −$3,153
- − Management
- −$3,153
- − Depreciation
- −$4,944
- Taxable income
- $16,852
- Est. tax owed @ 24.0%
- −$4,044
- After-tax cash flow
- $14,605/yr
For passive investors: Depreciation is non-cash, so a rental often shows a tax loss while cash-flowing — sheltering income. Rental losses are passive: they offset passive income freely, and up to $25,000/yr can offset ordinary (W-2) income if you actively participate and your MAGI is under $100k (phasing out to $0 by $150k); unused losses carry forward. On sale, claimed depreciation is recaptured at up to 25%, and gains may owe capital-gains tax (a 1031 exchange can defer both). Figures are a year-1 estimate at your 24.0% rate — not tax advice; consult a CPA.
Schools (NCES district)
- District
- Northshore School District
- NCES district ID
- 5305910
- Math proficiency
- 69% ▼ -3.00%
- Reading proficiency
- 78% ▼ -1.00%
- Median HH income
- $92,951
- Composite
- 67.41/100
- National rank
- #826
- State rank
- #9 of 291 in WA
Livability — Bothell
- Score
- 83/100
- State rank
- #53
- US rank
- #962
Category grades
Schools grade is shown separately in the Schools card above.
Census & demographics
- Census place
- Bothell, WA
- County
- Snohomish County · 786,756 people
- City population
- 141,635
- Metro
- Seattle-Tacoma-Bellevue, WA
- Population (ZIP)
- 35,631
- Household income
- $183,786
- Rent vs Own
- Severe rent burden
- 413.0
Population outlook (Snohomish County) Hauer SSP2
- Today (2025)
- 899,800 people
- By 2030
- 960,975 · +6.8%
- By 2040
- 1,074,447 · +19.4%
- By 2050
- 1,171,954 · +30.2%
- By 2075
- 1,384,849 · +53.9%
- By 2100
- 1,497,296 · +66.4%
Race, ethnicity, and origin ACS 2023
- Neighborhood character
- Diverse neighborhood (Simpson 0.61)
- Race & ethnicity
- White 55% Asian 29% Two or more races 9% Hispanic / Latino 9% Black 1%
- Hispanic origin (detail)
- Mexican 6%
- Common ancestry
- Portuguese 4% Italian 3% Lithuanian 2%
- Foreign-born
- 29% · China, Canada, South Korea
- Languages at home
- 65% English-only · Other Indo-European 11% Other Asian/Pacific 6% Chinese 6%
Political lean MEDSL · Snohomish
- 2024 margin
- D (+19.0) · D 57.8% · R 38.9% · Other 3.3%
- 2008→2024 swing
- +0.1pp no change · 2008: 18.9pp · 2024: 19.0pp
- All cycles
- 2024: D+19.0 2020: D+20.6 2016: D+16.6 2012: D+16.2 2008: D+18.9
Not yet ingested
- Civics
- —
Market trends
- HPI YoY
- ▼ -903.22%
- Current HPI
- 380.5475
- Rent YoY
- ▲ 1.75%
- Metro
- Seattle-Tacoma-Bellevue, WA
- State GDP YoY
- ▲ 4.65%
- F500 in state
- 22
Industry mix (Fortune 500 HQ in WA)
| Industry | F500 HQs | Revenue |
|---|---|---|
| Retail | 2 | $269B |
|
||
| Technology / Retail | 1 | $638B |
|
||
| Technology | 1 | $245B |
|
||
| Telecommunications | 1 | $38B |
|
||
| Food / Beverage | 1 | $36B |
|
||
| Automotive / Trucks | 1 | $34B |
|
||
Price history
+749.8% since first listed14 events — show timeline
- 2026-06-03 Listed $169,950 NWMLS as Distributed by MLS Grid
- 2023-04-18 Sold (MLS) $150,000 NWMLS as Distributed by MLS Grid
- 2023-03-15 Pending — NWMLS as Distributed by MLS Grid
- 2023-03-07 Listed $160,000 NWMLS as Distributed by MLS Grid
- 2020-12-23 Sold (MLS) $120,500 NWMLS as Distributed by MLS Grid
- 2020-12-22 Pending — NWMLS as Distributed by MLS Grid
- 2020-12-12 Pending — NWMLS as Distributed by MLS Grid
- 2020-12-07 Price Changed $124,500 NWMLS as Distributed by MLS Grid
- 2020-11-17 Listed $123,500 NWMLS as Distributed by MLS Grid
- 2007-12-05 Sold (MLS) $25,000 NWMLS as Distributed by MLS Grid
- 2007-11-26 Delisted — NWMLS as Distributed by MLS Grid
- 2007-10-18 Listed $26,500 NWMLS as Distributed by MLS Grid
- 2006-01-20 Sold (MLS) $20,000 NWMLS as Distributed by MLS Grid
- 2005-11-20 Listed $20,000 NWMLS as Distributed by MLS Grid
Property tax history
+13.0%/yrLatest (2026): $945 · +5.8% YoY. Source: county tax records.
Cash-flow waterfall
monthlySold comps — $/sqft
last 12 mo · ≤1 miLoading sold comps…