 Fourplex
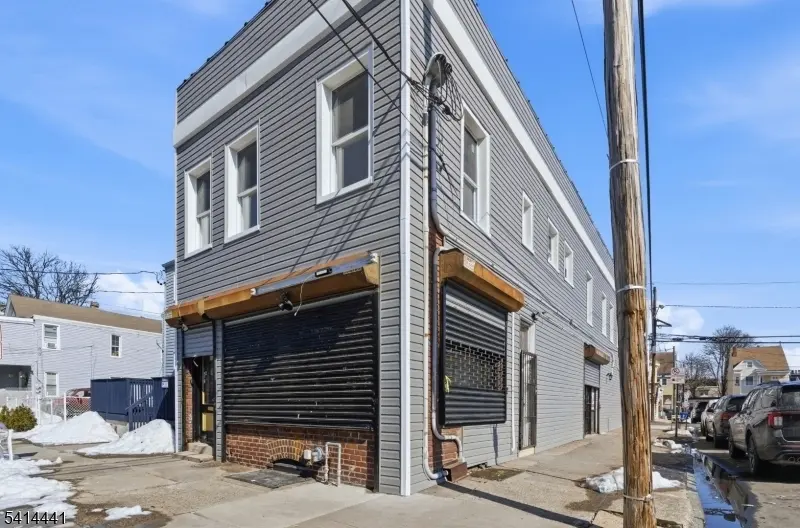
615 E 22Nd St · Paterson, NJ
Flood risk No data
- FEMA flood zone
- —
- Chance of flooding over 30 yrs
- —
- Est. flood insurance / yr
- —
Fire risk No data
- Est. fire insurance / yr
- —
Heat risk No data
- Hot days now (above threshold)
- —
- Hot days in 30 yrs
- —
Wind risk No data
- Chance of severe wind over 30 yrs
- —
Air-quality risk No data
- Unhealthy air days now
- —
- Unhealthy air days in 30 yrs
- —
Risk factors via First Street. Map © Google.
Why this score? — see what drove the C grade
The composite is a weighted blend of 9 inputs, each scored 0–100. Each bar is that input's sub-score; the figure is the points it added to the 100-point composite (weight × sub-score).
- Cash flow +21.9/30.0
- ARV discount +7.5/15.0
- DSCR +7.0/10.0
- 1% rule +5.7/10.0
- Appreciation +5.0/10.0
- Condition / age +4.0/5.0
- Livability +3.5/5.0
- Rent growth +2.5/5.0
- Schools +1.3/10.0
$800,000
🖨 Deal sheet (PDF) 📄 Offer letter ✓ Due diligence
Multi-family units
County records classify this as Multi-Family (2-4 Unit). Listing-text estimate: 4 units. confirmed
Listing remarks
Welcome to an incredible opportunity in the East Side Section of Paterson! This spacious and beautifully renovated 4-Unit Mixed-use property is perfect for both investors and owner occupants looking to maximize value and versatility. This fully updated building features two residential apartments and two storefronts, offering the ideal blend of cash flow potential and modern living. The first apartment boasts 4 bedrooms and 1.5 bathrooms with a bright and functional layout designed for comfort. The second apartment offers 2 bedrooms and 1 bathroom with impressive ceiling height that creates an open, airy feel throughout the space. Both units showcase stylish finishes and thoughtful updates
Key facts
- Listed 16 days
Property features AI
Finance
- Financial info: 4 residential units; Gross operating income: $100,200; Net operating income: $66,696; Total operating expenses: $33,504; Expenses include cold water and taxes; Unit rents: Unit 1 $1,850; Unit 2 $1,700; Unit 3 $1,800; Unit 4 $3,000; Security deposits: Unit 1 $1,850; Unit 2 $1,700; Unit 3 $1,800; Unit 4 $3,000
Exterior
- Parking: Off-street parking
- Utilities: Electric service available; Natural gas available; Public sewer; Public water
- Home design: Two-story unit style; Grey exterior color
- Construction: Renovated in 2025
- Exterior features: Aluminum siding; Flat roof; Renovated building (2025)
Interior
- Kitchen: Unit 3: Microwave, Electric range/oven; Unit 4: Microwave, Gas range/oven; Unit 4: Eat-in kitchen
- Bedrooms: Unit 3: 2 bedrooms; Unit 4: 4 bedrooms
- Bathrooms: 2 full bathrooms; 3 half bathrooms; Unit 1: 1 bathroom; Unit 2: 1 bathroom; Unit 3: 1 bathroom; Unit 4: 1.5 bathrooms
- Heating & cooling: Four heating units; Baseboard electric heating; Baseboard hot water heating; Heating fuel: Electric and natural gas
- Interior features: Partial, unfinished basement with storage and utility room; 17 total rooms
- Laundry & utility: Utility rooms in multiple units; Owner pays water for units 1–3; tenants pay electric and heat (unit-specific arrangements listed per unit)
Neighborhood map
What this means for you Summary
Snapshot
- This is a 3×4.0bd/1.5ba + 1×2.0bd/1.0ba units multifamily listed at $800k. Condition is rated good.
Deal economics
- At list price, monthly cash flow is $1k ($15k/yr) — positive. Per door: $315/mo.
- The deal already cash-flows at list — no discount required.
- Meets the 1% rule at list price ($9k rent vs $800k).
- Recommended offer: $788k (1.5% below list) — sets the bar for market timing.
- Cap rate 8.2% vs local median 3.5% in Paterson — top-decile yield for the area; either an underpriced asset or a hidden risk that comps aren't pricing in. Stress-test before assuming the spread holds.
Location & tenants
- Location reads 69/100 on livability (#293 in NJ) — a middle-class / working-renter tenant base. Strengths: amenities A+, commute A+, health & safety A; Watch: schools D, employment D, crime F.
- Paterson Public School District (suburban): math 6% / reading 26% proficiency, ranked #458 of 472 in NJ (top 97%) — low school quality limits family demand, transient renter base, plan for 1-2y turnover; 83% free/reduced lunch — lower-income household profile, screen leases tightly.
- Market conditions: 1 active listings in the ZIP; 860 units permitted in Passaic County in 2024 (614 in 5+ unit buildings).
Forward outlook
- In year one you build about $30k of equity ($6k loan paydown + $24k appreciation (3.0% local appreciation)).
- Passaic County population projected at +5% by 2050 — modest demand growth; plan on rents tracking national, not racing it.
- At projected returns (3.0% appreciation + 3.0% rent growth), your $224k cash investment doubles in ~5 years — after that, you're playing with house money.
- By year 2, paydown + projected appreciation supports a ~$48k cash-out refi (75% LTV) — recoverable capital for the next deal without selling this one.
Negotiation context
- It's been on market 16 days — a 2% lower offer ($788k) is reasonable based on typical stale-listing flexibility.
- Current owner paid $425k; list at $800k implies a 88% gain — meaningful room to come down on a strong offer.
Questions for the listing agent
- Can we see the unit-by-unit rent roll, current vacancy, and any below-market leases? What's the average tenancy length?
- What capital expenditures (roof, boiler, parking lot, exteriors) have been made in the last 5 years, and what's planned in the next 2?
- Is there a deadline driving the sale (1031 exchange, divorce, estate, relocation)? That informs how much negotiation room exists.
- Schools are D-rated, which usually means shorter tenancies and higher turnover. Who's the typical renter profile here, and what's been the actual vacancy rate?
- Crime grade is F in this area — have there been break-ins, vandalism, or insurance claims at this property in the last 3 years? What carrier currently insures it and at what premium?
- What's the average days-on-market for RENTAL listings here right now (not sales)? A rising rental-DOM trend means longer vacancies and softer asking-rent achievability than the comps imply.
- What's the recent tenant-quality profile in this submarket — average credit score on applications, eviction rate, late-payment / NSF rate, and stable-employment percentage? A property-management company in the area should have these aggregated.
- How much new apartment / multifamily construction is in the pipeline within 1–3 miles? Heavy new supply (>2% of stock underway) typically softens rents 12–24 months out; light construction supports rent growth.
Investment metrics
- 1% rule
- 1.07% ✓
- Cap rate
- 8.18%
- Cash-on-cash
- 6.74%
- DSCR
- 1.30
- GRM
- 7.8
CMA / ARV
No comps found within radius.
Projected returns pro-forma
3.0% appreciation · 3.0% rent growth · sell at horizon
- IRR
- 13.8%
- Equity multiple
- 1.79×
- Total profit
- $176,692
- Equity at exit
- $359,715
- IRR
- 15.7%
- Equity multiple
- 3.31×
- Total profit
- $516,924
- Equity at exit
- $554,363
Cash invested: $224,000 (down + closing). Projections, not guarantees.
Landlord ↔ Tenant lean methodology
- Overall (STATE)
- 21 Tenant-Leaning
- State New Jersey
- 21 Tenant-Leaning · D+6
- County
- — inherits STATE
- City
- — inherits STATE
ZIP-level market 07514-2842
- Active inventory
- 1
- Price-to-rent
- 30.3×
Monthly cashflow live
- Estimated rent
- $8,592 medium interval (Pro) →
- Mortgage (P&I)
- −$4,195
- Tax est. 1.5%
- −$1,000 /mo · $12,000/yr
- Insurance
- −$333
- HOA
- −$0
- Vacancy / Maint / Mgmt
- −$1,804
- Net cashflow
- $1,259
Break-even live
Sensitivity live
| Price | -10% $1,812 | -5% $1,535 | +0% $1,259 | +5% $983 | +10% $706 |
|---|---|---|---|---|---|
| Rent | -10% $580 | -5% $920 | +0% $1,259 | +5% $1,598 | +10% $1,938 |
| Rate | -1.0pp $1,662 | -0.5pp $1,463 | base $1,259 | +0.5pp $1,052 | +1.0pp $841 |
4-unit breakdown (identical units grouped — click to expand)
| Units | Beds | Baths | Est. rent |
|---|---|---|---|
| 3× units | 4.0 | 1.5 | $6,600 |
| #1 | 4.0 | 1.5 | $2,200 |
| #3 | 4.0 | 1.5 | $2,200 |
| #4 | 4.0 | 1.5 | $2,200 |
| 1× unit | 2.0 | 1 | $1,992 |
| Total (4 units) | $8,592 | ||
UW: 25.0% down · 7.5% · 30yr · 1.5% tax · 5.0% vac · 8.0% maint · 8.0% mgmt
Financing live
Cash to close
- Down payment
- $200,000
- Closing costs
- $24,000
- Reserves months
- —
- Total cash needed
- —
Loan-product check · same deal, 3 products live
Conventional
25% down · 7.5% · 30yr
- Down + closing
- —
- Monthly P&I
- —
- Monthly cashflow
- —
- DSCR
- —
- Eligible?
- —
Personal DTI + credit; lowest rate.
DSCR
20% down · 8.5% · 30yr
- Down + closing
- —
- Monthly P&I
- —
- Monthly cashflow
- —
- DSCR
- —
- Eligible?
- —
No personal income docs; deal must DSCR.
Hard money
10% down · 12.0% · 12mo
- Down + closing
- —
- Monthly P&I
- —
- Monthly cashflow
- —
- DSCR
- —
- Eligible?
- —
Short-term bridge; refi at stabilization.
Listing history 13 events
-
2026-06-21days on market $800,000 Active 16 DOM
-
2026-06-18days on market $800,000 Active 13 DOM
-
2026-06-17pricedays on market $800,000 Active 12 DOM
-
2026-06-16days on market $879,999 Active 11 DOM
-
2026-06-15days on market $879,999 Active 10 DOM
-
2026-06-13days on market $879,999 Active 8 DOM
-
2026-06-13days on market $879,999 Active 7 DOM
-
2026-06-09days on market $879,999 Active 4 DOM
-
2026-06-08days on market $879,999 Active 3 DOM
-
2026-06-07status $879,999 Active 2 DOM
-
2026-06-04days on market $879,999 Coming Soon 2 DOM
-
2026-06-02remarks 699-char remark
-
2026-06-02$879,999 Coming Soon 1 DOM
ⓘ Source: listings_history table (triggers on properties + properties_extension) + one-shot
backfill from property_details.listing_events for pre-trigger history.
Nearby sold comps map
Loading sold comps map…
Walkable amenities ~0.75 mi
Loading nearby amenities…
Taxation est. · year 1
- Rental income
- $103,104
- − Mortgage interest
- −$44,812
- − Property taxes
- −$12,000
- − Insurance
- −$4,000
- − Repairs & maintenance
- −$8,248
- − Management
- −$8,248
- − Depreciation
- −$23,273
- Taxable income
- $2,522
- Est. tax owed @ 24.0%
- −$605
- After-tax cash flow
- $14,503/yr
For passive investors: Depreciation is non-cash, so a rental often shows a tax loss while cash-flowing — sheltering income. Rental losses are passive: they offset passive income freely, and up to $25,000/yr can offset ordinary (W-2) income if you actively participate and your MAGI is under $100k (phasing out to $0 by $150k); unused losses carry forward. On sale, claimed depreciation is recaptured at up to 25%, and gains may owe capital-gains tax (a 1031 exchange can defer both). Figures are a year-1 estimate at your 24.0% rate — not tax advice; consult a CPA.
Condition & rehab AI · 12 photos
This fully renovated 4-unit mixed-use property in Paterson offers a great opportunity for investors and owner-occupants. The units are modern and well-maintained, with fresh paint and updated finishes.
Value-add opportunities
- Both Landscaping — Enhances curb appeal and adds value
- Both Painting exterior — Fresh paint can improve curb appeal and value
- Both Landscaping and curb appeal — Improves overall aesthetic and value
Renovation cost estimate screening
Value-add ROI direction
- Both Landscaping — Enhances curb appeal and adds value ↑
- Both Painting exterior — Fresh paint can improve curb appeal and value ↑
- Both Landscaping and curb appeal — Improves overall aesthetic and value ↑
ⓘ Cost ranges are severity-bucket heuristics (US national rule-of-thumb). Get contractor quotes + a written scope before underwriting a rehab budget.
Schools (NCES district)
- District
- Paterson Public School District
- NCES district ID
- 3412690
- Math proficiency
- 6% ▼ -12.00%
- Reading proficiency
- 26% ▼ -4.00%
- Median HH income
- $34,365
- Composite
- 13.02/100
- National rank
- #9568
- State rank
- #458 of 472 in NJ
Livability — Paterson
- Score
- 69/100
- State rank
- #293
- US rank
- #8763
Category grades
Schools grade is shown separately in the Schools card above.
Census & demographics
- Census place
- Paterson, NJ
Population outlook (Passaic County) Hauer SSP2
- Today (2025)
- 525,915 people
- By 2030
- 532,160 · +1.2%
- By 2040
- 543,670 · +3.4%
- By 2050
- 554,326 · +5.4%
- By 2075
- 584,728 · +11.2%
- By 2100
- 598,978 · +13.9%
Not yet ingested
- Political lean
- —
- Race & ethnicity
- —
- Common origin
- —
- Civics
- —
Market trends
- HPI YoY
- —
- Current HPI
- —
- Rent YoY
- —
- Metro
- —
- State GDP YoY
- ▲ 2.05%
- F500 in state
- 34
Industry mix (Fortune 500 HQ in NJ)
| Industry | F500 HQs | Revenue |
|---|---|---|
| Consumer Goods | 3 | $31B |
|
||
| Pharmaceuticals | 2 | $153B |
|
||
| Technology | 2 | $21B |
|
||
| Insurance | 2 | $20B |
|
||
| Healthcare | 2 | $19B |
|
||
| Financial Services | 1 | $70B |
|
||
Price history
+76.0% since first listed4 events — show timeline
- 2026-06-02 Coming Soon $879,999 GSMLS
- 2025-07-30 Sold (MLS) $425,000 GSMLS
- 2025-03-25 Pending — GSMLS
- 2025-02-19 Listed $500,000 GSMLS
Cash-flow waterfall
monthlySold comps — $/sqft
last 12 mo · ≤1 miLoading sold comps…