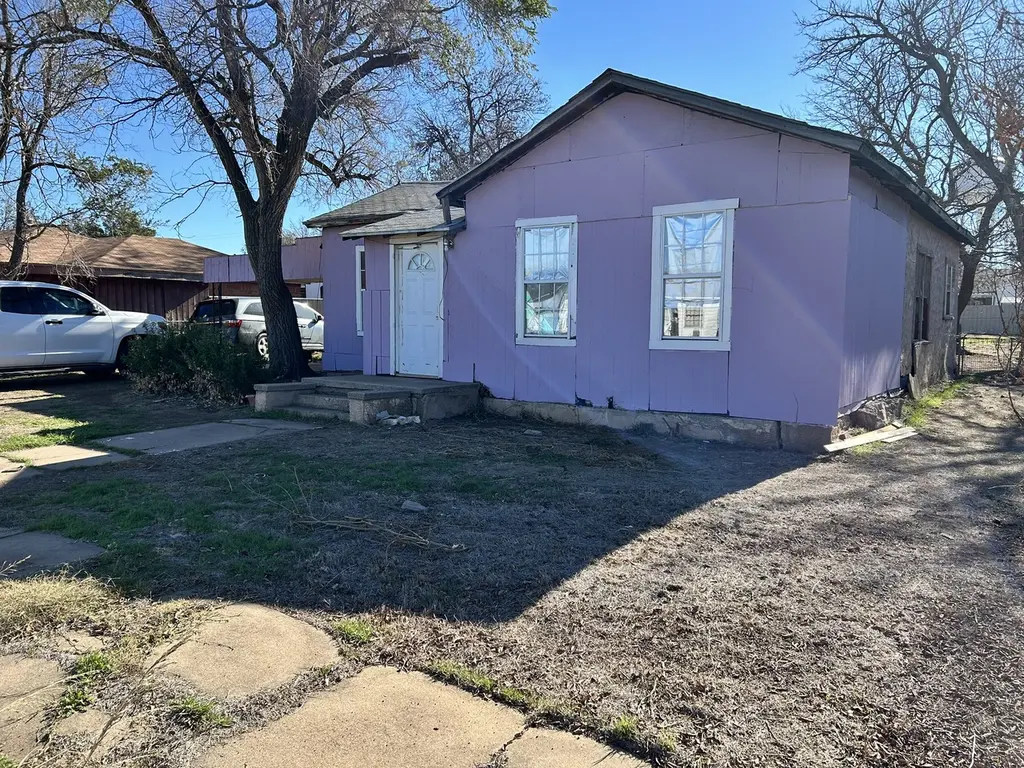
903 W 8th St · Quanah, TX
Flood risk 1/10 · Minimal
- FEMA flood zone
- —
- Chance of flooding over 30 yrs
- 0.0%
- Est. flood insurance / yr
- —
Fire risk 5/10 · Moderate
- Est. fire insurance / yr
- $1,222 – $2,270
Heat risk 6/10 · Moderate
- Hot days now (above 107°F)
- 6 days/yr
- Hot days in 30 yrs
- 17 days/yr
Wind risk 3/10 · Minor
- Chance of severe wind over 30 yrs
- 6.0%
Air-quality risk 1/10 · Minimal
- Unhealthy air days now
- 0 days/yr
- Unhealthy air days in 30 yrs
- 0 days/yr
Risk factors via First Street. Map © Google.
Why this score? — see what drove the B grade
The composite is a weighted blend of 9 inputs, each scored 0–100. Each bar is that input's sub-score; the figure is the points it added to the 100-point composite (weight × sub-score).
- Cash flow +30.0/30.0
- 1% rule +10.0/10.0
- DSCR +10.0/10.0
- ARV discount +6.2/15.0
- Appreciation +5.0/10.0
- Livability +3.8/5.0
- Schools +3.4/10.0
- Rent growth +2.5/5.0
- Condition / age +2.5/5.0
$58,000
🖨 Deal sheet (PDF) 📄 Offer letter ✓ Due diligence
Listing remarks MLS
This Home 3 Bedrooms , Full Bathroom , Dining Room, Living Room, Fenced Backyard, Located Two Blocks From United Supermarket ,and 3 Blocks From Loves Truck Stop, also for sale or rent to own, Listing agent is owner
Key facts
- Living room
- Dining room
- Fenced backyard
Tags
Neighborhood map
What this means for you Summary
Snapshot
- This is a 3-bed/1.0-bath single-family listed at $58k.
Deal economics
- At list price, monthly cash flow is $485 ($6k/yr) — positive.
- The deal already cash-flows at list — no discount required.
- Meets the 1% rule at list price ($1k rent vs $58k).
- Recommended offer: $51k (12.0% below list) — sets the bar for market timing.
Location & tenants
- Location reads 76/100 on livability (#116 in TX, #3,745 nationally) — a middle-class / working-renter tenant base. Strengths: cost of living A+, housing A+, health & safety A+; Watch: schools D, amenities F, commute F.
- Quanah ISD (rural): math 44% / reading 37% proficiency, ranked #432 of 826 in TX (top 52%) — families likely to look elsewhere, expect single-tenant / working-renter base with shorter leases.
- Market conditions: 26 active listings in the ZIP.
Forward outlook
- In year one you build about $2k of equity ($401 loan paydown + $2k appreciation (3.0% local appreciation)).
- Hardeman County population projected at -21% by 2050 — secular population decline; favor cash flow + early exit over multi-decade hold.
- At projected returns (3.0% appreciation + 3.0% rent growth), your $16k cash investment doubles in ~2 years — after that, you're playing with house money.
Negotiation context
- It's been on market 186 days — a 12% lower offer ($51k) is reasonable based on typical stale-listing flexibility.
- 10 sale attempts since 5y ago; this cycle's ask is 6344% above the opening price — seller raised mid-cycle; expect resistance to lowballs.
Risks & watch-outs
- Watch-outs: built in 1954 — expect roof / HVAC / electrical / plumbing capex.
- Climate carrying-cost: moderate wildfire risk; extreme-heat days projected 6→17/yr by 2055 (HVAC capex compounding) — expect insurance premiums to compound above CPI over the hold.
Questions for the listing agent
- It's been on market 186 days. Have you received any prior offers? Is the seller open to a 12% concession, seller financing, or rate buy-down credit?
- Built in 1954 — when were the roof, HVAC, electrical panel, plumbing, and water heater last replaced?
- Why hasn't it sold? Are there any deal-killer items the seller is aware of (foundation, flood, title, zoning, code violations)?
- Is there a deadline driving the sale (1031 exchange, divorce, estate, relocation)? That informs how much negotiation room exists.
- Schools are D-rated, which usually means shorter tenancies and higher turnover. Who's the typical renter profile here, and what's been the actual vacancy rate?
- What's the average days-on-market for RENTAL listings here right now (not sales)? A rising rental-DOM trend means longer vacancies and softer asking-rent achievability than the comps imply.
- What's the recent tenant-quality profile in this submarket — average credit score on applications, eviction rate, late-payment / NSF rate, and stable-employment percentage? A property-management company in the area should have these aggregated.
- How much new for-sale + rental construction is in the pipeline within 1–3 miles? Heavy new supply typically softens prices + rents 12–24 months out; constrained supply supports both.
Investment metrics
- 1% rule
- 1.86% ✓
- Cap rate
- 16.34%
- Cash-on-cash
- 35.87%
- DSCR
- 2.60
- GRM
- 4.5
CMA / ARV
- ARV (median comp)
- $56,407
- List price
- $58,000
- Delta
- 2.82%
- Verdict
- FAIR
- Comps
- 6 within 1.0 mi
Show comp detail 4 sales within ~0.75 mi
| Address | Dist | Beds/Ba | Sqft | Sold | Price | $/sf | Match |
|---|---|---|---|---|---|---|---|
| 510 Cain St | 0.24mi | 2/1.0 (-1) | 1,226 (-1%) | 3mo | $90,000 | $73 | 81 |
| 707 W 4th St | 0.32mi | 2/1.0 (-1) | 1,220 (-1%) | 20mo | $40,000 | $33 | 62 |
| 102 E 7th St | 0.59mi | 2/1.0 (-1) | 1,178 (-5%) | 3mo | $70,000 | $59 | 57 |
| 406 W 15th St | 0.59mi | 2/1.0 (-1) | 1,093 (-12%) | 10mo | $65,000 | $59 | 40 |
Match score weights: distance 35% · size 25% · config 20% · recency 20%. Top-matched comps best support the ARV.
Projected returns pro-forma
3.0% appreciation · 3.0% rent growth · sell at horizon
- IRR
- 41.5%
- Equity multiple
- 3.33×
- Total profit
- $37,897
- Equity at exit
- $26,079
- IRR
- 41.4%
- Equity multiple
- 6.64×
- Total profit
- $91,591
- Equity at exit
- $40,191
Cash invested: $16,240 (down + closing). Projections, not guarantees.
Landlord ↔ Tenant lean methodology
- Overall (STATE)
- 87 Strongly Landlord-Friendly
- State Texas
- 87 Strongly Landlord-Friendly · R+5
- County
- — inherits STATE
- City
- — inherits STATE
ZIP-level market 79252
- Active inventory
- 26
- Price-to-rent
- 4.5×
Monthly cashflow live
- Estimated rent
- $1,081 medium interval (Pro) →
- Mortgage (P&I)
- −$304
- Tax from tax record
- −$40 /mo · $483/yr
- Insurance
- −$24
- HOA
- −$0
- Vacancy / Maint / Mgmt
- −$227
- Net cashflow
- $485
Break-even live
Sensitivity live
| Price | -10% $518 | -5% $502 | +0% $485 | +5% $469 | +10% $453 |
|---|---|---|---|---|---|
| Rent | -10% $400 | -5% $443 | +0% $485 | +5% $528 | +10% $571 |
| Rate | -1.0pp $515 | -0.5pp $500 | base $485 | +0.5pp $470 | +1.0pp $455 |
UW: 25.0% down · 7.5% · 30yr · 1.5% tax · 5.0% vac · 8.0% maint · 8.0% mgmt
Financing live
Cash to close
- Down payment
- $14,500
- Closing costs
- $1,740
- Reserves months
- —
- Total cash needed
- —
Loan-product check · same deal, 3 products live
Conventional
25% down · 7.5% · 30yr
- Down + closing
- —
- Monthly P&I
- —
- Monthly cashflow
- —
- DSCR
- —
- Eligible?
- —
Personal DTI + credit; lowest rate.
DSCR
20% down · 8.5% · 30yr
- Down + closing
- —
- Monthly P&I
- —
- Monthly cashflow
- —
- DSCR
- —
- Eligible?
- —
No personal income docs; deal must DSCR.
Hard money
10% down · 12.0% · 12mo
- Down + closing
- —
- Monthly P&I
- —
- Monthly cashflow
- —
- DSCR
- —
- Eligible?
- —
Short-term bridge; refi at stabilization.
Listing history 38 events
-
2026-06-21days on market $58,000 Active 186 DOM
-
2026-06-18days on market $58,000 Active 184 DOM
-
2026-06-17days on market $58,000 Active 183 DOM
-
2026-06-16days on market $58,000 Active 182 DOM
-
2026-06-15days on market $58,000 Active 181 DOM
-
2026-06-15days on market $58,000 Active 180 DOM
-
2026-06-13days on market $58,000 Active 179 DOM
-
2026-06-12days on market $58,000 Active 178 DOM
-
2026-06-09days on market $58,000 Active 175 DOM
-
2026-06-08days on market $58,000 Active 174 DOM
-
2026-06-08days on market $58,000 Active 173 DOM
-
2026-06-07days on market $58,000 Active 172 DOM
-
2026-06-03days on market $58,000 Active 169 DOM
-
2026-06-02days on market $58,000 Active 168 DOM
-
2026-06-01days on market $58,000 Active 167 DOM
-
2026-05-31days on market $58,000 Active 166 DOM
-
2026-01-12historical $1,000
-
2025-12-30price $1,000
-
2025-12-17$900
-
2025-12-17historical $900
-
2025-12-16$58,000 Active 216-char remark
Show marketing remark (216 chars)
This Home 3 Bedrooms , Full Bathroom , Dining Room, Living Room, Fenced Backyard, Located Two Blocks From United Supermarket ,and 3 Blocks From Loves Truck Stop, also for sale or rent to own, Listing agent is owner
-
2025-12-15historical
-
2025-12-04$900
-
2025-08-09historical $599
-
2025-07-08$599
-
2025-06-30historical $599
-
2025-04-04price $599
-
2025-02-25$799
-
2025-02-24$48,000 Active
-
2023-07-14soldstatus Sold
-
2022-10-30$38,000 Active
-
2022-05-24status Pending
-
2022-05-23historical
-
2022-03-12$29,950 Active
-
2022-03-04historical
-
2021-12-12status Active
-
2021-12-06status Option Pending
-
2021-11-11$28,500 Active
ⓘ Source: listings_history table (triggers on properties + properties_extension) + one-shot
backfill from property_details.listing_events for pre-trigger history.
Tax reassessment forecast TX · Resets to sale price
- Current annual tax
- $483 · $40/mo
- Projected year-2 tax
- $1,061 · $88/mo
- Expected delta
- +$578/yr (+$48/mo · 119.6%)
ⓘ Screening estimate from a state-policy table — verify with the county assessor before closing.
Climate risk First Street
- Flood 1/10 Low 0% chance over 30 yrs
- Wildfire 5/10 Major
- Heat 6/10 Major 6 d/yr ≥107°F today · 17 d/yr by 30 yrs out
- Wind 3/10 Moderate 6% chance of damaging wind over 30 yrs
- Air quality 1/10 Low 0 unhealthy d/yr today · 0 by 30 yrs out
Nearby sold comps map
Loading sold comps map…
Walkable amenities ~0.75 mi
Loading nearby amenities…
Taxation est. · year 1
- Rental income
- $12,972
- − Mortgage interest
- −$3,249
- − Property taxes
- −$483
- − Insurance
- −$290
- − Repairs & maintenance
- −$1,038
- − Management
- −$1,038
- − Depreciation
- −$1,687
- Taxable income
- $5,187
- Est. tax owed @ 24.0%
- −$1,245
- After-tax cash flow
- $4,580/yr
For passive investors: Depreciation is non-cash, so a rental often shows a tax loss while cash-flowing — sheltering income. Rental losses are passive: they offset passive income freely, and up to $25,000/yr can offset ordinary (W-2) income if you actively participate and your MAGI is under $100k (phasing out to $0 by $150k); unused losses carry forward. On sale, claimed depreciation is recaptured at up to 25%, and gains may owe capital-gains tax (a 1031 exchange can defer both). Figures are a year-1 estimate at your 24.0% rate — not tax advice; consult a CPA.
Schools (NCES district)
- District
- Quanah ISD
- NCES district ID
- 4836180
- Math proficiency
- 44% ▲ 4.00%
- Reading proficiency
- 37% ▼ -5.00%
- Median HH income
- $36,117
- Composite
- 33.62/100
- National rank
- #5406
- State rank
- #432 of 826 in TX
Livability — Quanah
- Score
- 76/100
- State rank
- #116
- US rank
- #3745
Category grades
Schools grade is shown separately in the Schools card above.
Census & demographics
- Census place
- Quanah, TX
- Population (ZIP)
- 2,642
Population outlook (Hardeman County) Hauer SSP2
- Today (2025)
- 3,541 people
- By 2030
- 3,375 · -4.7%
- By 2040
- 3,066 · -13.4%
- By 2050
- 2,784 · -21.4%
- By 2075
- 2,057 · -41.9%
- By 2100
- 1,406 · -60.3%
Race, ethnicity, and origin ACS 2023
- Neighborhood character
- Predominantly White (66%)
- Race & ethnicity
- White 66% Hispanic / Latino 28% Two or more races 15% Asian 2%
- Hispanic origin (detail)
- Mexican 21% Puerto Rican 2% Cuban 2%
- Common ancestry
- American 1% Lithuanian 1% Italian 1%
- Foreign-born
- 5% · Canada, Vietnam
- Languages at home
- 87% English-only · Spanish 8% Other Indo-European 1% Chinese 1%
Political lean MEDSL · Hardeman
- 2024 margin
- Solid R (+72.7) · D 13.4% · R 86.1%
- 2008→2024 swing
- -21.0pp toward R · 2008: -51.8pp · 2024: -72.7pp
- All cycles
- 2024: R+72.7 2020: R+68.9 2016: R+63.4 2012: R+58.5 2008: R+51.8
Not yet ingested
- Civics
- —
Market trends
- HPI YoY
- —
- Current HPI
- —
- Rent YoY
- —
- Metro
- —
- State GDP YoY
- ▲ 3.95%
- F500 in state
- 110
Industry mix (Fortune 500 HQ in TX)
| Industry | F500 HQs | Revenue |
|---|---|---|
| Energy | 16 | $1,198B |
|
||
| Technology | 5 | $198B |
|
||
| Engineering / Construction | 4 | $72B |
|
||
| Energy Services | 3 | $60B |
|
||
| Utilities | 3 | $41B |
|
||
| Healthcare | 2 | $330B |
|
||
Price history
-96.5% since first listed22 events — show timeline
- 2026-01-12 Rental Removed $1,000 HARMLS
- 2025-12-30 Price Changed $1,000 HARMLS
- 2025-12-17 Listed for Rent $900 HARMLS
- 2025-12-17 Rental Removed $900 HARMLS
- 2025-12-16 Listed $58,000 HARMLS
- 2025-12-15 Listing Removed — HARMLS
- 2025-12-04 Listed for Rent $900 HARMLS
- 2025-08-09 Rental Removed $599 HARMLS
- 2025-07-08 Listed for Rent $599 HARMLS
- 2025-06-30 Rental Removed $599 HARMLS
- 2025-04-04 Price Changed $599 HARMLS
- 2025-02-25 Listed for Rent $799 HARMLS
- 2025-02-24 Listed $48,000 HARMLS
- 2023-07-14 Sold (MLS) — HARMLS
- 2022-10-30 Listed $38,000 HARMLS
- 2022-05-24 Pending — HARMLS
- 2022-05-23 Listing Removed — HARMLS
- 2022-03-12 Listed $29,950 HARMLS
- 2022-03-04 Listing Removed — HARMLS
- 2021-12-12 Relisted — HARMLS
- 2021-12-06 Pending — HARMLS
- 2021-11-11 Listed $28,500 HARMLS
Property tax history
+2.9%/yrLatest (2025): $483 · +2.9% YoY. Source: county tax records.
Cash-flow waterfall
monthlySold comps — $/sqft
last 12 mo · ≤1 miLoading sold comps…