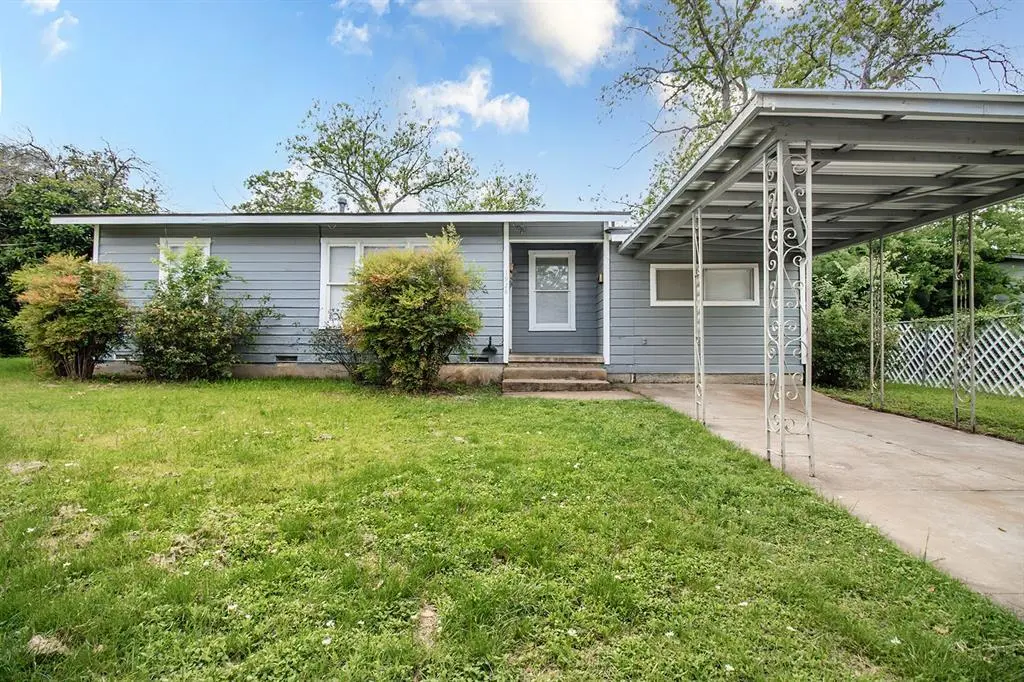
1928 S Walnut St · Brady, TX
Flood risk 1/10 · Minimal
- FEMA flood zone
- —
- Chance of flooding over 30 yrs
- 0.0%
- Est. flood insurance / yr
- —
Fire risk 5/10 · Moderate
- Est. fire insurance / yr
- $1,222 – $2,270
Heat risk 6/10 · Moderate
- Hot days now (above 105°F)
- 6 days/yr
- Hot days in 30 yrs
- 18 days/yr
Wind risk 6/10 · Moderate
- Chance of severe wind over 30 yrs
- 27.0%
Air-quality risk 1/10 · Minimal
- Unhealthy air days now
- 0 days/yr
- Unhealthy air days in 30 yrs
- 0 days/yr
Risk factors via First Street. Map © Google.
Why this score? — see what drove the C- grade
The composite is a weighted blend of 9 inputs, each scored 0–100. Each bar is that input's sub-score; the figure is the points it added to the 100-point composite (weight × sub-score).
- ARV discount +15.0/15.0
- Cash flow +12.2/30.0
- Appreciation +8.3/10.0
- Schools +4.0/10.0
- DSCR +3.6/10.0
- Livability +3.6/5.0
- 1% rule +3.3/10.0
- Rent growth +2.5/5.0
- Condition / age +2.5/5.0
$115,000
🖨 Deal sheet (PDF) 📄 Offer letter ✓ Due diligence
Listing remarks
Affordable Charm in the Heart of Brady! Welcome to this inviting 3-bedroom, 1-bath home featuring beautiful hardwood floors and a functional layout designed to meet your everyday needs. The welcoming kitchen offers a great setup for cooking and gathering, while the interior washer and dryer area adds everyday convenience. Step outside to enjoy the fenced backyard, perfect for pets, playtime, or relaxing evenings. Located in a nice, established neighborhood, this home comes with an aggressively priced tag, making it a fabulous option in today's market for buyers looking for value and comfort in Brady. Whether you're a first-time buyer, downsizing or searching for an investment opportunity, t
Key facts
- Welcoming kitchen
- Fenced backyard
- Hardwood floors
Tags
Property features AI
Finance
- Financial info: Treat as clear loan type; No second mortgage
- HOA & community: No homeowners association
Exterior
- Parking: Carport (covered) with 1 covered/carport space; No garage
- Utilities: City water; City sewer; Electricity available; Individual gas meter; Cable available; Not in a municipal utility district
- Home design: Single family residence; Residential property; One level
- Construction: Built in 1950; Shingle roof; Slab foundation
- Exterior features: Less than 0.5 acre lot; Subdivision: Stanburn; Directions: From the courthouse, head south on Bridge Street and take a right onto 17th Street, at the light. Continue straight and take a left onto Walnut Street. Destination will be on your right-hand side.
Interior
- Kitchen: Electric oven; Microwave; Refrigerator
- Bedrooms: 3 bedrooms (primary bedroom on main level)
- Flooring: Hardwood flooring
- Bathrooms: 1 full bathroom
- Interior features: Cable TV available; One living area; One dining area; Room count: 2
- Laundry & utility: Washer hookup
Neighborhood map
What this means for you Summary
Snapshot
- This is a 3-bed/1.0-bath single-family listed at $115k.
Deal economics
- At list price, monthly cash flow is $-23 ($-276/yr) — negative.
- To cash-flow at today's rent, offer at most $111k (3.5% below list).
- To meet the 1% rule (rent ≥ 1% of price), the offer needs to be $95k (17.4% below list).
- Recommended offer: $95k (17.4% below list) — sets the bar for 1% rule.
- Cap rate 6.1% vs local median 3.3% in Brady — top-decile yield for the area; either an underpriced asset or a hidden risk that comps aren't pricing in. Stress-test before assuming the spread holds.
Location & tenants
- Location reads 72/100 on livability (#270 in TX) — a middle-class / working-renter tenant base. Strengths: cost of living A+, housing A+, health & safety A+; Watch: employment D, amenities F, commute F.
- Brady ISD (rural): math 50% / reading 46% proficiency, ranked #238 of 826 in TX (top 29%) — families likely to look elsewhere, expect single-tenant / working-renter base with shorter leases.
- Zoned schools: Brady El (math 33% / reading 34%, grade F, #2,174 of 4,322 statewide, top 51%, 476 students, 74% FRL); Brady Middle (math 61% / reading 50%, grade B-, #240 of 1,662 statewide, top 15%, 180 students, 58% FRL); Brady H S (math 62% / reading 67%, grade B-, #199 of 1,632 statewide, top 14%, 300 students, 58% FRL).
- Market conditions: 105 active listings in the ZIP; 1 comparable units currently listed for rent nearby; 2 units permitted in McCulloch County in 2024 (0 in 5+ unit buildings).
Forward outlook
- In year one you build about $8k of equity ($795 loan paydown + $8k appreciation (6.5% local appreciation)).
- At projected returns (6.5% appreciation + 3.0% rent growth), your $32k cash investment doubles in ~4 years — after that, you're playing with house money.
- By year 5, paydown + projected appreciation supports a ~$37k cash-out refi (75% LTV) — recoverable capital for the next deal without selling this one.
Negotiation context
- It's been on market 59 days — a 3% lower offer ($112k) is reasonable based on typical stale-listing flexibility.
Risks & watch-outs
- Watch-outs: built in 1950 — expect roof / HVAC / electrical / plumbing capex.
- Climate carrying-cost: major wind risk, 27% chance of damaging wind over 30y; moderate wildfire risk; extreme-heat days projected 6→18/yr by 2055 (HVAC capex compounding) — expect insurance premiums to compound above CPI over the hold.
Questions for the listing agent
- What do current leases actually rent for vs. the listed asking? Can we see a recent rent roll and the last 12 months of T-12 income?
- It's been on market 59 days. Have you received any prior offers? Is the seller open to a 17% concession, seller financing, or rate buy-down credit?
- Built in 1950 — when were the roof, HVAC, electrical panel, plumbing, and water heater last replaced?
- Is there a deadline driving the sale (1031 exchange, divorce, estate, relocation)? That informs how much negotiation room exists.
- Schools are D-rated, which usually means shorter tenancies and higher turnover. Who's the typical renter profile here, and what's been the actual vacancy rate?
- What's the average days-on-market for RENTAL listings here right now (not sales)? A rising rental-DOM trend means longer vacancies and softer asking-rent achievability than the comps imply.
- What's the recent tenant-quality profile in this submarket — average credit score on applications, eviction rate, late-payment / NSF rate, and stable-employment percentage? A property-management company in the area should have these aggregated.
- How much new for-sale + rental construction is in the pipeline within 1–3 miles? Heavy new supply typically softens prices + rents 12–24 months out; constrained supply supports both.
Investment metrics
- 1% rule
- 0.83% ✗
- Cap rate
- 6.05%
- Cash-on-cash
- -0.86%
- DSCR
- 0.96
- GRM
- 10.1
CMA / ARV
- ARV (median comp)
- $138,052
- List price
- $115,000
- Delta
- -16.70%
- Verdict
- UNDERPRICED
- Comps
- 20 within 1.0 mi
Show comp detail 9 sales within ~0.75 mi
| Address | Dist | Beds/Ba | Sqft | Sold | Price | $/sf | Match |
|---|---|---|---|---|---|---|---|
| 900 Sagemont Dr | 0.20mi | 3/1.0 | 988 (-8%) | 7mo | $149,000 | $151 | 71 |
| 310 Otte | 0.22mi | 3/2.0 | 1,171 (+9%) | 4mo | $130,000 | $111 | 68 |
| 911 Calcutta St | 0.36mi | 3/1.0 | 988 (-8%) | 11mo | $95,000 | $96 | 60 |
| 909 Calcutta | 0.35mi | 3/2.0 | 1,174 (+9%) | 6mo | $130,000 | $111 | 60 |
| 1807 S Bradley | 0.49mi | 2/1.0 (-1) | 1,024 (-5%) | 9mo | $129,900 | $127 | 56 |
| 1604 S Blackburn St | 0.52mi | 2/1.0 (-1) | 1,080 (+0%) | 18mo | $99,900 | $93 | 55 |
| 1408 Bridge | 0.62mi | 2/2.0 (-1) | 1,130 (+5%) | 5mo | $155,000 | $137 | 50 |
| 1701 S High St | 0.41mi | 2/1.5 (-1) | 1,173 (+9%) | 16mo | $139,000 | $118 | 46 |
| 1410 S College Dr | 0.57mi | 2/1.0 (-1) | 1,198 (+11%) | 18mo | $136,500 | $114 | 34 |
Match score weights: distance 35% · size 25% · config 20% · recency 20%. Top-matched comps best support the ARV.
Projected returns pro-forma
6.53% appreciation · 3.0% rent growth · sell at horizon
- IRR
- 15.9%
- Equity multiple
- 2.10×
- Total profit
- $35,377
- Equity at exit
- $76,163
- IRR
- 15.8%
- Equity multiple
- 4.24×
- Total profit
- $104,364
- Equity at exit
- $141,589
Cash invested: $32,200 (down + closing). Projections, not guarantees.
Landlord ↔ Tenant lean methodology
- Overall (STATE)
- 87 Strongly Landlord-Friendly
- State Texas
- 87 Strongly Landlord-Friendly · R+5
- County
- — inherits STATE
- City
- — inherits STATE
ZIP-level market 76825
- Home prices YoY
- 4.2%
- Active inventory
- 105
- Price-to-rent
- 10.1×
Monthly cashflow live
- Estimated rent
- $950 medium interval (Pro) →
- Mortgage (P&I)
- −$603
- Tax from tax record
- −$123 /mo · $1,470/yr
- Insurance
- −$48
- HOA
- −$0
- Vacancy / Maint / Mgmt
- −$200
- Net cashflow
- $-23
Break-even live
Sensitivity live
| Price | -10% $42 | -5% $10 | +0% $-23 | +5% $-56 | +10% $-88 |
|---|---|---|---|---|---|
| Rent | -10% $-98 | -5% $-61 | +0% $-23 | +5% $15 | +10% $52 |
| Rate | -1.0pp $35 | -0.5pp $6 | base $-23 | +0.5pp $-53 | +1.0pp $-83 |
UW: 25.0% down · 7.5% · 30yr · 1.5% tax · 5.0% vac · 8.0% maint · 8.0% mgmt
Financing live
Cash to close
- Down payment
- $28,750
- Closing costs
- $3,450
- Reserves months
- —
- Total cash needed
- —
Loan-product check · same deal, 3 products live
Conventional
25% down · 7.5% · 30yr
- Down + closing
- —
- Monthly P&I
- —
- Monthly cashflow
- —
- DSCR
- —
- Eligible?
- —
Personal DTI + credit; lowest rate.
DSCR
20% down · 8.5% · 30yr
- Down + closing
- —
- Monthly P&I
- —
- Monthly cashflow
- —
- DSCR
- —
- Eligible?
- —
No personal income docs; deal must DSCR.
Hard money
10% down · 12.0% · 12mo
- Down + closing
- —
- Monthly P&I
- —
- Monthly cashflow
- —
- DSCR
- —
- Eligible?
- —
Short-term bridge; refi at stabilization.
Rent comps 1 comps
| Address | Beds | Baths | Sqft | Rent | $/sqft | DOM | Units | Dist |
|---|---|---|---|---|---|---|---|---|
| 2030 Menard Hwy Unit 6 Brady, TX | 2.0 | 1.0 | 804 | $950 | $1.18 | 45d | 1 | 0.32mi |
Listing history 19 events
-
2026-06-21days on market $115,000 Active 59 DOM
-
2026-06-21days on market $115,000 Active 58 DOM
-
2026-06-18days on market $115,000 Active 56 DOM
-
2026-06-17days on market $115,000 Active 55 DOM
-
2026-06-16days on market $115,000 Active 54 DOM
-
2026-06-15days on market $115,000 Active 53 DOM
-
2026-06-13days on market $115,000 Active 51 DOM
-
2026-06-12days on market $115,000 Active 50 DOM
-
2026-06-09days on market $115,000 Active 47 DOM
-
2026-06-08days on market $115,000 Active 46 DOM
-
2026-06-08days on market $115,000 Active 45 DOM
-
2026-06-05days on market $115,000 Active 43 DOM
-
2026-06-03days on market $115,000 Active 41 DOM
-
2026-06-02days on market $115,000 Active 40 DOM
-
2026-06-01days on market $115,000 Active 39 DOM
-
2026-05-31days on market $115,000 Active 38 DOM
-
2026-04-21$115,000 Active 765-char remark
-
2003-05-16soldstatus
-
1999-08-09soldstatus
ⓘ Source: listings_history table (triggers on properties + properties_extension) + one-shot
backfill from property_details.listing_events for pre-trigger history.
Tax reassessment forecast TX · Resets to sale price
- Current annual tax
- $1,470 · $123/mo
- Projected year-2 tax
- $2,104 · $175/mo
- Expected delta
- +$634/yr (+$53/mo · 43.2%)
ⓘ Screening estimate from a state-policy table — verify with the county assessor before closing.
Climate risk First Street
- Flood 1/10 Low 0% chance over 30 yrs
- Wildfire 5/10 Major
- Heat 6/10 Major 6 d/yr ≥105°F today · 18 d/yr by 30 yrs out
- Wind 6/10 Major 27% chance of damaging wind over 30 yrs
- Air quality 1/10 Low 0 unhealthy d/yr today · 0 by 30 yrs out
Nearby sold comps map
Loading sold comps map…
Walkable amenities ~0.75 mi
Loading nearby amenities…
Taxation est. · year 1
- Rental income
- $11,400
- − Mortgage interest
- −$6,442
- − Property taxes
- −$1,470
- − Insurance
- −$575
- − Repairs & maintenance
- −$912
- − Management
- −$912
- − Depreciation
- −$3,345
- Taxable loss
- −$2,256
- Est. tax savings @ 24.0%
- +$542
- After-tax cash flow
- $266/yr
For passive investors: Depreciation is non-cash, so a rental often shows a tax loss while cash-flowing — sheltering income. Rental losses are passive: they offset passive income freely, and up to $25,000/yr can offset ordinary (W-2) income if you actively participate and your MAGI is under $100k (phasing out to $0 by $150k); unused losses carry forward. On sale, claimed depreciation is recaptured at up to 25%, and gains may owe capital-gains tax (a 1031 exchange can defer both). Figures are a year-1 estimate at your 24.0% rate — not tax advice; consult a CPA.
Schools (NCES district)
- District
- Brady ISD
- NCES district ID
- 4811110
- Math proficiency
- 50% ▼ -2.00%
- Reading proficiency
- 46% ▲ 2.00%
- Median HH income
- $38,179
- Composite
- 40.02/100
- National rank
- #3826
- State rank
- #238 of 826 in TX
Livability — Brady
- Score
- 72/100
- State rank
- #270
- US rank
- #6336
Category grades
Schools grade is shown separately in the Schools card above.
Census & demographics
- Census place
- Brady, TX
- Population (ZIP)
- 6,595
Population outlook (McCulloch County) Hauer SSP2
- Today (2025)
- 8,509 people
- By 2030
- 8,544 · +0.4%
- By 2040
- 8,555 · +0.5%
- By 2050
- 8,486 · -0.3%
- By 2075
- 8,089 · -4.9%
- By 2100
- 6,599 · -22.4%
Race, ethnicity, and origin ACS 2023
- Neighborhood character
- Majority White (60%)
- Race & ethnicity
- White 60% Hispanic / Latino 33% Two or more races 21%
- Hispanic origin (detail)
- Mexican 30%
- Common ancestry
- Italian 8% Lithuanian 3% Portuguese 2%
- Foreign-born
- 6% · Canada, Vietnam
- Languages at home
- 72% English-only · Spanish 27%
Political lean MEDSL · McCulloch
- 2024 margin
- Solid R (+73.4) · D 12.9% · R 86.3%
- 2008→2024 swing
- -22.4pp toward R · 2008: -51.0pp · 2024: -73.4pp
- All cycles
- 2024: R+73.4 2020: R+70.3 2016: R+67.0 2012: R+62.9 2008: R+51.0
Not yet ingested
- Civics
- —
Market trends
- HPI YoY
- ▲ 6.53%
- Current HPI
- 161.5061
- Rent YoY
- —
- Metro
- —
- State GDP YoY
- ▲ 3.95%
- F500 in state
- 110
Industry mix (Fortune 500 HQ in TX)
| Industry | F500 HQs | Revenue |
|---|---|---|
| Energy | 16 | $1,198B |
|
||
| Technology | 5 | $198B |
|
||
| Engineering / Construction | 4 | $72B |
|
||
| Energy Services | 3 | $60B |
|
||
| Utilities | 3 | $41B |
|
||
| Healthcare | 2 | $330B |
|
||
Price history
3 events — show timeline
- 2026-04-21 Listed $115,000 NTREIS
- 2003-05-16 Sold (Public Records) — Public Records
- 1999-08-09 Sold (Public Records) — Public Records
Property tax history
+7.4%/yrLatest (2025): $1,470 · +4.8% YoY. Source: county tax records.
Cash-flow waterfall
monthlySold comps — $/sqft
last 12 mo · ≤1 miLoading sold comps…