 Fourplex
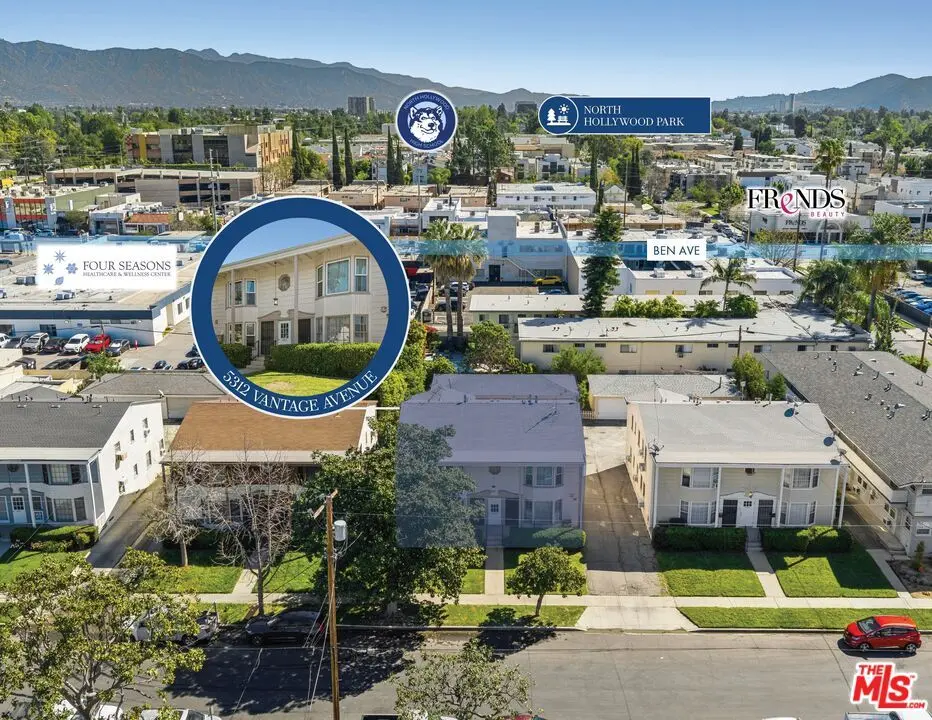
5312 Vantage Ave · Los Angeles, CA
Flood risk 1/10 · Minimal
- FEMA flood zone
- X (unshaded)
- Chance of flooding over 30 yrs
- 0.0%
- Est. flood insurance / yr
- $507 – $1,088
Fire risk 1/10 · Minimal
- Est. fire insurance / yr
- $659 – $1,223
Heat risk 6/10 · Moderate
- Hot days now (above 97°F)
- 8 days/yr
- Hot days in 30 yrs
- 23 days/yr
Wind risk 1/10 · Minimal
- Chance of severe wind over 30 yrs
- —
Air-quality risk 5/10 · Moderate
- Unhealthy air days now
- 7 days/yr
- Unhealthy air days in 30 yrs
- 9 days/yr
Risk factors via First Street. Map © Google.
Why this score? — see what drove the C+ grade
The composite is a weighted blend of 9 inputs, each scored 0–100. Each bar is that input's sub-score; the figure is the points it added to the 100-point composite (weight × sub-score).
- Cash flow +26.1/30.0
- ARV discount +9.5/15.0
- DSCR +8.8/10.0
- 1% rule +6.6/10.0
- Schools +3.6/10.0
- Livability +3.4/5.0
- Condition / age +2.5/5.0
- Rent growth +2.2/5.0
- Appreciation +0.0/10.0
$1,298,000
🖨 Deal sheet 📄 Offer letter ✓ Due diligence
Multi-family units
County records classify this as Multi-Family (2-4 Unit). Listing-text estimate: 4 units. confirmed
Listing remarks
5312 Vantage Avenue is a 4-unit multifamily asset located in the highly desirable Valley Village submarket of Los Angeles. The property benefits from proximity to Lankershim Boulevard and Magnolia Boulevard, placing residents within immediate reach of a diverse mix of dining, retail, and entertainment options including Harvest Moon Cafe, Starbucks, Gelson's and NOHO West, as well as everyday retail such as Trader Joe's and Ralphs. The surrounding area is supported by major employment centers including Providence Health, Universal Studios, and Kaiser Permanente, which continue to drive strong and consistent rental demand. Constructed in 1953, the property consists of a 3,348 square foot buil
Key facts
- Multifamily asset
- 0.17-acre lot
- Constructed in 1953
Tags
Property features AI
Finance
- Other: Number of buildings: 1
- Financial info: Gross income: $86,048; Gross operating income: $84,187; Net operating income: $53,406; Total annual expenses: $30,780; Cap rate: 4.11%; Gross rent multiplier: 14.96; Income status: Scheduled; Unit rents (current): Two 2-bed units at $2,142 each; Two 1-bed units at $1,443 each; Unit projected rents: 2-bed unit projected $5,600; 1-bed unit projected $4,500; Unit actual rents (reported): 2-bed units $4,284.60 total; 1-bed units $2,886 total
- HOA & community: Four total units in the complex
Exterior
- Parking: Detached garage; Five parking spaces (total)
- Home design: Residential income property; Multi-level building; Zoning: LAR3
- Exterior features: No other structures
Interior
- Kitchen: Refrigerator; Range/Oven
- Bedrooms: Two 2-bed units; Two 1-bed units
- Bathrooms: Four 1-bath units
- Heating & cooling: No central cooling; No central heat
- Interior features: Laundry area; Refrigerator; Range/Oven
- Laundry & utility: Laundry area
Neighborhood map
What this means for you Summary
Snapshot
- This is a 4 × 6-bed/4.0-bath units multifamily listed at $1.30M.
Deal economics
- At list price, monthly cash flow is $3k ($39k/yr) — positive. Per door: $813/mo.
- The deal already cash-flows at list — no discount required.
- Meets the 1% rule at list price ($15k rent vs $1.30M).
- Recommended offer: $1.28M (1.5% below list) — sets the bar for market timing.
- Cap rate 9.3% vs local median 2.1% in Los Angeles — top-decile yield for the area; either an underpriced asset or a hidden risk that comps aren't pricing in. Stress-test before assuming the spread holds.
Location & tenants
- Location reads 68/100 on livability (#273 in CA) — a middle-class / working-renter tenant base. Strengths: amenities A+, commute A+, employment B; Watch: health & safety C-, schools D+, crime F.
- Los Angeles Unified (urban): math 29% / reading 54% proficiency, ranked #223 of 517 in CA (top 43%) — families likely to look elsewhere, expect single-tenant / working-renter base with shorter leases; 67% free/reduced lunch — lower-income household profile, screen leases tightly.
- Market conditions: Rents soft (-1.1%/yr); 90 active listings in the ZIP; 8 comparable units currently listed for rent nearby; rentals at typical pace (median 25d on market — plan ~3-4 weeks tenant-placement turnaround); solid renter incomes; 19,697 units permitted in Los Angeles County in 2024 (9,426 in 5+ unit buildings).
- At $15,062/mo this rent would consume 206% of the median local household income ($88k/yr) (locally 3099% of renters already pay >50% of income on rent) — very limited rent-growth headroom before tenants either downsize or default.
Forward outlook
- Local home prices are declining (-3.0%/yr); year-one equity from $9k of loan paydown is wiped out by about $39k of value loss. Plan a longer hold.
- Los Angeles County population projected at +9% by 2050 — modest demand growth; plan on rents tracking national, not racing it.
Negotiation context
- It's been on market 20 days — a 2% lower offer ($1.28M) is reasonable based on typical stale-listing flexibility.
- 5 sale attempts since 12y ago with the ask held roughly flat each time — persistent listings suggest the price (not the market) is what's stuck; bring a comps-based counter.
- Current owner paid $1.05M; 24% above their basis — modest negotiation headroom, anchor on the comps not their cost.
Risks & watch-outs
- Watch-outs: built in 1953 — expect roof / HVAC / electrical / plumbing capex.
- Climate carrying-cost: extreme-heat days projected 8→23/yr by 2055 (HVAC capex compounding) — expect insurance premiums to compound above CPI over the hold.
Questions for the listing agent
- Can we see the unit-by-unit rent roll, current vacancy, and any below-market leases? What's the average tenancy length?
- What capital expenditures (roof, boiler, parking lot, exteriors) have been made in the last 5 years, and what's planned in the next 2?
- Built in 1953 — when were the roof, HVAC, electrical panel, plumbing, and water heater last replaced?
- Is there a deadline driving the sale (1031 exchange, divorce, estate, relocation)? That informs how much negotiation room exists.
- Schools are D-rated, which usually means shorter tenancies and higher turnover. Who's the typical renter profile here, and what's been the actual vacancy rate?
- Crime grade is F in this area — have there been break-ins, vandalism, or insurance claims at this property in the last 3 years? What carrier currently insures it and at what premium?
- What's the average days-on-market for RENTAL listings here right now (not sales)? A rising rental-DOM trend means longer vacancies and softer asking-rent achievability than the comps imply.
- What's the recent tenant-quality profile in this submarket — average credit score on applications, eviction rate, late-payment / NSF rate, and stable-employment percentage? A property-management company in the area should have these aggregated.
- How much new apartment / multifamily construction is in the pipeline within 1–3 miles? Heavy new supply (>2% of stock underway) typically softens rents 12–24 months out; light construction supports rent growth.
Investment metrics
- 1% rule
- 1.16% ✓
- Cap rate
- 9.30%
- Cash-on-cash
- 10.74%
- DSCR
- 1.48
- GRM
- 7.2
CMA / ARV
- ARV (median comp)
- $1,356,894
- List price
- $1,298,000
- Delta
- -4.34%
- Verdict
- FAIR
- Comps
- 20 within 1.0 mi
Show comp detail 3 sales within ~0.75 mi
| Address | Dist | Beds/Ba | Sqft | Sold | Price | $/sf | Match |
|---|---|---|---|---|---|---|---|
| 5312 Vantage Ave | 0.00mi | 6/4.0 | 3,348 (0%) | 1mo | $1,050,000 | $314 | 99 |
| 5318 Vantage Ave | 0.01mi | 6/4.0 | 3,348 (0%) | 10mo | $745,000 | $223 | 91 |
| 12032 Magnolia Blvd | 0.22mi | 6/5.0 | 3,670 (+10%) | 18mo | $1,355,000 | $369 | 55 |
Match score weights: distance 35% · size 25% · config 20% · recency 20%. Top-matched comps best support the ARV.
Projected returns pro-forma
-3.0% appreciation · 0.0% rent growth · sell at horizon
- IRR
- -3.6%
- Equity multiple
- 0.87×
- Total profit
- $-47,254
- Equity at exit
- $193,536
- IRR
- 2.4%
- Equity multiple
- 1.15×
- Total profit
- $55,170
- Equity at exit
- $112,227
Cash invested: $363,440 (down + closing). Projections, not guarantees.
Landlord ↔ Tenant lean methodology
- Overall (CITY)
- 0 Strongly Tenant-Friendly
- State California
- 18 Strongly Tenant-Friendly · D+13
- County
- — inherits STATE
- City Los Angeles
- 0 Strongly Tenant-Friendly · D+22
ZIP-level market 91607
- Rents YoY
- -1.1%
- Active inventory
- 90
- Price-to-rent
- 28.7×
Monthly cashflow live
- Estimated rent
- $15,062 medium interval (Pro) →
- Mortgage (P&I)
- −$6,807
- Tax from tax record
- −$1,298 /mo · $15,579/yr
- Insurance
- −$541
- HOA
- −$0
- Vacancy / Maint / Mgmt
- −$3,163
- Net cashflow
- $3,253
Break-even live
4-unit breakdown (identical units grouped — click to expand)
| Units | Beds | Baths | Est. rent |
|---|---|---|---|
| 4× units | 6 | 4 | $15,060 |
| #1 | 6 | 4 | $3,765 |
| #2 | 6 | 4 | $3,765 |
| #3 | 6 | 4 | $3,765 |
| #4 | 6 | 4 | $3,765 |
| Total (4 units) | $15,062 | ||
UW: 25.0% down · 7.5% · 30yr · 1.5% tax · 5.0% vac · 8.0% maint · 8.0% mgmt
Financing live
Cash to close
- Down payment
- $324,500
- Closing costs
- $38,940
- Reserves months
- —
- Total cash needed
- —
Loan-product check · same deal, 3 products live
Conventional
25% down · 7.5% · 30yr
- Down + closing
- —
- Monthly P&I
- —
- Monthly cashflow
- —
- DSCR
- —
- Eligible?
- —
Personal DTI + credit; lowest rate.
DSCR
20% down · 8.5% · 30yr
- Down + closing
- —
- Monthly P&I
- —
- Monthly cashflow
- —
- DSCR
- —
- Eligible?
- —
No personal income docs; deal must DSCR.
Hard money
10% down · 12.0% · 12mo
- Down + closing
- —
- Monthly P&I
- —
- Monthly cashflow
- —
- DSCR
- —
- Eligible?
- —
Short-term bridge; refi at stabilization.
Rent comps 8 comps
| Address | Beds | Baths | Sqft | Rent | $/sqft | DOM | Units | Dist |
|---|---|---|---|---|---|---|---|---|
| 12249 Addison St North Hollywood, CA | 6.0 | 6.5 | 4231 | $24,500 | $5.79 | 1d | 1 | 0.40mi |
| 12041 Huston St Valley Village, CA | 5.0 | 5.0 | 4038 | $11,995 | $2.97 | 22d | 1 | 0.53mi |
| 12606 Emelita St Valley Village, CA | 5.0 | 3.5 | 3000 | $12,950 | $4.32 | 43d | 1 | 0.85mi |
| 4533 Farmdale Ave North Hollywood, CA | 5.0 | 5.5 | 3821 | $15,000 | $3.93 | 43d | 1 | 1.34mi |
| 5010 Fulton Ave Sherman Oaks, CA | 7.0 | 7.0 | 3286 | $15,500 | $4.72 | 43d | 1 | 1.43mi |
| 4627 Ethel Ave Sherman Oaks, CA | 5.0 | 5.0 | 3012 | $16,500 | $5.48 | 2d | 1 | 1.45mi |
| 4433 Kraft Ave North Hollywood, CA | 6.0 | 7.0 | 4000 | $23,950 | $5.99 | 1d | 1 | 1.48mi |
| 13339 Margate St Sherman Oaks, CA | 5.0 | 3.5 | 2619 | $15,995 | $6.11 | 24d | 1 | 1.49mi |
Listing history 10 events
-
2026-04-28$1,298,000 Active 1276-char remark
-
2022-11-03Active
-
2022-10-14status Active
-
2022-09-21historical Backup Offers Accepted
-
2022-09-13price
-
2022-08-02Active
-
2014-10-01soldstatus $1,050,000
-
2014-09-26soldstatus $1,050,000 Closed
-
2014-07-16status Pending
-
2014-06-19$999,000 Active
ⓘ Source: listings_history table (triggers on properties + properties_extension) + one-shot
backfill from property_details.listing_events for pre-trigger history.
Tax reassessment forecast CA · Resets to sale price
- Current annual tax
- $15,579 · $1,298/mo
- Projected year-2 tax
- $15,579 · $1,298/mo
- Expected delta
- $0/yr ($0/mo · 0.0%)
ⓘ Screening estimate from a state-policy table — verify with the county assessor before closing.
Climate risk First Street
- Flood 1/10 Low FEMA zone X (unshaded) · 0% chance over 30 yrs
- Wildfire 1/10 Low
- Heat 6/10 Major 8 d/yr ≥97°F today · 23 d/yr by 30 yrs out
- Wind 1/10 Low
- Air quality 5/10 Major 7 unhealthy d/yr today · 9 by 30 yrs out
Nearby sold comps map
Loading sold comps map…
Walkable amenities ~0.75 mi
Loading nearby amenities…
Taxation est. · year 1
- Rental income
- $180,744
- − Mortgage interest
- −$72,708
- − Property taxes
- −$15,579
- − Insurance
- −$6,490
- − Repairs & maintenance
- −$14,460
- − Management
- −$14,460
- − Depreciation
- −$37,760
- Taxable income
- $19,288
- Est. tax owed @ 24.0%
- −$4,629
- After-tax cash flow
- $34,408/yr
For passive investors: Depreciation is non-cash, so a rental often shows a tax loss while cash-flowing — sheltering income. Rental losses are passive: they offset passive income freely, and up to $25,000/yr can offset ordinary (W-2) income if you actively participate and your MAGI is under $100k (phasing out to $0 by $150k); unused losses carry forward. On sale, claimed depreciation is recaptured at up to 25%, and gains may owe capital-gains tax (a 1031 exchange can defer both). Figures are a year-1 estimate at your 24.0% rate — not tax advice; consult a CPA.
Schools (NCES district)
- District
- Los Angeles Unified
- NCES district ID
- 0622710
- Math proficiency
- 29% ▼ -4.00%
- Reading proficiency
- 54% ▲ 10.00%
- Median HH income
- $50,403
- Composite
- 35.67/100
- National rank
- #4875
- State rank
- #223 of 517 in CA
Livability — Los Angeles
- Score
- 68/100
- State rank
- #273
- US rank
- #9237
Category grades
Schools grade is shown separately in the Schools card above.
Census & demographics
- Census place
- Los Angeles, CA
- County
- Los Angeles County · 9,444,647 people
- City population
- 3,838,149
- Metro
- Los Angeles-Long Beach-Anaheim, CA
- Population (ZIP)
- 31,890
- Household income
- $87,874
- Rent vs Own
- Severe rent burden
- 3099.0
Population outlook (Los Angeles County) Hauer SSP2
- Today (2025)
- 10,940,515 people
- By 2030
- 11,256,481 · +2.9%
- By 2040
- 11,729,929 · +7.2%
- By 2050
- 11,948,407 · +9.2%
- By 2075
- 11,818,114 · +8.0%
- By 2100
- 10,842,928 · -0.9%
Race, ethnicity, and origin ACS 2023
- Neighborhood character
- Diverse neighborhood (Simpson 0.62)
- Race & ethnicity
- White 57% Hispanic / Latino 21% Two or more races 15% Asian 8% Black 7%
- Hispanic origin (detail)
- Mexican 11%
- Common ancestry
- Scotch-Irish 4% Romanian 3% Subsaharan African 2%
- Foreign-born
- 29% · Canada, Vietnam, Jamaica
- Languages at home
- 61% English-only · Spanish 16% Other Indo-European 9% Russian/Polish/Slavic 7%
Political lean MEDSL · Los Angeles
- 2024 margin
- Solid D (+32.9) · D 64.8% · R 31.9% · Other 3.3%
- 2008→2024 swing
- -7.4pp toward R · 2008: 40.4pp · 2024: 32.9pp
- All cycles
- 2024: D+32.9 2020: D+44.2 2016: D+48.0 2012: D+40.0 2008: D+40.4
Not yet ingested
- Civics
- —
Market trends
- HPI YoY
- ▼ -861.04%
- Current HPI
- 464.0519
- Rent YoY
- ▼ -1.13%
- Metro
- Los Angeles-Long Beach-Anaheim, CA
- State GDP YoY
- ▲ 3.21%
- F500 in state
- 116
Industry mix (Fortune 500 HQ in CA)
| Industry | F500 HQs | Revenue |
|---|---|---|
| Technology | 27 | $1,492B |
|
||
| Financial Services | 3 | $174B |
|
||
| Retail | 3 | $44B |
|
||
| Insurance | 3 | $26B |
|
||
| Media / Entertainment | 2 | $115B |
|
||
| Pharmaceuticals / Biotech | 2 | $62B |
|
||
Price history
+5.1% since first listed12 events — show timeline
- 2026-05-28 Sold (MLS) $1,050,000 TheMLS
- 2026-05-20 Pending — TheMLS
- 2026-04-28 Listed $1,298,000 TheMLS
- 2022-11-03 Listed — TheMLS
- 2022-10-14 Relisted — TheMLS
- 2022-09-21 Contingent — TheMLS
- 2022-09-13 Price Changed — TheMLS
- 2022-08-02 Listed — TheMLS
- 2014-10-01 Sold (Public Records) $1,050,000 Public Records
- 2014-09-26 Sold (MLS) $1,050,000 CRMLS
- 2014-07-16 Pending — CRMLS
- 2014-06-19 Listed $999,000 CRMLS
Property tax history
+13.8%/yrLatest (2025): $15,579 · +1.2% YoY. Source: county tax records.
Cash-flow waterfall
monthlySold comps — $/sqft
last 12 mo · ≤1 miLoading sold comps…