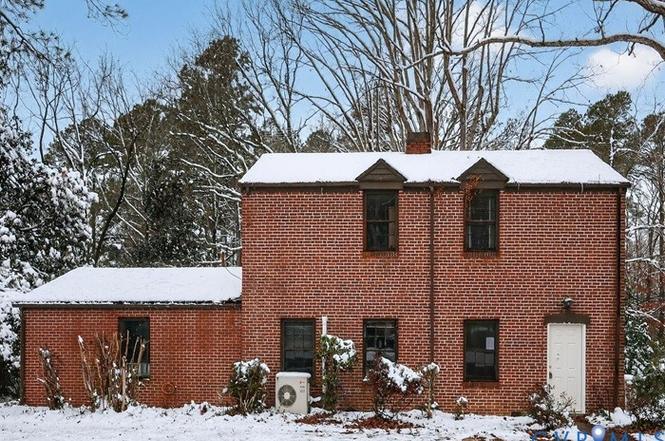
119 Church St · Alberta, VA
Flood risk No data
- FEMA flood zone
- —
- Chance of flooding over 30 yrs
- —
- Est. flood insurance / yr
- —
Fire risk No data
- Est. fire insurance / yr
- —
Heat risk No data
- Hot days now (above threshold)
- —
- Hot days in 30 yrs
- —
Wind risk No data
- Chance of severe wind over 30 yrs
- —
Air-quality risk No data
- Unhealthy air days now
- —
- Unhealthy air days in 30 yrs
- —
Risk factors via First Street. Map © Google.
Why this score? — see what drove the B grade
The composite is a weighted blend of 9 inputs, each scored 0–100. Each bar is that input's sub-score; the figure is the points it added to the 100-point composite (weight × sub-score).
- Cash flow +30.0/30.0
- 1% rule +10.0/10.0
- DSCR +10.0/10.0
- ARV discount +7.5/15.0
- Appreciation +6.2/10.0
- Livability +3.0/5.0
- Schools +2.9/10.0
- Rent growth +2.5/5.0
- Condition / age +2.5/5.0
$58,300
🖨 Deal sheet 📄 Offer letter ✓ Due diligence
Listing remarks
Opportunity awaits in this three bedroom, one and a half bath home. Work is required to make this home move in ready but could be worth the effort. Whether you decide to customize this home for yourself or rent it out, this house could be a great option. Property is subject to auction, list price based upon appraisal, seller will not accept offer prior to end of auction. Property sold “AS-IS” without contingencies, repairs, warranties, guarantees or representation as to listing accuracy, property information, photo or other depiction included or described herein. Inspect before bidding.
Key facts
- 0.7 acre lot
- Built 1936
- Listed 31 days
Neighborhood map
What this means for you Summary
Snapshot
- This is a 3-bed/1.5-bath single-family listed at $58k.
Deal economics
- At list price, monthly cash flow is $942 ($11k/yr) — positive.
- The deal already cash-flows at list — no discount required.
- Meets the 1% rule at list price ($2k rent vs $58k).
- Recommended offer: $57k (3.0% below list) — sets the bar for market timing.
Location & tenants
- Location reads 60/100 on livability (#432 in VA) — a middle-class / working-renter tenant base. Strengths: cost of living A+, housing B+; Watch: employment D+, amenities F, commute F.
- Brunswick County Public School District (rural): math 24% / reading 47% proficiency, ranked #130 of 131 in VA (top 99%) — families likely to look elsewhere, expect single-tenant / working-renter base with shorter leases; 73% free/reduced lunch — lower-income household profile, screen leases tightly.
- Market conditions: 17 active listings in the ZIP; 5 comparable units currently listed for rent nearby; rentals leasing fast (median 12d on market — plan ~1-2 weeks tenant-placement turnaround); 37 units permitted in Brunswick County in 2024 (0 in 5+ unit buildings).
Forward outlook
- In year one you build about $2k of equity ($403 loan paydown + $1k appreciation (2.3% local appreciation)).
- Brunswick County population projected at -30% by 2050 — secular population decline; favor cash flow + early exit over multi-decade hold.
- At projected returns (2.3% appreciation + 3.0% rent growth), your $16k cash investment doubles in ~2 years — after that, you're playing with house money.
Negotiation context
- It's been on market 31 days — a 3% lower offer ($57k) is reasonable based on typical stale-listing flexibility.
- 2 sale attempts with the ask held roughly flat each time — persistent listings suggest the price (not the market) is what's stuck; bring a comps-based counter.
Risks & watch-outs
- Watch-outs: built in 1936 — expect roof / HVAC / electrical / plumbing capex.
Questions for the listing agent
- It's been on market 31 days. Have you received any prior offers? Is the seller open to a 3% concession, seller financing, or rate buy-down credit?
- Built in 1936 — when were the roof, HVAC, electrical panel, plumbing, and water heater last replaced?
- Is there a deadline driving the sale (1031 exchange, divorce, estate, relocation)? That informs how much negotiation room exists.
- What's the average days-on-market for RENTAL listings here right now (not sales)? A rising rental-DOM trend means longer vacancies and softer asking-rent achievability than the comps imply.
- What's the recent tenant-quality profile in this submarket — average credit score on applications, eviction rate, late-payment / NSF rate, and stable-employment percentage? A property-management company in the area should have these aggregated.
- How much new for-sale + rental construction is in the pipeline within 1–3 miles? Heavy new supply typically softens prices + rents 12–24 months out; constrained supply supports both.
Investment metrics
- 1% rule
- 2.83% ✓
- Cap rate
- 25.68%
- Cash-on-cash
- 69.25%
- DSCR
- 4.08
- GRM
- 2.9
CMA / ARV
No comps found within radius.
Projected returns pro-forma
2.31% appreciation · 3.0% rent growth · sell at horizon
- IRR
- 73.3%
- Equity multiple
- 4.98×
- Total profit
- $64,909
- Equity at exit
- $23,966
- IRR
- 73.3%
- Equity multiple
- 10.17×
- Total profit
- $149,696
- Equity at exit
- $35,272
Cash invested: $16,324 (down + closing). Projections, not guarantees.
Landlord ↔ Tenant lean methodology
- Overall (STATE)
- 55 Moderately Landlord-Leaning
- State Virginia
- 55 Moderately Landlord-Leaning · D+2
- County
- — inherits STATE
- City
- — inherits STATE
ZIP-level market 23821
- Home prices YoY
- 2.6%
- Active inventory
- 17
- Price-to-rent
- 2.9×
Monthly cashflow live
- Estimated rent
- $1,650 high interval (Pro) →
- Mortgage (P&I)
- −$306
- Tax from tax record
- −$31 /mo · $377/yr
- Insurance
- −$24
- HOA
- −$0
- Vacancy / Maint / Mgmt
- −$346
- Net cashflow
- $942
Break-even live
UW: 25.0% down · 7.5% · 30yr · 1.5% tax · 5.0% vac · 8.0% maint · 8.0% mgmt
Financing live
Cash to close
- Down payment
- $14,575
- Closing costs
- $1,749
- Reserves months
- —
- Total cash needed
- —
Loan-product check · same deal, 3 products live
Conventional
25% down · 7.5% · 30yr
- Down + closing
- —
- Monthly P&I
- —
- Monthly cashflow
- —
- DSCR
- —
- Eligible?
- —
Personal DTI + credit; lowest rate.
DSCR
20% down · 8.5% · 30yr
- Down + closing
- —
- Monthly P&I
- —
- Monthly cashflow
- —
- DSCR
- —
- Eligible?
- —
No personal income docs; deal must DSCR.
Hard money
10% down · 12.0% · 12mo
- Down + closing
- —
- Monthly P&I
- —
- Monthly cashflow
- —
- DSCR
- —
- Eligible?
- —
Short-term bridge; refi at stabilization.
Rent comps 5 comps
| Address | Beds | Baths | Sqft | Rent | $/sqft | DOM | Units | Dist |
|---|---|---|---|---|---|---|---|---|
| 68 W 1st Ave Unit B Alberta, VA | 3.0 | 2.0 | 1441 | $1,650 | $1.15 | 2d | 1 | 0.39mi |
| 32 W 3rd Ave Alberta, VA | 3.0 | 2.0 | 1250 | $1,650 | $1.32 | 2d | 1 | 0.61mi |
| 38 W 3rd Ave Unit A Alberta, VA | 3.0 | 2.0 | 1250 | $1,650 | $1.32 | 43d | 1 | 0.61mi |
| 38 W 3rd Ave Unit B Alberta, VA | 3.0 | 2.0 | 1250 | $1,650 | $1.32 | 20d | 1 | 0.61mi |
| 32 W 3rd Ave Unit B Alberta, VA | 3.0 | 2.0 | 1250 | $1,650 | $1.32 | 11d | 1 | 0.61mi |
Listing history 11 events
-
2026-04-13status Pending
-
2026-03-13$58,300 Active
-
2025-11-21historical
-
2025-11-11price $72,700
-
2025-10-09price $76,500
-
2025-09-08price $80,500
-
2025-08-08price $84,700
-
2025-07-10price $89,100
-
2025-06-10price $93,700
-
2025-05-09$98,580 Active
-
2025-03-31soldstatus $73,345
ⓘ Source: listings_history table (triggers on properties + properties_extension) + one-shot
backfill from property_details.listing_events for pre-trigger history.
Tax reassessment forecast VA · Resets to sale price
- Current annual tax
- $377 · $31/mo
- Projected year-2 tax
- $478 · $40/mo
- Expected delta
- +$101/yr (+$8/mo · 26.8%)
ⓘ Screening estimate from a state-policy table — verify with the county assessor before closing.
Nearby sold comps map
Loading sold comps map…
Walkable amenities ~0.75 mi
Loading nearby amenities…
Taxation est. · year 1
- Rental income
- $19,800
- − Mortgage interest
- −$3,266
- − Property taxes
- −$377
- − Insurance
- −$292
- − Repairs & maintenance
- −$1,584
- − Management
- −$1,584
- − Depreciation
- −$1,696
- Taxable income
- $11,002
- Est. tax owed @ 24.0%
- −$2,640
- After-tax cash flow
- $8,664/yr
For passive investors: Depreciation is non-cash, so a rental often shows a tax loss while cash-flowing — sheltering income. Rental losses are passive: they offset passive income freely, and up to $25,000/yr can offset ordinary (W-2) income if you actively participate and your MAGI is under $100k (phasing out to $0 by $150k); unused losses carry forward. On sale, claimed depreciation is recaptured at up to 25%, and gains may owe capital-gains tax (a 1031 exchange can defer both). Figures are a year-1 estimate at your 24.0% rate — not tax advice; consult a CPA.
Schools (NCES district)
- District
- Brunswick County Public School District
- NCES district ID
- 5100480
- Math proficiency
- 24% ▼ -44.00%
- Reading proficiency
- 47% ▼ -15.00%
- Median HH income
- $37,085
- Composite
- 29.44/100
- National rank
- #6520
- State rank
- #130 of 131 in VA
Livability — Alberta
- Score
- 60/100
- State rank
- #432
- US rank
- #18545
Category grades
Schools grade is shown separately in the Schools card above.
Census & demographics
- Census place
- Alberta, VA
- Population (ZIP)
- 1,894
Population outlook (Brunswick County) Hauer SSP2
- Today (2025)
- 14,860 people
- By 2030
- 13,946 · -6.2%
- By 2040
- 12,029 · -19.1%
- By 2050
- 10,370 · -30.2%
- By 2075
- 7,708 · -48.1%
- By 2100
- 5,718 · -61.5%
Race, ethnicity, and origin ACS 2023
- Neighborhood character
- Majority Black (54%)
- Race & ethnicity
- Black 54% White 41% Two or more races 4% Hispanic / Latino 2%
- Common ancestry
- Scotch-Irish 2% Romanian 1% Serbian 1%
- Foreign-born
- 1% · Canada, Guatemala
- Languages at home
- 99% English-only · Spanish 1%
Political lean MEDSL · Brunswick
- 2024 margin
- Lean D (+8.5) · D 54.1% · R 45.5%
- 2008→2024 swing
- -17.9pp toward R · 2008: 26.5pp · 2024: 8.5pp
- All cycles
- 2024: D+8.5 2020: D+15.0 2016: D+18.7 2012: D+25.3 2008: D+26.5
Not yet ingested
- Civics
- —
Market trends
- HPI YoY
- ▲ 2.31%
- Current HPI
- 91.2014
- Rent YoY
- —
- Metro
- —
- State GDP YoY
- ▲ 2.40%
- F500 in state
- 50
Industry mix (Fortune 500 HQ in VA)
| Industry | F500 HQs | Revenue |
|---|---|---|
| Aerospace / Defense | 4 | $236B |
|
||
| Technology / Defense | 3 | $32B |
|
||
| Financial Services | 2 | $176B |
|
||
| Utilities | 2 | $27B |
|
||
| Insurance | 2 | $25B |
|
||
| Technology | 2 | $15B |
|
||
Price history
-20.5% since first listed11 events — show timeline
- 2026-04-13 Pending — CVRMLS
- 2026-03-13 Listed $58,300 CVRMLS
- 2025-11-21 Listing Removed — CVRMLS
- 2025-11-11 Price Changed $72,700 CVRMLS
- 2025-10-09 Price Changed $76,500 CVRMLS
- 2025-09-08 Price Changed $80,500 CVRMLS
- 2025-08-08 Price Changed $84,700 CVRMLS
- 2025-07-10 Price Changed $89,100 CVRMLS
- 2025-06-10 Price Changed $93,700 CVRMLS
- 2025-05-09 Listed $98,580 CVRMLS
- 2025-03-31 Sold (Public Records) $73,345 Public Records
Property tax history
+3.0%/yrLatest (2025): $377 · +0.0% YoY. Source: county tax records.
Cash-flow waterfall
monthlySold comps — $/sqft
last 12 mo · ≤1 miLoading sold comps…