 Multi-family
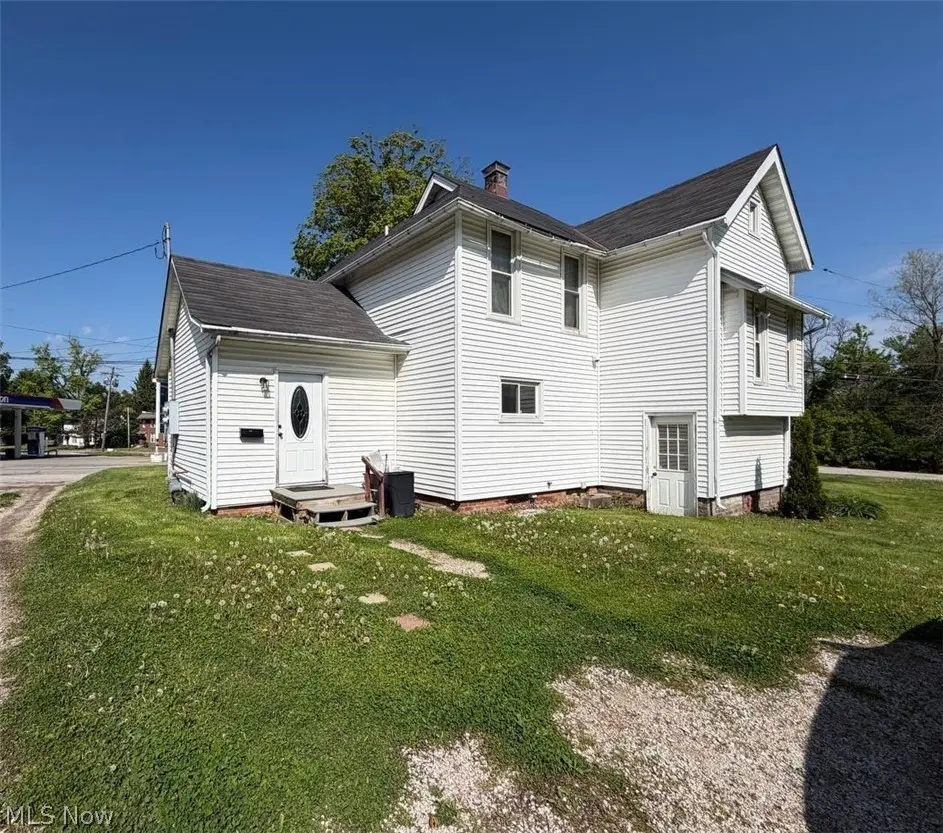
830 Bunker Hill Rd · Ashtabula, OH
Flood risk 1/10 · Minimal
- FEMA flood zone
- X (unshaded)
- Chance of flooding over 30 yrs
- 0.0%
- Est. flood insurance / yr
- $473 – $860
Fire risk 1/10 · Minimal
- Est. fire insurance / yr
- $713 – $1,323
Heat risk 2/10 · Minimal
- Hot days now (above 94°F)
- 7 days/yr
- Hot days in 30 yrs
- 17 days/yr
Wind risk 1/10 · Minimal
- Chance of severe wind over 30 yrs
- —
Air-quality risk 3/10 · Minor
- Unhealthy air days now
- 2 days/yr
- Unhealthy air days in 30 yrs
- 5 days/yr
Risk factors via First Street. Map © Google.
Why this score? — see what drove the B grade
The composite is a weighted blend of 9 inputs, each scored 0–100. Each bar is that input's sub-score; the figure is the points it added to the 100-point composite (weight × sub-score).
- Cash flow +29.5/30.0
- ARV discount +15.0/15.0
- DSCR +10.0/10.0
- 1% rule +7.8/10.0
- Livability +3.6/5.0
- Rent growth +2.5/5.0
- Condition / age +2.5/5.0
- Schools +2.4/10.0
- Appreciation +0.0/10.0
$114,500
🖨 Deal sheet 📄 Offer letter ✓ Due diligence
Multi-family units
County records classify this as Multi-Family (2-4 Unit). Listing-text estimate: 1 unit. estimate disagrees with records
Listing remarks MLS
Large remodeled two story with new carpet, newer windows, newer kitchen cabinets. Freshly painted interior. Ceiling fan. Small enclosed front porch and open front porch. Ready to move in.
Key facts
- Strong curb appeal
- Generously sized lot
- 0.26 acre lot
Tags
Property features AI
Exterior
- Parking: Driveway parking
- Utilities: Public water; Public sewer
- Home design: Two-story home; Vinyl siding exterior; Asphalt roof
- Construction: Vinyl siding construction; Asphalt roof
- Exterior features: Driveway; Lot approximately 0.256 acres
Interior
- Kitchen: Kitchen on the first floor (about 14 x 15)
- Bedrooms: One main-level bedroom; Two second-level bedrooms (each about 10 x 10)
- Bathrooms: Two full bathrooms; One main-level bathroom
- Heating & cooling: Baseboard heating; Forced air heating
- Interior features: Full basement
Neighborhood map
What this means for you Summary
Snapshot
- This is a 3-bed/2.0-bath multifamily listed at $114k.
Deal economics
- At list price, monthly cash flow is $408 ($5k/yr) — positive.
- The deal already cash-flows at list — no discount required.
- Meets the 1% rule at list price ($1k rent vs $114k).
- Recommended offer: $111k (3.0% below list) — sets the bar for market timing.
- Cap rate 10.6% vs local median 8.2% in Ashtabula — meaningfully above typical; check what's discounted (condition, days-on-market, listing class) to confirm the premium yield is real.
Location & tenants
- Location reads 71/100 on livability (#420 in OH) — a middle-class / working-renter tenant base. Strengths: cost of living A+, health & safety A+, housing A; Watch: schools C-, amenities F, commute F.
- Ashtabula Area City (town): math 24% / reading 35% proficiency, ranked #588 of 656 in OH (top 90%) — low school quality limits family demand, transient renter base, plan for 1-2y turnover; 63% free/reduced lunch — lower-income household profile, screen leases tightly.
- Market conditions: 162 active listings in the ZIP; 155 units permitted in Ashtabula County in 2024 (0 in 5+ unit buildings).
- This rent runs 35% of the median local income ($50k/yr) — at the standard rent-burdened threshold; future hikes will face affordability resistance.
Forward outlook
- Local home prices are declining (-3.0%/yr); year-one equity from $792 of loan paydown is wiped out by about $3k of value loss. Plan a longer hold.
- Ashtabula County population projected at -22% by 2050 — secular population decline; favor cash flow + early exit over multi-decade hold.
- At projected returns (-3.0% appreciation + 3.0% rent growth), your $32k cash investment doubles in ~8 years — after that, you're playing with house money.
Negotiation context
- It's been on market 38 days — a 3% lower offer ($111k) is reasonable based on typical stale-listing flexibility.
- 5 sale attempts since 27y ago; this cycle's ask has dropped $18k (14%) from the opening price — seller is motivated, your offer sets the floor, not the list.
- Current owner paid $72k; list at $114k implies a 59% gain — meaningful room to come down on a strong offer.
Risks & watch-outs
- Watch-outs: built in 1900 — expect roof / HVAC / electrical / plumbing capex.
Questions for the listing agent
- It's been on market 38 days. Have you received any prior offers? Is the seller open to a 3% concession, seller financing, or rate buy-down credit?
- Built in 1900 — when were the roof, HVAC, electrical panel, plumbing, and water heater last replaced?
- Is there a deadline driving the sale (1031 exchange, divorce, estate, relocation)? That informs how much negotiation room exists.
- What's the average days-on-market for RENTAL listings here right now (not sales)? A rising rental-DOM trend means longer vacancies and softer asking-rent achievability than the comps imply.
- What's the recent tenant-quality profile in this submarket — average credit score on applications, eviction rate, late-payment / NSF rate, and stable-employment percentage? A property-management company in the area should have these aggregated.
- How much new apartment / multifamily construction is in the pipeline within 1–3 miles? Heavy new supply (>2% of stock underway) typically softens rents 12–24 months out; light construction supports rent growth.
Investment metrics
- 1% rule
- 1.28% ✓
- Cap rate
- 10.57%
- Cash-on-cash
- 15.27%
- DSCR
- 1.68
- GRM
- 6.5
CMA / ARV
- ARV (median comp)
- $161,914
- List price
- $114,500
- Delta
- -29.28%
- Verdict
- UNDERPRICED
- Comps
- 20 within 1.0 mi
Show comp detail 1 sale within ~0.75 mi
| Address | Dist | Beds/Ba | Sqft | Sold | Price | $/sf | Match |
|---|---|---|---|---|---|---|---|
| 155 Riverside Dr | 0.65mi | 4/2.0 (+1) | 1,926 (+7%) | 15mo | $65,500 | $34 | 41 |
Match score weights: distance 35% · size 25% · config 20% · recency 20%. Top-matched comps best support the ARV.
Projected returns pro-forma
-3.0% appreciation · 3.0% rent growth · sell at horizon
- IRR
- 6.0%
- Equity multiple
- 1.23×
- Total profit
- $7,422
- Equity at exit
- $17,072
- IRR
- 15.3%
- Equity multiple
- 2.24×
- Total profit
- $39,898
- Equity at exit
- $9,900
Cash invested: $32,060 (down + closing). Projections, not guarantees.
Landlord ↔ Tenant lean methodology
- Overall (STATE)
- 73 Landlord-Friendly
- State Ohio
- 73 Landlord-Friendly · R+6
- County
- — inherits STATE
- City
- — inherits STATE
ZIP-level market 44004
- Home prices YoY
- -30.5%
- Active inventory
- 162
- Price-to-rent
- 6.5×
Monthly cashflow live
- Estimated rent
- $1,463 medium interval (Pro) →
- Mortgage (P&I)
- −$600
- Tax from tax record
- −$99 /mo · $1,193/yr
- Insurance
- −$48
- HOA
- −$0
- Vacancy / Maint / Mgmt
- −$307
- Net cashflow
- $408
Break-even live
UW: 25.0% down · 7.5% · 30yr · 1.5% tax · 5.0% vac · 8.0% maint · 8.0% mgmt
Financing live
Cash to close
- Down payment
- $28,625
- Closing costs
- $3,435
- Reserves months
- —
- Total cash needed
- —
Loan-product check · same deal, 3 products live
Conventional
25% down · 7.5% · 30yr
- Down + closing
- —
- Monthly P&I
- —
- Monthly cashflow
- —
- DSCR
- —
- Eligible?
- —
Personal DTI + credit; lowest rate.
DSCR
20% down · 8.5% · 30yr
- Down + closing
- —
- Monthly P&I
- —
- Monthly cashflow
- —
- DSCR
- —
- Eligible?
- —
No personal income docs; deal must DSCR.
Hard money
10% down · 12.0% · 12mo
- Down + closing
- —
- Monthly P&I
- —
- Monthly cashflow
- —
- DSCR
- —
- Eligible?
- —
Short-term bridge; refi at stabilization.
Listing history 35 events
-
2026-06-18days on market $114,500 Active 38 DOM
-
2026-06-17days on market $114,500 Active 37 DOM
-
2026-06-16days on market $114,500 Active 36 DOM
-
2026-06-15days on market $114,500 Active 35 DOM
-
2026-06-13days on market $114,500 Active 33 DOM
-
2026-06-12days on market $114,500 Active 32 DOM
-
2026-06-09days on market $114,500 Active 29 DOM
-
2026-06-08days on market $114,500 Active 28 DOM
-
2026-06-07days on market $114,500 Active 27 DOM
-
2026-06-07days on market $114,500 Active 26 DOM
-
2026-06-04days on market $114,500 Active 23 DOM
-
2026-06-02days on market $114,500 Active 22 DOM
-
2026-06-01days on market $114,500 Active 21 DOM
-
2026-05-31days on market $114,500 Active 20 DOM
-
2026-05-18price $124,500 620-char remark
-
2026-05-11$132,500 Active 620-char remark
-
2019-04-26soldstatus $72,000 Sold 187-char remark
Show marketing remark (187 chars)
Large remodeled two story with new carpet, newer windows, newer kitchen cabinets. Freshly painted interior. Ceiling fan. Small enclosed front porch and open front porch. Ready to move in.
-
2019-04-26soldstatus $72,000
Show marketing remark (187 chars)
Large remodeled two story with new carpet, newer windows, newer kitchen cabinets. Freshly painted interior. Ceiling fan. Small enclosed front porch and open front porch. Ready to move in.
-
2019-04-01status Pending 187-char remark
Show marketing remark (187 chars)
Large remodeled two story with new carpet, newer windows, newer kitchen cabinets. Freshly painted interior. Ceiling fan. Small enclosed front porch and open front porch. Ready to move in.
-
2019-03-22historical Contingent 187-char remark
Show marketing remark (187 chars)
Large remodeled two story with new carpet, newer windows, newer kitchen cabinets. Freshly painted interior. Ceiling fan. Small enclosed front porch and open front porch. Ready to move in.
-
2019-03-19price $69,500 187-char remark
Show marketing remark (187 chars)
Large remodeled two story with new carpet, newer windows, newer kitchen cabinets. Freshly painted interior. Ceiling fan. Small enclosed front porch and open front porch. Ready to move in.
-
2019-01-13price $72,500 187-char remark
Show marketing remark (187 chars)
Large remodeled two story with new carpet, newer windows, newer kitchen cabinets. Freshly painted interior. Ceiling fan. Small enclosed front porch and open front porch. Ready to move in.
-
2018-11-19$74,900 Active 187-char remark
Show marketing remark (187 chars)
Large remodeled two story with new carpet, newer windows, newer kitchen cabinets. Freshly painted interior. Ceiling fan. Small enclosed front porch and open front porch. Ready to move in.
-
2017-09-09historical
-
2017-06-06price $54,900
-
2017-03-01price $57,900
-
2017-01-30price $58,900
-
2016-09-19price $59,900
-
2016-08-10$64,900 Active
-
2003-02-11soldstatus $67,500
-
2002-12-20$72,900
-
2000-05-19soldstatus $55,900
-
2000-05-19soldstatus $55,900
-
2000-05-01historical
-
1999-10-01$64,500
ⓘ Source: listings_history table (triggers on properties + properties_extension) + one-shot
backfill from property_details.listing_events for pre-trigger history.
Tax reassessment forecast OH · Partial reset (capped growth)
- Current annual tax
- $1,193 · $99/mo
- Projected year-2 tax
- $1,490 · $124/mo
- Expected delta
- +$297/yr (+$25/mo · 24.9%)
ⓘ Screening estimate from a state-policy table — verify with the county assessor before closing.
Climate risk First Street
- Flood 1/10 Low FEMA zone X (unshaded) · 0% chance over 30 yrs
- Wildfire 1/10 Low
- Heat 2/10 Low 7 d/yr ≥94°F today · 17 d/yr by 30 yrs out
- Wind 1/10 Low
- Air quality 3/10 Moderate 2 unhealthy d/yr today · 5 by 30 yrs out
Nearby sold comps map
Loading sold comps map…
Walkable amenities ~0.75 mi
Loading nearby amenities…
Taxation est. · year 1
- Rental income
- $17,552
- − Mortgage interest
- −$6,414
- − Property taxes
- −$1,193
- − Insurance
- −$572
- − Repairs & maintenance
- −$1,404
- − Management
- −$1,404
- − Depreciation
- −$3,331
- Taxable income
- $3,233
- Est. tax owed @ 24.0%
- −$776
- After-tax cash flow
- $4,119/yr
For passive investors: Depreciation is non-cash, so a rental often shows a tax loss while cash-flowing — sheltering income. Rental losses are passive: they offset passive income freely, and up to $25,000/yr can offset ordinary (W-2) income if you actively participate and your MAGI is under $100k (phasing out to $0 by $150k); unused losses carry forward. On sale, claimed depreciation is recaptured at up to 25%, and gains may owe capital-gains tax (a 1031 exchange can defer both). Figures are a year-1 estimate at your 24.0% rate — not tax advice; consult a CPA.
Schools (NCES district)
- District
- Ashtabula Area City
- NCES district ID
- 3904351
- Math proficiency
- 24% ▼ -27.00%
- Reading proficiency
- 35% ▼ -13.00%
- Median HH income
- $34,812
- Composite
- 24.3/100
- National rank
- #7712
- State rank
- #588 of 656 in OH
Livability — Ashtabula
- Score
- 71/100
- State rank
- #420
- US rank
- #6883
Category grades
Schools grade is shown separately in the Schools card above.
Census & demographics
- Census place
- Ashtabula, OH
- County
- Ashtabula · 97,617 people
- City population
- 31,076
- Metro
- Cleveland, OH
- Population (ZIP)
- 31,076
- Household income
- $49,507
- Rent vs Own
- Severe rent burden
- 14.1
Population outlook (Ashtabula County) Hauer SSP2
- Today (2025)
- 92,950 people
- By 2030
- 89,146 · -4.1%
- By 2040
- 80,715 · -13.2%
- By 2050
- 72,270 · -22.2%
- By 2075
- 55,780 · -40.0%
- By 2100
- 40,928 · -56.0%
Race, ethnicity, and origin ACS 2023
- Neighborhood character
- Predominantly White (79%)
- Race & ethnicity
- White 79% Hispanic / Latino 9% Two or more races 7% Black 6%
- Hispanic origin (detail)
- Mexican 3% Puerto Rican 5%
- Common ancestry
- Romanian 4% Iranian 2% Slovak 1%
- Foreign-born
- 3% · Canada
- Languages at home
- 94% English-only · Spanish 4%
Political lean MEDSL · Ashtabula
- 2024 margin
- Strong R (+28.4) · D 35.4% · R 63.8%
- 2008→2024 swing
- -41.9pp toward R · 2008: 13.5pp · 2024: -28.4pp
- All cycles
- 2024: R+28.4 2020: R+23.5 2016: R+19.0 2012: D+12.1 2008: D+13.5
Not yet ingested
- Civics
- —
Market trends
- HPI YoY
- ▼ -114.51%
- Current HPI
- 260.7146
- Rent YoY
- —
- Metro
- —
- State GDP YoY
- ▲ 1.98%
- F500 in state
- 48
Industry mix (Fortune 500 HQ in OH)
| Industry | F500 HQs | Revenue |
|---|---|---|
| Insurance | 3 | $145B |
|
||
| Industrial Machinery | 3 | $49B |
|
||
| Financial Services | 3 | $24B |
|
||
| Consumer Goods | 2 | $93B |
|
||
| Aerospace / Defense | 2 | $47B |
|
||
| Utilities | 2 | $33B |
|
||
Price history
+77.5% since first listed22 events — show timeline
- 2026-05-26 Price Changed $114,500 MLSNOW
- 2026-05-18 Price Changed $124,500 MLSNOW
- 2026-05-11 Listed $132,500 MLSNOW
- 2019-04-26 Sold (Public Records) $72,000 Public Records
- 2019-04-26 Sold (MLS) $72,000 MLSNOW
- 2019-04-01 Pending — MLSNOW
- 2019-03-22 Contingent — MLSNOW
- 2019-03-19 Price Changed $69,500 MLSNOW
- 2019-01-13 Price Changed $72,500 MLSNOW
- 2018-11-19 Listed $74,900 MLSNOW
- 2017-09-09 Listing Removed — MLSNOW
- 2017-06-06 Price Changed $54,900 MLSNOW
- 2017-03-01 Price Changed $57,900 MLSNOW
- 2017-01-30 Price Changed $58,900 MLSNOW
- 2016-09-19 Price Changed $59,900 MLSNOW
- 2016-08-10 Listed $64,900 MLSNOW
- 2003-02-11 Sold (MLS) $67,500 MLSNOW
- 2002-12-20 Listed $72,900 MLSNOW
- 2000-05-19 Sold (Public Records) $55,900 Public Records
- 2000-05-19 Sold (MLS) $55,900 MLSNOW
- 2000-05-01 Listing Removed — MLSNOW
- 1999-10-01 Listed $64,500 MLSNOW
Property tax history
-1.2%/yrLatest (2025): $1,193 · -1.7% YoY. Source: county tax records.
Cash-flow waterfall
monthlySold comps — $/sqft
last 12 mo · ≤1 miLoading sold comps…