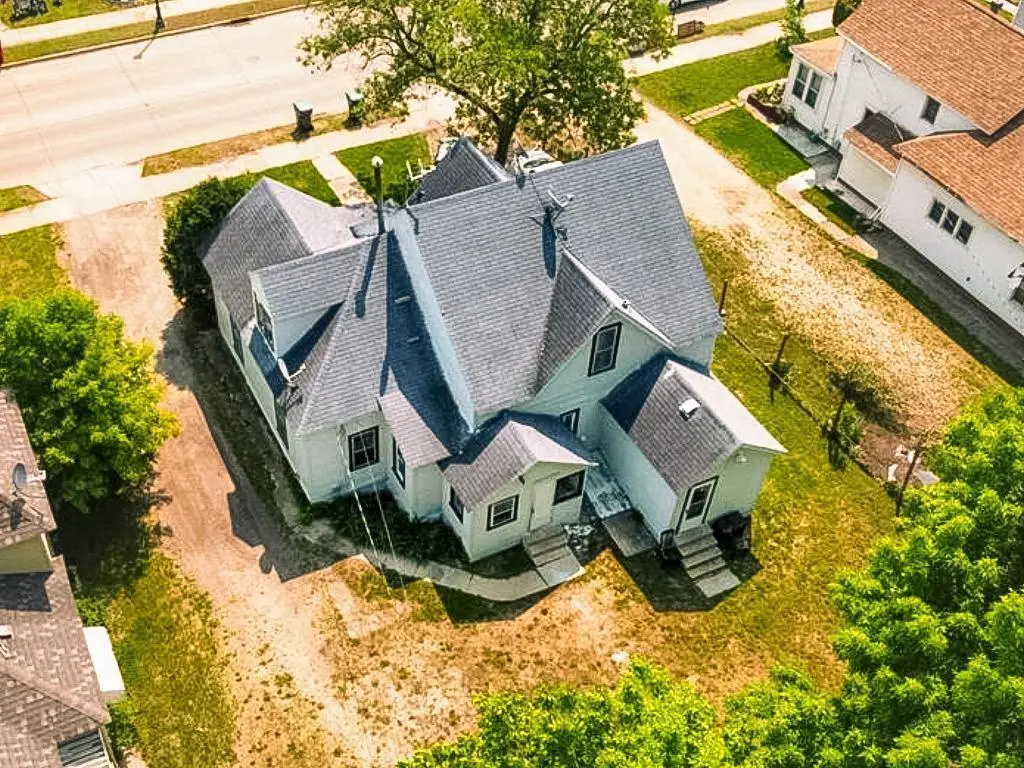
404 Main St · Austin, MN
Flood risk 1/10 · Minimal
- FEMA flood zone
- X (unshaded)
- Chance of flooding over 30 yrs
- 0.0%
- Est. flood insurance / yr
- $473 – $860
Fire risk 1/10 · Minimal
- Est. fire insurance / yr
- $888 – $1,650
Heat risk 1/10 · Minimal
- Hot days now (above 98°F)
- 7 days/yr
- Hot days in 30 yrs
- 16 days/yr
Wind risk 2/10 · Minimal
- Chance of severe wind over 30 yrs
- —
Air-quality risk 1/10 · Minimal
- Unhealthy air days now
- 0 days/yr
- Unhealthy air days in 30 yrs
- 0 days/yr
Risk factors via First Street. Map © Google.
Why this score? — see what drove the B grade
The composite is a weighted blend of 9 inputs, each scored 0–100. Each bar is that input's sub-score; the figure is the points it added to the 100-point composite (weight × sub-score).
- Cash flow +30.0/30.0
- 1% rule +10.0/10.0
- DSCR +10.0/10.0
- ARV discount +7.5/15.0
- Rent growth +5.0/5.0
- Livability +4.0/5.0
- Schools +2.5/10.0
- Condition / age +2.5/5.0
- Appreciation +0.0/10.0
$118,000
🖨 Deal sheet 📄 Offer letter ✓ Due diligence
Listing remarks MLS
Discover an outstanding opportunity with this up/down duplex located right on the edge of Downtown Austin. Situated just blocks away from the city's vibrant entertainment, restaurants, and cultural offerings, this property offers the quintessential Austin lifestyle. Both units feature spacious kitchens and living areas, ensuring comfortable and desirable living spaces for tenants. With such a prime location, you can expect high demand from renters who want to be in the heart of all that Austin has to offer. Investors and property owners will appreciate the ease of renting and the potential for steady rental income that this duplex presents. Don't miss the chance to own a piece of Austin's bustling downtown scene and make a sound investment in the heart of the city.
Key facts
- Up down duplex
- Spacious kitchens
- Prime location
Tags
Neighborhood map
What this means for you Summary
Snapshot
- This is a 4-bed/2.0-bath other listed at $118k.
Deal economics
- At list price, monthly cash flow is $588 ($7k/yr) — positive.
- The deal already cash-flows at list — no discount required.
- Meets the 1% rule at list price ($2k rent vs $118k).
- Recommended offer: $104k (12.0% below list) — sets the bar for market timing.
- Cap rate 12.3% vs local median 4.5% in Austin — top-decile yield for the area; either an underpriced asset or a hidden risk that comps aren't pricing in. Stress-test before assuming the spread holds.
Location & tenants
- Location reads 80/100 on livability (#77 in MN, #1,829 nationally) — a professional / high-income tenant draw. Strengths: cost of living A+, housing A+, health & safety A+; Watch: schools C-, commute F.
- Austin Public School District (town): math 24% / reading 34% proficiency, ranked #267 of 301 in MN (top 89%) — low school quality limits family demand, transient renter base, plan for 1-2y turnover.
- Market conditions: Rents rising fast (+11.6%/yr); 188 active listings in the ZIP; 2 comparable units currently listed for rent nearby; 53 units permitted in Mower County in 2024 (0 in 5+ unit buildings).
- This rent runs 30% of the median local income ($70k/yr) — at the standard rent-burdened threshold; future hikes will face affordability resistance.
Forward outlook
- Local home prices are declining (-3.0%/yr); year-one equity from $816 of loan paydown is wiped out by about $4k of value loss. Plan a longer hold.
- At projected returns (-3.0% appreciation + 8.0% rent growth), your $33k cash investment doubles in ~5 years — after that, you're playing with house money.
Negotiation context
- It's been on market 168 days — a 12% lower offer ($104k) is reasonable based on typical stale-listing flexibility.
- 12 sale attempts since 25y ago with the ask held roughly flat each time — persistent listings suggest the price (not the market) is what's stuck; bring a comps-based counter.
- Current owner paid $53k; list at $118k implies a 123% gain — meaningful room to come down on a strong offer.
Risks & watch-outs
- Watch-outs: built in 1888 — expect roof / HVAC / electrical / plumbing capex.
Questions for the listing agent
- It's been on market 168 days. Have you received any prior offers? Is the seller open to a 12% concession, seller financing, or rate buy-down credit?
- Built in 1888 — when were the roof, HVAC, electrical panel, plumbing, and water heater last replaced?
- Why hasn't it sold? Are there any deal-killer items the seller is aware of (foundation, flood, title, zoning, code violations)?
- Is there a deadline driving the sale (1031 exchange, divorce, estate, relocation)? That informs how much negotiation room exists.
- What's the average days-on-market for RENTAL listings here right now (not sales)? A rising rental-DOM trend means longer vacancies and softer asking-rent achievability than the comps imply.
- What's the recent tenant-quality profile in this submarket — average credit score on applications, eviction rate, late-payment / NSF rate, and stable-employment percentage? A property-management company in the area should have these aggregated.
- How much new for-sale + rental construction is in the pipeline within 1–3 miles? Heavy new supply typically softens prices + rents 12–24 months out; constrained supply supports both.
Investment metrics
- 1% rule
- 1.51% ✓
- Cap rate
- 12.28%
- Cash-on-cash
- 21.37%
- DSCR
- 1.95
- GRM
- 5.5
CMA / ARV
No comps found within radius.
Projected returns pro-forma
-3.0% appreciation · 8.0% rent growth · sell at horizon
- IRR
- 19.5%
- Equity multiple
- 1.84×
- Total profit
- $27,772
- Equity at exit
- $17,594
- IRR
- 31.0%
- Equity multiple
- 4.49×
- Total profit
- $115,302
- Equity at exit
- $10,202
Cash invested: $33,040 (down + closing). Projections, not guarantees.
Landlord ↔ Tenant lean methodology
- Overall (STATE)
- 46 Balanced
- State Minnesota
- 46 Balanced · D+2
- County
- — inherits STATE
- City
- — inherits STATE
ZIP-level market 55912
- Home prices YoY
- -34.4%
- Rents YoY
- 11.6%
- Active inventory
- 188
- Price-to-rent
- 5.5×
Monthly cashflow live
- Estimated rent
- $1,778 medium interval (Pro) →
- Mortgage (P&I)
- −$619
- Tax from tax record
- −$148 /mo · $1,776/yr
- Insurance
- −$49
- HOA
- −$0
- Vacancy / Maint / Mgmt
- −$373
- Net cashflow
- $588
Break-even live
UW: 25.0% down · 7.5% · 30yr · 1.5% tax · 5.0% vac · 8.0% maint · 8.0% mgmt
Financing live
Cash to close
- Down payment
- $29,500
- Closing costs
- $3,540
- Reserves months
- —
- Total cash needed
- —
Loan-product check · same deal, 3 products live
Conventional
25% down · 7.5% · 30yr
- Down + closing
- —
- Monthly P&I
- —
- Monthly cashflow
- —
- DSCR
- —
- Eligible?
- —
Personal DTI + credit; lowest rate.
DSCR
20% down · 8.5% · 30yr
- Down + closing
- —
- Monthly P&I
- —
- Monthly cashflow
- —
- DSCR
- —
- Eligible?
- —
No personal income docs; deal must DSCR.
Hard money
10% down · 12.0% · 12mo
- Down + closing
- —
- Monthly P&I
- —
- Monthly cashflow
- —
- DSCR
- —
- Eligible?
- —
Short-term bridge; refi at stabilization.
Rent comps 2 comps
| Address | Beds | Baths | Sqft | Rent | $/sqft | DOM | Units | Dist |
|---|---|---|---|---|---|---|---|---|
| 704 1st Dr NW Austin, MN | 3.0 | 1.0–2.0 | 981 | $2,514 | $2.56 | 43d | 96 | 0.66mi |
| 1204 1st Ave NE Austin, MN | 3.0 | 2.0 | 1200 | $1,600 | $1.33 | 43d | 1 | 0.90mi |
Listing history 38 events
-
2026-06-19days on market $118,000 Active 168 DOM
-
2026-06-18days on market $118,000 Active 167 DOM
-
2026-06-17days on market $118,000 Active 166 DOM
-
2026-06-16days on market $118,000 Active 165 DOM
-
2026-06-15days on market $118,000 Active 164 DOM
-
2026-06-14days on market $118,000 Active 162 DOM
-
2026-06-12days on market $118,000 Active 161 DOM
-
2026-06-09days on market $118,000 Active 158 DOM
-
2026-06-08days on market $118,000 Active 157 DOM
-
2026-06-07days on market $118,000 Active 156 DOM
-
2026-06-05days on market $118,000 Active 153 DOM
-
2026-06-02days on market $118,000 Active 151 DOM
-
2026-06-01days on market $118,000 Active 150 DOM
-
2026-05-31days on market $118,000 Active 149 DOM
-
2026-05-30days on market $118,000 Active 148 DOM
-
2026-01-02$118,000 Active 775-char remark
Show marketing remark (775 chars)
Discover an outstanding opportunity with this up/down duplex located right on the edge of Downtown Austin. Situated just blocks away from the city's vibrant entertainment, restaurants, and cultural offerings, this property offers the quintessential Austin lifestyle. Both units feature spacious kitchens and living areas, ensuring comfortable and desirable living spaces for tenants. With such a prime location, you can expect high demand from renters who want to be in the heart of all that Austin has to offer. Investors and property owners will appreciate the ease of renting and the potential for steady rental income that this duplex presents. Don't miss the chance to own a piece of Austin's bustling downtown scene and make a sound investment in the heart of the city.
-
2026-01-02historical
Show marketing remark (775 chars)
Discover an outstanding opportunity with this up/down duplex located right on the edge of Downtown Austin. Situated just blocks away from the city's vibrant entertainment, restaurants, and cultural offerings, this property offers the quintessential Austin lifestyle. Both units feature spacious kitchens and living areas, ensuring comfortable and desirable living spaces for tenants. With such a prime location, you can expect high demand from renters who want to be in the heart of all that Austin has to offer. Investors and property owners will appreciate the ease of renting and the potential for steady rental income that this duplex presents. Don't miss the chance to own a piece of Austin's bustling downtown scene and make a sound investment in the heart of the city.
-
2024-11-11$118,000 Active
-
2024-11-11historical
-
2024-11-11$118,000 Active
-
2024-11-02historical
-
2024-04-22$118,000 Active
-
2024-04-02historical
-
2023-12-26$118,000 Active
-
2023-12-26historical
-
2023-08-03status Active
-
2023-08-02historical
-
2023-01-03$118,000 Active
-
2023-01-02historical
-
2022-06-24$118,000 Active
-
2022-06-22historical
-
2007-04-09soldstatus $53,000
-
2007-04-05soldstatus $53,000
-
2006-09-06$56,900
-
2005-07-27soldstatus $53,000
-
2005-06-08$53,000
-
2004-03-24$59,900
-
2001-04-16$64,900
ⓘ Source: listings_history table (triggers on properties + properties_extension) + one-shot
backfill from property_details.listing_events for pre-trigger history.
Tax reassessment forecast MN · Partial reset (capped growth)
- Current annual tax
- $1,776 · $148/mo
- Projected year-2 tax
- $1,776 · $148/mo
- Expected delta
- $0/yr ($0/mo · 0.0%)
ⓘ Screening estimate from a state-policy table — verify with the county assessor before closing.
Climate risk First Street
- Flood 1/10 Low FEMA zone X (unshaded) · 0% chance over 30 yrs
- Wildfire 1/10 Low
- Heat 1/10 Low 7 d/yr ≥98°F today · 16 d/yr by 30 yrs out
- Wind 2/10 Low
- Air quality 1/10 Low 0 unhealthy d/yr today · 0 by 30 yrs out
Nearby sold comps map
Loading sold comps map…
Walkable amenities ~0.75 mi
Loading nearby amenities…
Taxation est. · year 1
- Rental income
- $21,331
- − Mortgage interest
- −$6,610
- − Property taxes
- −$1,776
- − Insurance
- −$590
- − Repairs & maintenance
- −$1,707
- − Management
- −$1,707
- − Depreciation
- −$3,433
- Taxable income
- $5,510
- Est. tax owed @ 24.0%
- −$1,322
- After-tax cash flow
- $5,738/yr
For passive investors: Depreciation is non-cash, so a rental often shows a tax loss while cash-flowing — sheltering income. Rental losses are passive: they offset passive income freely, and up to $25,000/yr can offset ordinary (W-2) income if you actively participate and your MAGI is under $100k (phasing out to $0 by $150k); unused losses carry forward. On sale, claimed depreciation is recaptured at up to 25%, and gains may owe capital-gains tax (a 1031 exchange can defer both). Figures are a year-1 estimate at your 24.0% rate — not tax advice; consult a CPA.
Schools (NCES district)
- District
- Austin Public School District
- NCES district ID
- 2703450
- Math proficiency
- 24% ▼ -12.00%
- Reading proficiency
- 34% ▼ -9.00%
- Median HH income
- $43,818
- Composite
- 24.75/100
- National rank
- #7604
- State rank
- #267 of 301 in MN
Livability — Austin
- Score
- 80/100
- State rank
- #77
- US rank
- #1829
Category grades
Schools grade is shown separately in the Schools card above.
Census & demographics
- Census place
- Austin, MN
- County
- Mower County · 29,632 people
- City population
- 29,632
- Metro
- Austin, MN
- Population (ZIP)
- 29,632
- Household income
- $70,177
- Rent vs Own
- Severe rent burden
- 759.0
Population outlook (Mower County) Hauer SSP2
- Today (2025)
- 39,967 people
- By 2030
- 40,204 · +0.6%
- By 2040
- 40,509 · +1.4%
- By 2050
- 40,841 · +2.2%
- By 2075
- 42,029 · +5.2%
- By 2100
- 42,272 · +5.8%
Race, ethnicity, and origin ACS 2023
- Neighborhood character
- Predominantly White (67%)
- Race & ethnicity
- White 67% Hispanic / Latino 16% Asian 8% Two or more races 7% Black 5%
- Hispanic origin (detail)
- Mexican 12%
- Common ancestry
- Portuguese 16% Lithuanian 2% Iranian 2%
- Foreign-born
- 15% · Canada, Philippines, China
- Languages at home
- 76% English-only · Spanish 14% Other Asian/Pacific 5% German/W. Germanic 1%
Political lean MEDSL · Mower
- 2024 margin
- R (+10.5) · D 43.9% · R 54.4% · Other 1.7%
- 2008→2024 swing
- -34.1pp toward R · 2008: 23.6pp · 2024: -10.5pp
- All cycles
- 2024: R+10.5 2020: R+5.8 2016: R+7.8 2012: D+22.7 2008: D+23.6
Not yet ingested
- Civics
- —
Market trends
- HPI YoY
- ▼ -142.60%
- Current HPI
- 271.4199
- Rent YoY
- ▲ 11.62%
- Metro
- Austin, MN
- State GDP YoY
- ▲ 2.41%
- F500 in state
- 34
Industry mix (Fortune 500 HQ in MN)
| Industry | F500 HQs | Revenue |
|---|---|---|
| Healthcare | 2 | $407B |
|
||
| Retail | 2 | $150B |
|
||
| Consumer Goods | 2 | $32B |
|
||
| Industrial Machinery | 2 | $6B |
|
||
| Agriculture | 1 | $40B |
|
||
| Healthcare / Medical Devices | 1 | $32B |
|
||
Price history
+81.8% since first listed23 events — show timeline
- 2026-01-02 Listing Removed — NORTHSTARMLS as Distributed by MLS Grid
- 2026-01-02 Listed $118,000 NORTHSTARMLS as Distributed by MLS Grid
- 2024-11-11 Listed $118,000 NORTHSTARMLS as Distributed by MLS Grid
- 2024-11-11 Listing Removed — NORTHSTARMLS as Distributed by MLS Grid
- 2024-11-11 Listed $118,000 NORTHSTARMLS as Distributed by MLS Grid
- 2024-11-02 Listing Removed — NORTHSTARMLS as Distributed by MLS Grid
- 2024-04-22 Listed $118,000 NORTHSTARMLS as Distributed by MLS Grid
- 2024-04-02 Listing Removed — NORTHSTARMLS as Distributed by MLS Grid
- 2023-12-26 Listing Removed — NORTHSTARMLS as Distributed by MLS Grid
- 2023-12-26 Listed $118,000 NORTHSTARMLS as Distributed by MLS Grid
- 2023-08-03 Relisted — NORTHSTARMLS as Distributed by MLS Grid
- 2023-08-02 Listing Removed — NORTHSTARMLS as Distributed by MLS Grid
- 2023-01-03 Listed $118,000 NORTHSTARMLS as Distributed by MLS Grid
- 2023-01-02 Listing Removed — NORTHSTARMLS as Distributed by MLS Grid
- 2022-06-24 Listed $118,000 NORTHSTARMLS as Distributed by MLS Grid
- 2022-06-22 Coming Soon — NORTHSTARMLS as Distributed by MLS Grid
- 2007-04-09 Sold (MLS) $53,000 NORTHSTARMLS as Distributed by MLS Grid
- 2007-04-05 Sold (Public Records) $53,000 Public Records
- 2006-09-06 Listed $56,900 NORTHSTARMLS as Distributed by MLS Grid
- 2005-07-27 Sold (Public Records) $53,000 Public Records
- 2005-06-08 Listed $53,000 NORTHSTARMLS as Distributed by MLS Grid
- 2004-03-24 Listed $59,900 NORTHSTARMLS as Distributed by MLS Grid
- 2001-04-16 Listed $64,900 NORTHSTARMLS as Distributed by MLS Grid
Property tax history
+8.8%/yrLatest (2025): $1,776 · +20.3% YoY. Source: county tax records.
Cash-flow waterfall
monthlySold comps — $/sqft
last 12 mo · ≤1 miLoading sold comps…