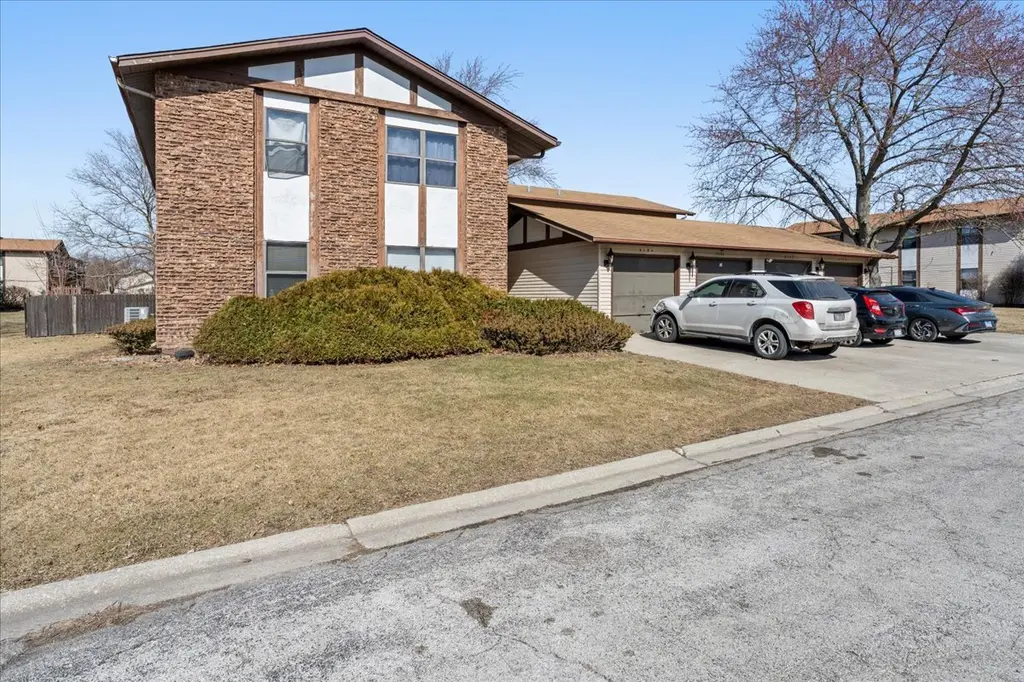
4128 192nd Ct #4128 · Country Club Hills, IL
Flood risk 1/10 · Minimal
- FEMA flood zone
- X (unshaded)
- Chance of flooding over 30 yrs
- 0.0%
- Est. flood insurance / yr
- $507 – $1,088
Fire risk 1/10 · Minimal
- Est. fire insurance / yr
- $804 – $1,492
Heat risk 3/10 · Minor
- Hot days now (above 101°F)
- 7 days/yr
- Hot days in 30 yrs
- 15 days/yr
Wind risk 2/10 · Minimal
- Chance of severe wind over 30 yrs
- —
Air-quality risk 2/10 · Minimal
- Unhealthy air days now
- 1 days/yr
- Unhealthy air days in 30 yrs
- 1 days/yr
Risk factors via First Street. Map © Google.
Why this score? — see what drove the B- grade
The composite is a weighted blend of 9 inputs, each scored 0–100. Each bar is that input's sub-score; the figure is the points it added to the 100-point composite (weight × sub-score).
- Cash flow +30.0/30.0
- 1% rule +10.0/10.0
- DSCR +10.0/10.0
- ARV discount +7.5/15.0
- Livability +3.8/5.0
- Rent growth +2.5/5.0
- Condition / age +2.5/5.0
- Schools +0.9/10.0
- Appreciation +0.0/10.0
$110,000
🖨 Deal sheet (PDF) 📄 Offer letter ✓ Due diligence
Listing remarks
Freshly painted, move-in ready first-floor condominium offering comfort, convenience, and easy living. This spacious 3-bedroom, 2-bath home features a bright and inviting living room, a dedicated dining area, in-unit washer/dryer, and an eat-in kitchen perfect for everyday meals or entertaining. Brand new kitchen stainless steel appliances add a modern touch, while freshly cleaned carpeting throughout gives the home a crisp, well-maintained feel. The primary suite offers double closets and a private bath, providing ample storage and a comfortable retreat. Enjoy outdoor relaxation on your fenced patio, ideal for morning coffee or evening unwinding. Additional highlights include a one-car gar
Key facts
- Fenced patio
- Community clubhouse
- Tennis courts
Tags
Property features AI
Finance
- HOA & community: Monthly association fee of $245; Association covers insurance, clubhouse, pool, exterior maintenance, and scavenger; Pets allowed (cats and dogs); maximum pet weight 10 lbs
Exterior
- Parking: Detached garage with garage door opener; Concrete parking surface; 1 garage space (1 total parking)
- Utilities: Public water; Public sewer
- Home design: Attached single (condo); Entry level: 1; Condo ownership; Rehab planned for 2026
- Construction: Built 51–60 years ago; Aluminum siding and brick exterior; Built before 1978
- Exterior features: Common lot; Directions provided to property
Interior
- Kitchen: Kitchen (10 x 10); Range; Microwave; Dishwasher; Refrigerator
- Bedrooms: 3 bedrooms total; Master bedroom on main level (12 x 12); Bedroom on main level (10 x 11); Bedroom on main level (10 x 11)
- Bathrooms: 2 full bathrooms
- Heating & cooling: Natural gas forced air heating; Central air conditioning
- Interior features: 6 total rooms; Family room; Living room (19 x 15)
- Laundry & utility: In-unit laundry; Washer; Dryer; Laundry room
Neighborhood map
What this means for you Summary
Snapshot
- This is a 3-bed/2.0-bath condo listed at $110k.
Deal economics
- At list price, monthly cash flow is $869 ($10k/yr) — positive.
- The deal already cash-flows at list — no discount required.
- Meets the 1% rule at list price ($2k rent vs $110k).
- Cap rate 15.8% vs local median 6.7% in Country Club Hills — top-decile yield for the area; either an underpriced asset or a hidden risk that comps aren't pricing in. Stress-test before assuming the spread holds.
Location & tenants
- Location reads 75/100 on livability (#212 in IL, #3,963 nationally) — a middle-class / working-renter tenant base. Strengths: commute A+, cost of living A+, housing A+; Watch: crime D+, health & safety D+, amenities F.
- Rich Twp Hsd 227 (suburban): math 5% / reading 12% proficiency, ranked #577 of 620 in IL (top 93%) — low school quality limits family demand, transient renter base, plan for 1-2y turnover.
- Zoned schools: Zenon J Sykuta School (404 students, 0% FRL); Southwood Middle School (math 2% / reading 8%, grade F, #636 of 665 statewide, top 98%, 381 students, 0% FRL); Rich Township High School (math 5% / reading 12%, grade F, #584 of 693 statewide, top 85%, 2,487 students, 0% FRL).
- Market conditions: 91 active listings in the ZIP; 4 comparable units currently listed for rent nearby; rentals leasing fast (median 1d on market — plan ~1-2 weeks tenant-placement turnaround); 6,272 units permitted in Cook County in 2024 (4,658 in 5+ unit buildings).
Forward outlook
- Local home prices are declining (-3.0%/yr); year-one equity from $761 of loan paydown is wiped out by about $3k of value loss. Plan a longer hold.
- At projected returns (-3.0% appreciation + 3.0% rent growth), your $31k cash investment doubles in ~4 years — after that, you're playing with house money.
Negotiation context
- Only 7 days on market — expect competitive offers; lowballing is unlikely to land.
- 12 sale attempts since 12y ago with the ask held roughly flat each time — persistent listings suggest the price (not the market) is what's stuck; bring a comps-based counter.
- Current owner paid $75k; 47% above their basis — modest negotiation headroom, anchor on the comps not their cost.
Questions for the listing agent
- Built in 1975 — when were the roof, HVAC, electrical panel, plumbing, and water heater last replaced?
- What does the HOA fee cover, when was the last increase, and are there any pending special assessments or reserve-fund shortfalls?
- Any open or pending special assessments — roof, HVAC, plumbing, elevator, façade? What's the per-unit balance and payoff schedule, and is the seller paying it off at close or rolling it to the buyer?
- Is there a deadline driving the sale (1031 exchange, divorce, estate, relocation)? That informs how much negotiation room exists.
- Schools are F-rated, which usually means shorter tenancies and higher turnover. Who's the typical renter profile here, and what's been the actual vacancy rate?
- Crime grade is D in this area — have there been break-ins, vandalism, or insurance claims at this property in the last 3 years? What carrier currently insures it and at what premium?
- What's the average days-on-market for RENTAL listings here right now (not sales)? A rising rental-DOM trend means longer vacancies and softer asking-rent achievability than the comps imply.
- What's the recent tenant-quality profile in this submarket — average credit score on applications, eviction rate, late-payment / NSF rate, and stable-employment percentage? A property-management company in the area should have these aggregated.
- How much new apartment / multifamily construction is in the pipeline within 1–3 miles? Heavy new supply (>2% of stock underway) typically softens rents 12–24 months out; light construction supports rent growth.
Investment metrics
- 1% rule
- 2.16% ✓
- Cap rate
- 15.78%
- Cash-on-cash
- 33.87%
- DSCR
- 2.51
- GRM
- 3.9
CMA / ARV
No comps found within radius.
Projected returns pro-forma
-3.0% appreciation · 3.0% rent growth · sell at horizon
- IRR
- 29.3%
- Equity multiple
- 2.22×
- Total profit
- $37,728
- Equity at exit
- $16,401
- IRR
- 36.7%
- Equity multiple
- 4.41×
- Total profit
- $104,902
- Equity at exit
- $9,511
Cash invested: $30,800 (down + closing). Projections, not guarantees.
Landlord ↔ Tenant lean methodology
- Overall (STATE)
- 43 Moderately Tenant-Leaning
- State Illinois
- 43 Moderately Tenant-Leaning · D+7
- County
- — inherits STATE
- City
- — inherits STATE
ZIP-level market 60478
- Home prices YoY
- -27.3%
- Active inventory
- 91
- Price-to-rent
- 3.9×
Monthly cashflow live
- Estimated rent
- $2,373 medium interval (Pro) →
- Mortgage (P&I)
- −$577
- Tax est. 1.5%
- −$138 /mo · $1,650/yr
- Insurance
- −$46
- HOA
- −$245
- Vacancy / Maint / Mgmt
- −$498
- Net cashflow
- $869
Break-even live
Sensitivity live
| Price | -10% $945 | -5% $907 | +0% $869 | +5% $831 | +10% $793 |
|---|---|---|---|---|---|
| Rent | -10% $682 | -5% $776 | +0% $869 | +5% $963 | +10% $1,057 |
| Rate | -1.0pp $925 | -0.5pp $897 | base $869 | +0.5pp $841 | +1.0pp $812 |
UW: 25.0% down · 7.5% · 30yr · 1.5% tax · 5.0% vac · 8.0% maint · 8.0% mgmt
Financing live
Cash to close
- Down payment
- $27,500
- Closing costs
- $3,300
- Reserves months
- —
- Total cash needed
- —
Loan-product check · same deal, 3 products live
Conventional
25% down · 7.5% · 30yr
- Down + closing
- —
- Monthly P&I
- —
- Monthly cashflow
- —
- DSCR
- —
- Eligible?
- —
Personal DTI + credit; lowest rate.
DSCR
20% down · 8.5% · 30yr
- Down + closing
- —
- Monthly P&I
- —
- Monthly cashflow
- —
- DSCR
- —
- Eligible?
- —
No personal income docs; deal must DSCR.
Hard money
10% down · 12.0% · 12mo
- Down + closing
- —
- Monthly P&I
- —
- Monthly cashflow
- —
- DSCR
- —
- Eligible?
- —
Short-term bridge; refi at stabilization.
Rent comps 4 comps
| Address | Beds | Baths | Sqft | Rent | $/sqft | DOM | Units | Dist |
|---|---|---|---|---|---|---|---|---|
| 4453 Provincetown Dr Country Club Hills, IL | 3.0 | 2.5 | 1300 | $2,500 | $1.92 | 0d | 1 | 0.86mi |
| 2256 Windsor Ln Country Club Hills, IL | 3.0 | 1.0 | 1212 | $2,250 | $1.86 | 0d | 1 | 0.96mi |
| 1153 Williamsburg Rd Country Club Hills, IL | 2.0 | 1.5 | 1216 | $1,900 | $1.56 | 0d | 1 | 0.97mi |
| 4962 Bennett St Matteson, IL | 2.0–3.0 | 1.5–2.5 | 1341 | $3,120 | $2.33 | 0d | 7 | 1.41mi |
HOA detail condo
- Monthly dues
- $245 · $2,940/yr
- Assessments
- None detected in remarks — confirm with the listing agent.
Listing history 46 events
-
2026-06-21days on market $110,000 Active 7 DOM
-
2026-06-18days on market $110,000 Active 4 DOM
-
2026-06-17days on market $110,000 Active 3 DOM
-
2026-06-16days on market $110,000 Active 2 DOM
-
2026-06-15statusdays on market $110,000 Active 1 DOM
-
2026-06-09days on market $110,000 Contingent - Continue to Show 28 DOM
-
2026-06-08days on market $110,000 Contingent - Continue to Show 27 DOM
-
2026-06-07statusdays on market $110,000 Contingent - Continue to Show 26 DOM
-
2026-06-04days on market $110,000 Active 23 DOM
-
2026-06-03days on market $110,000 Active 22 DOM
-
2026-06-02days on market $110,000 Active 21 DOM
-
2026-06-01days on market $110,000 Active 20 DOM
-
2026-05-31days on market $110,000 Active 19 DOM
-
2026-05-21status Active
-
2026-05-21historical Contingent - Continue to Show
-
2026-05-12$110,000 Active
-
2026-05-12historical
-
2026-04-29status Active
-
2026-04-02historical Contingent - Continue to Show
-
2026-03-25price
-
2026-03-12price
-
2026-03-03Active
-
2026-01-21historical
-
2026-01-15status Temporarily No Showings
-
2026-01-05historical Contingent - No Showings
-
2025-12-16price
-
2025-12-04price
-
2025-11-18status Active
-
2025-10-20status Pending
-
2025-10-04price
-
2025-09-12status Temporarily No Showings
-
2025-08-24historical
-
2025-07-14Active
-
2025-07-14historical
-
2025-06-29price
-
2025-06-26Active
-
2025-05-16historical
-
2025-04-19Active
-
2015-06-02soldstatus $75,000 Closed Sale
-
2015-03-26historical Contingent
-
2014-12-17$79,900 New
-
2014-08-15price Closed Sale
-
2014-08-15soldstatus $23,000 Closed Sale
-
2014-04-04historical
-
2014-04-02price $29,640 Price Change
-
2014-03-28$32,000 New
ⓘ Source: listings_history table (triggers on properties + properties_extension) + one-shot
backfill from property_details.listing_events for pre-trigger history.
Climate risk First Street
- Flood 1/10 Low FEMA zone X (unshaded) · 0% chance over 30 yrs
- Wildfire 1/10 Low
- Heat 3/10 Moderate 7 d/yr ≥101°F today · 15 d/yr by 30 yrs out
- Wind 2/10 Low
- Air quality 2/10 Low 1 unhealthy d/yr today · 1 by 30 yrs out
Nearby sold comps map
Loading sold comps map…
Walkable amenities ~0.75 mi
Loading nearby amenities…
Taxation est. · year 1
- Rental income
- $28,473
- − Mortgage interest
- −$6,162
- − Property taxes
- −$1,650
- − Insurance
- −$550
- − Repairs & maintenance
- −$2,278
- − Management
- −$2,278
- − HOA
- −$2,940
- − Depreciation
- −$3,200
- Taxable income
- $9,416
- Est. tax owed @ 24.0%
- −$2,260
- After-tax cash flow
- $8,172/yr
For passive investors: Depreciation is non-cash, so a rental often shows a tax loss while cash-flowing — sheltering income. Rental losses are passive: they offset passive income freely, and up to $25,000/yr can offset ordinary (W-2) income if you actively participate and your MAGI is under $100k (phasing out to $0 by $150k); unused losses carry forward. On sale, claimed depreciation is recaptured at up to 25%, and gains may owe capital-gains tax (a 1031 exchange can defer both). Figures are a year-1 estimate at your 24.0% rate — not tax advice; consult a CPA.
Schools (NCES district)
- District
- Rich Twp Hsd 227
- NCES district ID
- 1733420
- Math proficiency
- 5% ▼ -3.00%
- Reading proficiency
- 12% ▬ 0.00%
- Median HH income
- $56,056
- Composite
- 8.93/100
- National rank
- #9885
- State rank
- #577 of 620 in IL
Livability — Country Club Hills
- Score
- 75/100
- State rank
- #212
- US rank
- #3963
Category grades
Schools grade is shown separately in the Schools card above.
Census & demographics
- Census place
- Country Club Hills, IL
- City population
- 16,549
- Population (ZIP)
- 16,549
Population outlook (Cook County) Hauer SSP2
- Today (2025)
- 5,347,519 people
- By 2030
- 5,357,703 · +0.2%
- By 2040
- 5,324,924 · -0.4%
- By 2050
- 5,230,762 · -2.2%
- By 2075
- 4,785,735 · -10.5%
- By 2100
- 4,188,836 · -21.7%
Race, ethnicity, and origin ACS 2023
- Neighborhood character
- Predominantly Black (87%)
- Race & ethnicity
- Black 87% White 8% Hispanic / Latino 4% Two or more races 3%
- Common ancestry
- Romanian 1%
- Foreign-born
- 4% · Canada
- Languages at home
- 96% English-only · Spanish 2%
Political lean MEDSL · Cook
- 2024 margin
- Solid D (+42.0) · D 70.4% · R 28.4% · Other 1.2%
- 2008→2024 swing
- -11.4pp toward R · 2008: 53.4pp · 2024: 42.0pp
- All cycles
- 2024: D+42.0 2020: D+50.3 2016: D+53.0 2012: D+49.4 2008: D+53.4
Not yet ingested
- Civics
- —
Market trends
- HPI YoY
- ▼ -79.73%
- Current HPI
- 212.3917
- Rent YoY
- —
- Metro
- —
- State GDP YoY
- ▲ 1.59%
- F500 in state
- 60
Industry mix (Fortune 500 HQ in IL)
| Industry | F500 HQs | Revenue |
|---|---|---|
| Insurance | 4 | $201B |
|
||
| Consumer Goods | 4 | $87B |
|
||
| Industrial Machinery | 3 | $64B |
|
||
| Healthcare | 2 | $55B |
|
||
| Retail / Pharmacy | 1 | $148B |
|
||
| Agriculture / Food | 1 | $86B |
|
||
Price history
+243.8% since first listed33 events — show timeline
- 2026-05-21 Relisted — MRED as Distributed by MLS Grid
- 2026-05-21 Contingent — MRED as Distributed by MLS Grid
- 2026-05-12 Listing Removed — MRED as Distributed by MLS Grid
- 2026-05-12 Listed $110,000 MRED as Distributed by MLS Grid
- 2026-04-29 Relisted — MRED as Distributed by MLS Grid
- 2026-04-02 Contingent — MRED as Distributed by MLS Grid
- 2026-03-25 Price Changed — MRED as Distributed by MLS Grid
- 2026-03-12 Price Changed — MRED as Distributed by MLS Grid
- 2026-03-03 Listed — MRED as Distributed by MLS Grid
- 2026-01-21 Listing Removed — MRED as Distributed by MLS Grid
- 2026-01-15 Relisted — MRED as Distributed by MLS Grid
- 2026-01-05 Contingent — MRED as Distributed by MLS Grid
- 2025-12-16 Price Changed — MRED as Distributed by MLS Grid
- 2025-12-04 Price Changed — MRED as Distributed by MLS Grid
- 2025-11-18 Relisted — MRED as Distributed by MLS Grid
- 2025-10-20 Pending — MRED as Distributed by MLS Grid
- 2025-10-04 Price Changed — MRED as Distributed by MLS Grid
- 2025-09-12 Relisted — MRED as Distributed by MLS Grid
- 2025-08-24 Listing Removed — MRED as Distributed by MLS Grid
- 2025-07-14 Listing Removed — MRED as Distributed by MLS Grid
- 2025-07-14 Listed — MRED as Distributed by MLS Grid
- 2025-06-29 Price Changed — MRED as Distributed by MLS Grid
- 2025-06-26 Listed — MRED as Distributed by MLS Grid
- 2025-05-16 Listing Removed — MRED as Distributed by MLS Grid
- 2025-04-19 Listed — MRED as Distributed by MLS Grid
- 2015-06-02 Sold (MLS) $75,000 MRED as Distributed by MLS Grid
- 2015-03-26 Contingent — MRED as Distributed by MLS Grid
- 2014-12-17 Listed $79,900 MRED as Distributed by MLS Grid
- 2014-08-15 Sold (MLS) $23,000 MRED as Distributed by MLS Grid
- 2014-08-15 Price Changed — MRED as Distributed by MLS Grid
- 2014-04-04 Listing Removed — MRED as Distributed by MLS Grid
- 2014-04-02 Price Changed $29,640 MRED as Distributed by MLS Grid
- 2014-03-28 Listed $32,000 MRED as Distributed by MLS Grid
Cash-flow waterfall
monthlySold comps — $/sqft
last 12 mo · ≤1 miLoading sold comps…