17 Orange St · Susanville, CA
Flood risk 1/10 · Minimal
- FEMA flood zone
- X (unshaded)
- Chance of flooding over 30 yrs
- 0.0%
- Est. flood insurance / yr
- $507 – $1,088
Fire risk 8/10 · Major
- Est. fire insurance / yr
- $659 – $1,223
Heat risk 4/10 · Minor
- Hot days now (above 92°F)
- 8 days/yr
- Hot days in 30 yrs
- 20 days/yr
Wind risk 1/10 · Minimal
- Chance of severe wind over 30 yrs
- —
Air-quality risk 10/10 · Severe
- Unhealthy air days now
- 30 days/yr
- Unhealthy air days in 30 yrs
- 31 days/yr
Risk factors via First Street. Map © Google.
Why this score? — see what drove the D grade
The composite is a weighted blend of 9 inputs, each scored 0–100. Each bar is that input's sub-score; the figure is the points it added to the 100-point composite (weight × sub-score).
- Cash flow +15.0/30.0
- ARV discount +7.5/15.0
- 1% rule +5.0/10.0
- DSCR +5.0/10.0
- Livability +3.2/5.0
- Schools +2.6/10.0
- Rent growth +2.5/5.0
- Condition / age +2.5/5.0
- Appreciation +0.0/10.0
$29,500
🖨 Deal sheet (PDF) 📄 Offer letter ✓ Due diligence
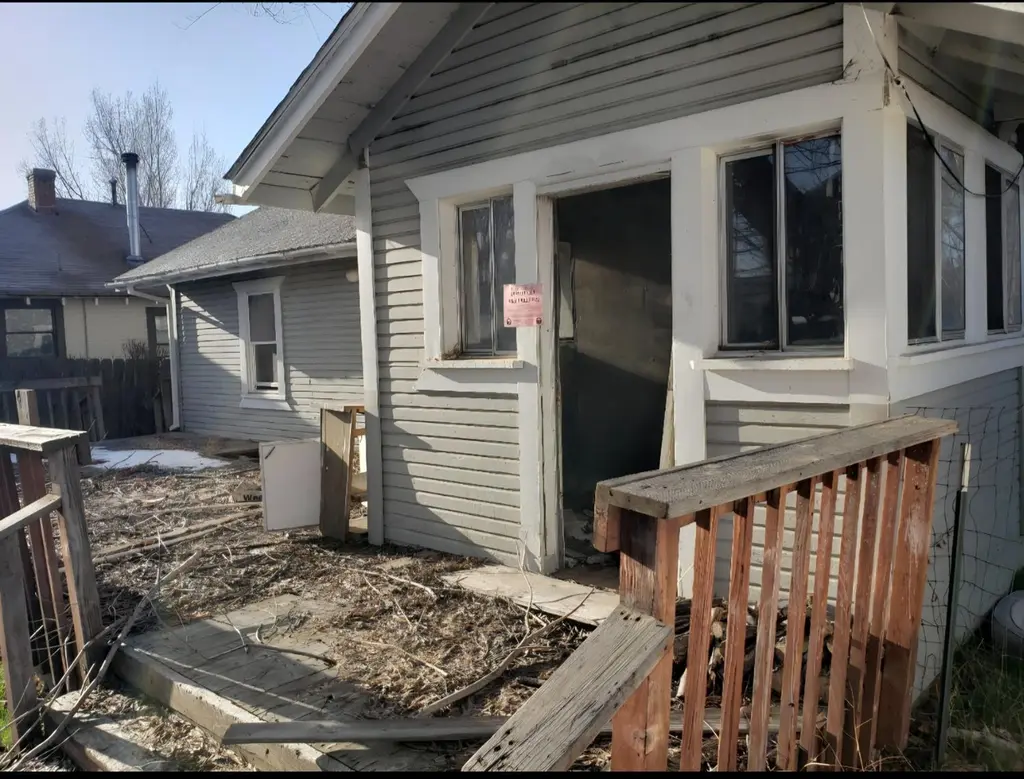
Listing remarks
Investor special!! Home had a complete remodel 6 years ago but extensive fire totaled the house at end of remodel. Needs major reconstruction or partial tear down to rebuild the fire areas. Deck in back and some areas of back of the house can be saved.
Key facts
- Complete remodel
- Major reconstruction
- Deck in back
Tags
Property features AI
Finance
- HOA & community: No homeowners association; Not a senior community
Exterior
- Parking: 2 garage spaces; No garage (alley access)
- Utilities: Natural gas connected; Public sewer; Water from district; 220 volts in laundry
- Home design: Detached single-family residence; Residential property; Built in 1935; Faces street entrance
- Construction: Composition roof
- Exterior features: Curb(s)/gutter(s); No room for horses indicated; No private pool or spa
Interior
- Kitchen: Built-in electric range; Dishwasher; Garbage disposal; Kitchen/family combo layout
- Bedrooms: 2 bedrooms (main level)
- Flooring: Laminate flooring
- Bathrooms: 2 full bathrooms; 1 half bathroom; Tub with shower over
- Heating & cooling: Central heating; Central air conditioning
- Interior features: Great room; Kitchen and family room combined; Breakfast nook; One level, single-story layout; Fixer condition
- Laundry & utility: Laundry area with cabinets; 220-volt outlet in laundry
Neighborhood map
What this means for you Summary
Snapshot
- This is a 2-bed/1.0-bath single-family listed at $30k.
Deal economics
- At list price, monthly cash flow is $854 ($10k/yr) — positive.
- The deal already cash-flows at list — no discount required.
- Meets the 1% rule at list price ($1k rent vs $30k).
- Recommended offer: $29k (3.0% below list) — sets the bar for market timing.
- Cap rate 41.0% vs local median 3.8% in Susanville — top-decile yield for the area; either an underpriced asset or a hidden risk that comps aren't pricing in. Stress-test before assuming the spread holds.
Location & tenants
- Location reads 64/100 on livability (#421 in CA) — a middle-class / working-renter tenant base. Strengths: housing A+, commute A-, health & safety A-; Watch: schools F, crime F, amenities F.
- Susanville Elementary (town): math 27% / reading 32% proficiency, ranked #350 of 517 in CA (top 68%) — low school quality limits family demand, transient renter base, plan for 1-2y turnover.
- Market conditions: 236 active listings in the ZIP; 4 comparable units currently listed for rent nearby; rentals at typical pace (median 22d on market — plan ~3-4 weeks tenant-placement turnaround); 6 units permitted in Lassen County in 2024 (0 in 5+ unit buildings).
Forward outlook
- Local home prices are declining (-3.0%/yr); year-one equity from $204 of loan paydown is wiped out by about $885 of value loss. Plan a longer hold.
- Lassen County population projected at -14% by 2050 — secular population decline; favor cash flow + early exit over multi-decade hold.
- At projected returns (-3.0% appreciation + 3.0% rent growth), your $8k cash investment doubles in ~1 year — after that, you're playing with house money.
Negotiation context
- It's been on market 54 days — a 3% lower offer ($29k) is reasonable based on typical stale-listing flexibility.
Risks & watch-outs
- Watch-outs: property tax is 3.1% of price; built in 1935 — expect roof / HVAC / electrical / plumbing capex.
- Climate carrying-cost: severe wildfire risk — expect insurance premiums to compound above CPI over the hold.
Questions for the listing agent
- It's been on market 54 days. Have you received any prior offers? Is the seller open to a 3% concession, seller financing, or rate buy-down credit?
- Built in 1935 — when were the roof, HVAC, electrical panel, plumbing, and water heater last replaced?
- Property tax is high relative to price — has the assessment been appealed recently, and will the sale trigger a re-assessment?
- Is there a deadline driving the sale (1031 exchange, divorce, estate, relocation)? That informs how much negotiation room exists.
- Schools are F-rated, which usually means shorter tenancies and higher turnover. Who's the typical renter profile here, and what's been the actual vacancy rate?
- Crime grade is F in this area — have there been break-ins, vandalism, or insurance claims at this property in the last 3 years? What carrier currently insures it and at what premium?
- The area grade is low — what's the realistic commute time and amenity access for the typical tenant pool here? Any planned neighborhood developments (good or bad) we should know about?
- What's the average days-on-market for RENTAL listings here right now (not sales)? A rising rental-DOM trend means longer vacancies and softer asking-rent achievability than the comps imply.
- What's the recent tenant-quality profile in this submarket — average credit score on applications, eviction rate, late-payment / NSF rate, and stable-employment percentage? A property-management company in the area should have these aggregated.
- How much new for-sale + rental construction is in the pipeline within 1–3 miles? Heavy new supply typically softens prices + rents 12–24 months out; constrained supply supports both.
Investment metrics
- 1% rule
- 4.71% ✓
- Cap rate
- 41.05%
- Cash-on-cash
- 124.13%
- DSCR
- 6.52
- GRM
- 1.8
CMA / ARV
- ARV (on-the-fly)
- $151,536
- Comps found
- 12
Show comp detail 12 sales within ~0.75 mi
| Address | Dist | Beds/Ba | Sqft | Sold | Price | $/sf | Match |
|---|---|---|---|---|---|---|---|
| 22 Sunkist Dr | 0.04mi | 3/2.0 (+1) | 1,426 (+5%) | 2mo | $130,000 | $91 | 79 |
| 1017 Orchard St | 0.36mi | 3/2.0 (+1) | 1,344 (-1%) | 1mo | $65,000 | $48 | 72 |
| 17 Upland St | 0.09mi | 3/1.0 (+1) | 1,218 (-10%) | 16mo | $136,000 | $112 | 61 |
| 130 S S Spring St | 0.51mi | 2/1.0 | 1,218 (-10%) | 3mo | $185,000 | $152 | 57 |
| 135 Park St | 0.52mi | 2/1.0 | 1,256 (-7%) | 9mo | $130,000 | $104 | 56 |
| 449 Pardee Ave | 0.17mi | 2/2.0 | 1,180 (-13%) | 14mo | $189,000 | $160 | 55 |
| 112 S Spring St | 0.54mi | 3/0.5 (+1) | 1,284 (-5%) | 6mo | $40,000 | $31 | 54 |
| 613 Richmond Rd | 0.41mi | 3/2.0 (+1) | 1,240 (-8%) | 6mo | $62,000 | $50 | 53 |
| 468 Alexander Ave | 0.16mi | 3/1.0 (+1) | 1,170 (-14%) | 15mo | $92,500 | $79 | 52 |
| 1765 N North St | 0.60mi | 3/2.0 (+1) | 1,426 (+5%) | 5mo | $275,000 | $193 | 50 |
| 625 Plum St | 0.53mi | 2/1.0 | 1,152 (-15%) | 16mo | $225,000 | $195 | 38 |
| 909 North St | 0.74mi | 2/1.0 | 1,152 (-15%) | 12mo | $159,000 | $138 | 31 |
Match score weights: distance 35% · size 25% · config 20% · recency 20%. Top-matched comps best support the ARV.
Projected returns pro-forma
-3.0% appreciation · 3.0% rent growth · sell at horizon
- IRR
- —
- Equity multiple
- 7.01×
- Total profit
- $49,684
- Equity at exit
- $4,399
- IRR
- —
- Equity multiple
- 14.74×
- Total profit
- $113,521
- Equity at exit
- $2,551
Cash invested: $8,260 (down + closing). Projections, not guarantees.
Landlord ↔ Tenant lean methodology
- Overall (STATE)
- 18 Strongly Tenant-Friendly
- State California
- 18 Strongly Tenant-Friendly · D+13
- County
- — inherits STATE
- City
- — inherits STATE
ZIP-level market 96130
- Active inventory
- 236
- Price-to-rent
- 1.8×
Monthly cashflow live
- Estimated rent
- $1,390 medium interval (Pro) →
- Mortgage (P&I)
- −$155
- Tax from tax record
- −$77 /mo · $925/yr
- Insurance
- −$12
- HOA
- −$0
- Vacancy / Maint / Mgmt
- −$292
- Net cashflow
- $854
Break-even live
Sensitivity live
| Price | -10% $871 | -5% $863 | +0% $854 | +5% $846 | +10% $838 |
|---|---|---|---|---|---|
| Rent | -10% $745 | -5% $799 | +0% $854 | +5% $909 | +10% $964 |
| Rate | -1.0pp $869 | -0.5pp $862 | base $854 | +0.5pp $847 | +1.0pp $839 |
UW: 25.0% down · 7.5% · 30yr · 1.5% tax · 5.0% vac · 8.0% maint · 8.0% mgmt
Financing live
Cash to close
- Down payment
- $7,375
- Closing costs
- $885
- Reserves months
- —
- Total cash needed
- —
Loan-product check · same deal, 3 products live
Conventional
25% down · 7.5% · 30yr
- Down + closing
- —
- Monthly P&I
- —
- Monthly cashflow
- —
- DSCR
- —
- Eligible?
- —
Personal DTI + credit; lowest rate.
DSCR
20% down · 8.5% · 30yr
- Down + closing
- —
- Monthly P&I
- —
- Monthly cashflow
- —
- DSCR
- —
- Eligible?
- —
No personal income docs; deal must DSCR.
Hard money
10% down · 12.0% · 12mo
- Down + closing
- —
- Monthly P&I
- —
- Monthly cashflow
- —
- DSCR
- —
- Eligible?
- —
Short-term bridge; refi at stabilization.
Rent comps 4 comps
| Address | Beds | Baths | Sqft | Rent | $/sqft | DOM | Units | Dist |
|---|---|---|---|---|---|---|---|---|
| 413 Pardee Ave Susanville, CA | 2.0 | 1.0 | 924 | $1,400 | $1.52 | 22d | 1 | 0.15mi |
| 55 S Sacramento St Susanville, CA | 2.0 | 2.0 | 1500 | $1,500 | $1.00 | 22d | 1 | 0.55mi |
| 200 Carroll St Unit 18 Susanville, CA | 2.0 | 1.5 | 1100 | $1,400 | $1.27 | 22d | 1 | 0.57mi |
| 525 Hall St Susanville, CA | 2.0 | 1.0 | 900 | $1,100 | $1.22 | 22d | 1 | 0.82mi |
Listing history 2 events
-
2006-05-25soldstatus $132,000
-
1991-11-19soldstatus $58,500
ⓘ Source: listings_history table (triggers on properties + properties_extension) + one-shot
backfill from property_details.listing_events for pre-trigger history.
Tax reassessment forecast CA · Resets to sale price
- Current annual tax
- $925 · $77/mo
- Projected year-2 tax
- $925 · $77/mo
- Expected delta
- $0/yr ($0/mo · 0.0%)
ⓘ Screening estimate from a state-policy table — verify with the county assessor before closing.
Climate risk First Street
- Flood 1/10 Low FEMA zone X (unshaded) · 0% chance over 30 yrs
- Wildfire 8/10 Severe
- Heat 4/10 Moderate 8 d/yr ≥92°F today · 20 d/yr by 30 yrs out
- Wind 1/10 Low
- Air quality 10/10 Extreme 30 unhealthy d/yr today · 31 by 30 yrs out
Nearby sold comps map
Loading sold comps map…
Walkable amenities ~0.75 mi
Loading nearby amenities…
Taxation est. · year 1
- Rental income
- $16,685
- − Mortgage interest
- −$1,652
- − Property taxes
- −$925
- − Insurance
- −$148
- − Repairs & maintenance
- −$1,335
- − Management
- −$1,335
- − Depreciation
- −$858
- Taxable income
- $10,433
- Est. tax owed @ 24.0%
- −$2,504
- After-tax cash flow
- $7,749/yr
For passive investors: Depreciation is non-cash, so a rental often shows a tax loss while cash-flowing — sheltering income. Rental losses are passive: they offset passive income freely, and up to $25,000/yr can offset ordinary (W-2) income if you actively participate and your MAGI is under $100k (phasing out to $0 by $150k); unused losses carry forward. On sale, claimed depreciation is recaptured at up to 25%, and gains may owe capital-gains tax (a 1031 exchange can defer both). Figures are a year-1 estimate at your 24.0% rate — not tax advice; consult a CPA.
Schools (NCES district)
- District
- Susanville Elementary
- NCES district ID
- 0638550
- Math proficiency
- 27% ▼ -6.00%
- Reading proficiency
- 32% ▬ 0.00%
- Median HH income
- $49,068
- Composite
- 25.69/100
- National rank
- #7387
- State rank
- #350 of 517 in CA
Livability — Susanville
- Score
- 64/100
- State rank
- #421
- US rank
- #14210
Category grades
Schools grade is shown separately in the Schools card above.
Census & demographics
- Census place
- Susanville, CA
- Population (ZIP)
- 20,892
Population outlook (Lassen County) Hauer SSP2
- Today (2025)
- 27,112 people
- By 2030
- 26,732 · -1.4%
- By 2040
- 25,536 · -5.8%
- By 2050
- 23,262 · -14.2%
- By 2075
- 18,620 · -31.3%
- By 2100
- 14,679 · -45.9%
Race, ethnicity, and origin ACS 2023
- Neighborhood character
- Diverse neighborhood (Simpson 0.60)
- Race & ethnicity
- White 57% Hispanic / Latino 26% Two or more races 17% Black 9% Native American 2% Pacific Islander 1% Asian 1%
- Hispanic origin (detail)
- Mexican 23%
- Common ancestry
- Iranian 2% Lithuanian 2% Slovak 2%
- Foreign-born
- 5% · Canada
- Languages at home
- 80% English-only · Spanish 16% Other Asian/Pacific 1% Other Indo-European 1%
Political lean MEDSL · Lassen
- 2024 margin
- Solid R (+54.0) · D 21.8% · R 75.8% · Other 2.4%
- 2008→2024 swing
- -19.8pp toward R · 2008: -34.2pp · 2024: -54.0pp
- All cycles
- 2024: R+54.0 2020: R+51.5 2016: R+51.3 2012: R+39.8 2008: R+34.2
Not yet ingested
- Civics
- —
Market trends
- HPI YoY
- ▼ -126.12%
- Current HPI
- 136.1585
- Rent YoY
- —
- Metro
- —
- State GDP YoY
- ▲ 3.21%
- F500 in state
- 116
Industry mix (Fortune 500 HQ in CA)
| Industry | F500 HQs | Revenue |
|---|---|---|
| Technology | 27 | $1,492B |
|
||
| Financial Services | 3 | $174B |
|
||
| Retail | 3 | $44B |
|
||
| Insurance | 3 | $26B |
|
||
| Media / Entertainment | 2 | $115B |
|
||
| Pharmaceuticals / Biotech | 2 | $62B |
|
||
Price history
+125.6% since first listed2 events — show timeline
- 2006-05-25 Sold (Public Records) $132,000 Public Records
- 1991-11-19 Sold (Public Records) $58,500 Public Records
Property tax history
+1.1%/yrLatest (2025): $925 · -42.4% YoY. Source: county tax records.
Cash-flow waterfall
monthlySold comps — $/sqft
last 12 mo · ≤1 miLoading sold comps…