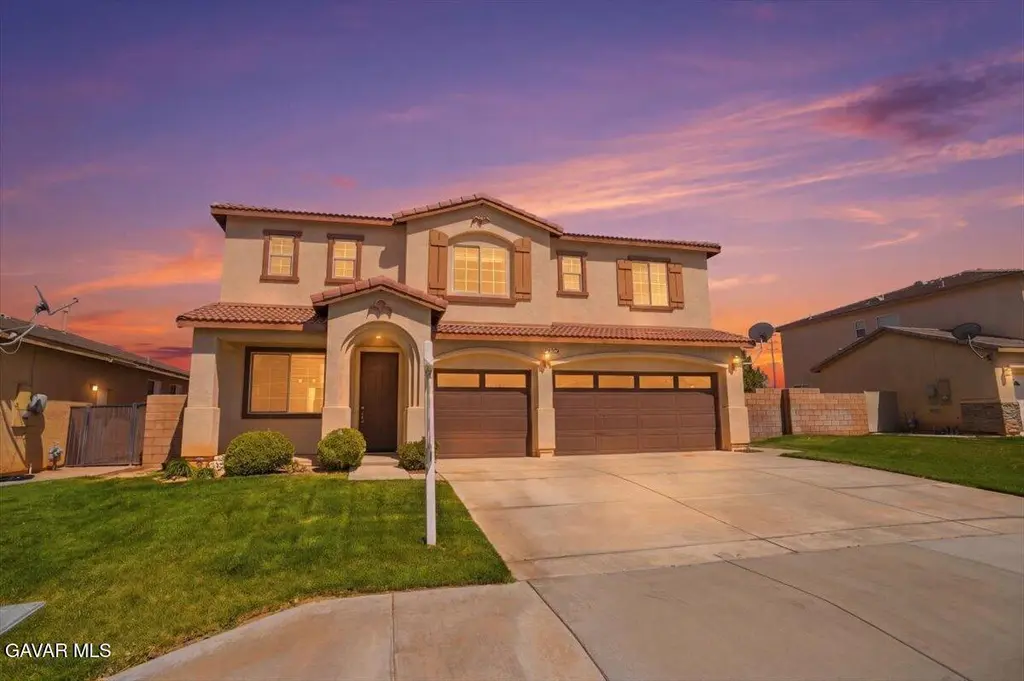
43624 W 57th St · Lancaster, CA
Flood risk 1/10 · Minimal
- FEMA flood zone
- X (shaded)
- Chance of flooding over 30 yrs
- 0.0%
- Est. flood insurance / yr
- $507 – $1,088
Fire risk 8/10 · Major
- Est. fire insurance / yr
- $659 – $1,223
Heat risk 7/10 · Major
- Hot days now (above 100°F)
- 5 days/yr
- Hot days in 30 yrs
- 13 days/yr
Wind risk 1/10 · Minimal
- Chance of severe wind over 30 yrs
- —
Air-quality risk 9/10 · Severe
- Unhealthy air days now
- 23 days/yr
- Unhealthy air days in 30 yrs
- 28 days/yr
Risk factors via First Street. Map © Google.
Why this score? — see what drove the D grade
The composite is a weighted blend of 9 inputs, each scored 0–100. Each bar is that input's sub-score; the figure is the points it added to the 100-point composite (weight × sub-score).
- Cash flow +11.3/30.0
- ARV discount +11.2/15.0
- Schools +4.1/10.0
- Livability +3.4/5.0
- DSCR +3.3/10.0
- 1% rule +2.6/10.0
- Condition / age +2.5/5.0
- Rent growth +2.2/5.0
- Appreciation +0.0/10.0
$571,999
🖨 Deal sheet 📄 Offer letter ✓ Due diligence
Listing remarks
Welcome to this amazing 5-bedroom former model home situated on a spacious approximately 7,200 sq. ft. lot. This beautifully upgraded home features newer laminate flooring upstairs along with new carpeting in the living room and family room. The spacious living room offers a cozy fireplace and flows into the dining area highlighted by a custom light fixture. The large family room features a second fireplace and overlooks the expansive backyard, creating the perfect space for relaxing or entertaining. The kitchen is designed for both function and style with granite countertops, a large center island, upgraded appliances including a range, built-in microwave, dishwasher, and a generous walk-i
Key facts
- 7,405 sq ft lot
- 3 garage spots
- Built 2006
Property features AI
Finance
- Financial info: Negotiable Home Protection Plan (HPP)
Exterior
- Parking: Attached garage with direct access (3 garage spaces)
- Utilities: Public water; Sewer connected; Natural gas service
- Home design: Contemporary style; 2 stories; Irregular lot shape; Property faces public street
- Construction: Stucco exterior; Tile roof; Concrete slab foundation; Built on tract Khov (TR=54401 L)
- Exterior features: Block fencing; Covered balcony and slab patio; Front and rear lawn
Interior
- Kitchen: Dishwasher; Gas range; Gas oven; Double oven; Garbage disposal
- Bedrooms: Downstairs bedroom included
- Flooring: Carpet; Laminate
- Bathrooms: 4 full bathrooms
- Heating & cooling: Central heating (natural gas); Central air conditioning
- Interior features: Gas fireplaces in family room, master bedroom and living room; Downstairs bedroom; Family room
- Laundry & utility: Dedicated laundry room
Neighborhood map
What this means for you Summary
Snapshot
- This is a 5-bed/4.0-bath single-family listed at $572k.
Deal economics
- At list price, monthly cash flow is $-209 ($-3k/yr) — negative.
- To cash-flow at today's rent, offer at most $535k (6.5% below list).
- To meet the 1% rule (rent ≥ 1% of price), the offer needs to be $434k (24.2% below list).
- Recommended offer: $434k (24.2% below list) — sets the bar for 1% rule.
- Cap rate 5.9% vs local median 4.3% in Lancaster — top-decile yield for the area; either an underpriced asset or a hidden risk that comps aren't pricing in. Stress-test before assuming the spread holds.
Location & tenants
- Location reads 68/100 on livability (#282 in CA) — a middle-class / working-renter tenant base. Strengths: commute A+, housing A+, amenities B+; Watch: health & safety C-, schools F, crime F.
- Westside Union Elementary (suburban): math 34% / reading 49% proficiency, ranked #565 of 1,400 in CA (top 40%) — families likely to look elsewhere, expect single-tenant / working-renter base with shorter leases.
- Market conditions: Rents soft (-1.2%/yr); 1129 active listings in the ZIP; 10 comparable units currently listed for rent nearby; rentals leasing fast (median 2d on market — plan ~1-2 weeks tenant-placement turnaround); solid renter incomes; 19,697 units permitted in Los Angeles County in 2024 (9,426 in 5+ unit buildings).
- At $4,337/mo this rent would consume 49% of the median local household income ($107k/yr) (locally 1998% of renters already pay >50% of income on rent) — very limited rent-growth headroom before tenants either downsize or default.
Forward outlook
- Local home prices are declining (-3.0%/yr); year-one equity from $4k of loan paydown is wiped out by about $17k of value loss. Plan a longer hold.
- Los Angeles County population projected at +9% by 2050 — modest demand growth; plan on rents tracking national, not racing it.
Negotiation context
- It's been on market 32 days — a 3% lower offer ($555k) is reasonable based on typical stale-listing flexibility.
- 4 sale attempts since 20y ago with the ask held roughly flat each time — persistent listings suggest the price (not the market) is what's stuck; bring a comps-based counter.
Risks & watch-outs
- Climate carrying-cost: severe wildfire risk; extreme-heat days projected 5→13/yr by 2055 (HVAC capex compounding) — expect insurance premiums to compound above CPI over the hold.
Questions for the listing agent
- What do current leases actually rent for vs. the listed asking? Can we see a recent rent roll and the last 12 months of T-12 income?
- It's been on market 32 days. Have you received any prior offers? Is the seller open to a 24% concession, seller financing, or rate buy-down credit?
- Is there a deadline driving the sale (1031 exchange, divorce, estate, relocation)? That informs how much negotiation room exists.
- Schools are F-rated, which usually means shorter tenancies and higher turnover. Who's the typical renter profile here, and what's been the actual vacancy rate?
- Crime grade is F in this area — have there been break-ins, vandalism, or insurance claims at this property in the last 3 years? What carrier currently insures it and at what premium?
- The area grade is low — what's the realistic commute time and amenity access for the typical tenant pool here? Any planned neighborhood developments (good or bad) we should know about?
- What's the average days-on-market for RENTAL listings here right now (not sales)? A rising rental-DOM trend means longer vacancies and softer asking-rent achievability than the comps imply.
- What's the recent tenant-quality profile in this submarket — average credit score on applications, eviction rate, late-payment / NSF rate, and stable-employment percentage? A property-management company in the area should have these aggregated.
- How much new for-sale + rental construction is in the pipeline within 1–3 miles? Heavy new supply typically softens prices + rents 12–24 months out; constrained supply supports both.
Investment metrics
- 1% rule
- 0.76% ✗
- Cap rate
- 5.85%
- Cash-on-cash
- -1.57%
- DSCR
- 0.93
- GRM
- 11.0
CMA / ARV
- ARV (on-the-fly)
- $622,790
- Comps found
- 12
Show comp detail 12 sales within ~0.75 mi
| Address | Dist | Beds/Ba | Sqft | Sold | Price | $/sf | Match |
|---|---|---|---|---|---|---|---|
| 43624 W 57th St | 0.00mi | 5/4.0 | 2,870 (0%) | 0mo | $587,500 | $205 | 100 |
| 43645 59th St W | 0.24mi | 4/2.5 (-1) | 2,825 (-2%) | 2mo | $605,000 | $214 | 73 |
| 5833 W Avenue J13 | 0.26mi | 4/3.0 (-1) | 2,825 (-2%) | 8mo | $520,000 | $184 | 70 |
| 43837 Madison Ct | 0.30mi | 5/3.0 | 2,650 (-8%) | 1mo | $620,000 | $234 | 69 |
| 43649 Brandon Thomas | 0.50mi | 5/3.0 | 2,965 (+3%) | 4mo | $585,000 | $197 | 63 |
| 5832 Spice St | 0.21mi | 4/3.0 (-1) | 2,605 (-9%) | 5mo | $565,000 | $217 | 62 |
| 43342 Harbor | 0.49mi | 5/3.0 | 2,731 (-5%) | 8mo | $559,000 | $205 | 58 |
| 44020 52nd W | 0.69mi | 5/3.5 | 3,045 (+6%) | 3mo | $675,000 | $222 | 53 |
| 43749 Tahoe | 0.62mi | 5/3.0 | 2,640 (-8%) | 3mo | $575,000 | $218 | 52 |
| 6147 W Ave K6 | 0.63mi | 4/3.0 (-1) | 2,744 (-4%) | 7mo | $599,000 | $218 | 48 |
| 43106 W 58th St | 0.68mi | 4/3.0 (-1) | 2,558 (-11%) | 7mo | $570,000 | $223 | 35 |
| 43142-43142 Hampton St | 0.67mi | 4/2.5 (-1) | 3,215 (+12%) | 4mo | $565,000 | $176 | 35 |
Match score weights: distance 35% · size 25% · config 20% · recency 20%. Top-matched comps best support the ARV.
Projected returns pro-forma
-3.0% appreciation · 0.0% rent growth · sell at horizon
- IRR
- -22.0%
- Equity multiple
- 0.26×
- Total profit
- $-118,842
- Equity at exit
- $85,287
- IRR
- -24.7%
- Equity multiple
- -0.06×
- Total profit
- $-170,279
- Equity at exit
- $49,456
Cash invested: $160,160 (down + closing). Projections, not guarantees.
Landlord ↔ Tenant lean methodology
- Overall (STATE)
- 18 Strongly Tenant-Friendly
- State California
- 18 Strongly Tenant-Friendly · D+13
- County
- — inherits STATE
- City
- — inherits STATE
ZIP-level market 93536
- Rents YoY
- -1.2%
- Active inventory
- 1129
- Price-to-rent
- 11.0×
Monthly cashflow live
- Estimated rent
- $4,337 high interval (Pro) →
- Mortgage (P&I)
- −$3,000
- Tax from tax record
- −$398 /mo · $4,772/yr
- Insurance
- −$238
- HOA
- −$0
- Vacancy / Maint / Mgmt
- −$911
- Net cashflow
- $-209
Break-even live
UW: 25.0% down · 7.5% · 30yr · 1.5% tax · 5.0% vac · 8.0% maint · 8.0% mgmt
Financing live
Cash to close
- Down payment
- $143,000
- Closing costs
- $17,160
- Reserves months
- —
- Total cash needed
- —
Loan-product check · same deal, 3 products live
Conventional
25% down · 7.5% · 30yr
- Down + closing
- —
- Monthly P&I
- —
- Monthly cashflow
- —
- DSCR
- —
- Eligible?
- —
Personal DTI + credit; lowest rate.
DSCR
20% down · 8.5% · 30yr
- Down + closing
- —
- Monthly P&I
- —
- Monthly cashflow
- —
- DSCR
- —
- Eligible?
- —
No personal income docs; deal must DSCR.
Hard money
10% down · 12.0% · 12mo
- Down + closing
- —
- Monthly P&I
- —
- Monthly cashflow
- —
- DSCR
- —
- Eligible?
- —
Short-term bridge; refi at stabilization.
Rent comps 10 comps
| Address | Beds | Baths | Sqft | Rent | $/sqft | DOM | Units | Dist |
|---|---|---|---|---|---|---|---|---|
| 43341 Harbor St Lancaster, CA | 4.0 | 3.0 | 2731 | $6,000 | $2.20 | 1d | 1 | 0.52mi |
| 6027 Oak Fence Ln Lancaster, CA | 4.0 | 3.0 | 3024 | $3,295 | $1.09 | 1d | 1 | 0.62mi |
| 5819 W Avenue K9 Lancaster, CA | 4.0 | 2.5 | 2970 | $3,100 | $1.04 | 1d | 1 | 0.68mi |
| 43130 62nd St W Lancaster, CA | 5.0 | 3.0 | 3196 | $7,000 | $2.19 | 1d | 1 | 0.81mi |
| 42965 56th St W Lancaster, CA | 4.0 | 2.5 | 2787 | $3,250 | $1.17 | 15d | 1 | 0.86mi |
| 44045 Quarter St Lancaster, CA | 6.0 | 4.5 | 3421 | $4,500 | $1.32 | 11d | 1 | 0.92mi |
| 4660 Spice St Lancaster, CA | 5.0 | 3.0 | 2817 | $3,700 | $1.31 | 1d | 1 | 1.01mi |
| 43647 46th St W Lancaster, CA | 5.0 | 3.0 | 3862 | $3,850 | $1.00 | 1d | 1 | 1.10mi |
| 6212 Pondera St Lancaster, CA | 4.0 | 2.0 | 2270 | $4,000 | $1.76 | 10d | 1 | 1.12mi |
| 5640 W Avenue L4 Lancaster, CA | 5.0 | 3.0 | 2874 | $3,200 | $1.11 | 1d | 1 | 1.36mi |
Listing history 15 events
-
2026-06-08statusdays on market $571,999 Pending 32 DOM
-
2026-06-07days on market $571,999 Active Under Contract 31 DOM
-
2026-06-04days on market $571,999 Active Under Contract 28 DOM
-
2026-06-03days on market $571,999 Active Under Contract 27 DOM
-
2026-06-02days on market $571,999 Active Under Contract 26 DOM
-
2026-06-01days on market $571,999 Active Under Contract 25 DOM
-
2026-05-31days on market $571,999 Active Under Contract 24 DOM
-
2026-05-15historical Active Under Contract
-
2026-05-07$571,999 Active
-
2015-03-17historical
-
2015-03-16historical
-
2011-11-22historical
-
2011-10-31$199,000
-
2007-02-15$499,900
-
2006-10-13$499,900
ⓘ Source: listings_history table (triggers on properties + properties_extension) + one-shot
backfill from property_details.listing_events for pre-trigger history.
Tax reassessment forecast CA · Resets to sale price
- Current annual tax
- $4,772 · $398/mo
- Projected year-2 tax
- $4,772 · $398/mo
- Expected delta
- $0/yr ($0/mo · 0.0%)
ⓘ Screening estimate from a state-policy table — verify with the county assessor before closing.
Climate risk First Street
- Flood 1/10 Low FEMA zone X (shaded) · 0% chance over 30 yrs
- Wildfire 8/10 Severe
- Heat 7/10 Severe 5 d/yr ≥100°F today · 13 d/yr by 30 yrs out
- Wind 1/10 Low
- Air quality 9/10 Extreme 23 unhealthy d/yr today · 28 by 30 yrs out
Nearby sold comps map
Loading sold comps map…
Walkable amenities ~0.75 mi
Loading nearby amenities…
Taxation est. · year 1
- Rental income
- $52,050
- − Mortgage interest
- −$32,041
- − Property taxes
- −$4,772
- − Insurance
- −$2,860
- − Repairs & maintenance
- −$4,164
- − Management
- −$4,164
- − Depreciation
- −$16,640
- Taxable loss
- −$12,591
- Est. tax savings @ 24.0%
- +$3,022
- After-tax cash flow
- $514/yr
For passive investors: Depreciation is non-cash, so a rental often shows a tax loss while cash-flowing — sheltering income. Rental losses are passive: they offset passive income freely, and up to $25,000/yr can offset ordinary (W-2) income if you actively participate and your MAGI is under $100k (phasing out to $0 by $150k); unused losses carry forward. On sale, claimed depreciation is recaptured at up to 25%, and gains may owe capital-gains tax (a 1031 exchange can defer both). Figures are a year-1 estimate at your 24.0% rate — not tax advice; consult a CPA.
Schools (NCES district)
- District
- Westside Union Elementary
- NCES district ID
- 0642120
- Math proficiency
- 34% ▲ 1.00%
- Reading proficiency
- 49% ▲ 1.00%
- Median HH income
- $80,763
- Composite
- 41.01/100
- National rank
- #7473
- State rank
- #565 of 1400 in CA
Livability — Lancaster
- Score
- 68/100
- State rank
- #282
- US rank
- #9504
Category grades
Schools grade is shown separately in the Schools card above.
Census & demographics
- Census place
- Lancaster, CA
- County
- Los Angeles County · 9,444,647 people
- City population
- 194,251
- Metro
- Los Angeles-Long Beach-Anaheim, CA
- Population (ZIP)
- 73,412
- Household income
- $106,903
- Rent vs Own
- Severe rent burden
- 1998.0
Population outlook (Los Angeles County) Hauer SSP2
- Today (2025)
- 10,940,515 people
- By 2030
- 11,256,481 · +2.9%
- By 2040
- 11,729,929 · +7.2%
- By 2050
- 11,948,407 · +9.2%
- By 2075
- 11,818,114 · +8.0%
- By 2100
- 10,842,928 · -0.9%
Race, ethnicity, and origin ACS 2023
- Neighborhood character
- Diverse neighborhood (Simpson 0.69)
- Race & ethnicity
- White 39% Hispanic / Latino 37% Two or more races 19% Black 13% Asian 5% Native American 1%
- Hispanic origin (detail)
- Mexican 28%
- Common ancestry
- Lithuanian 2% Slovak 1% Italian 1%
- Foreign-born
- 14% · Canada, China
- Languages at home
- 75% English-only · Spanish 19% Tagalog/Filipino 2% Arabic 1%
Political lean MEDSL · Los Angeles
- 2024 margin
- Solid D (+32.9) · D 64.8% · R 31.9% · Other 3.3%
- 2008→2024 swing
- -7.4pp toward R · 2008: 40.4pp · 2024: 32.9pp
- All cycles
- 2024: D+32.9 2020: D+44.2 2016: D+48.0 2012: D+40.0 2008: D+40.4
Not yet ingested
- Civics
- —
Market trends
- HPI YoY
- ▼ -268.64%
- Current HPI
- 357.0605
- Rent YoY
- ▼ -1.20%
- Metro
- Los Angeles-Long Beach-Anaheim, CA
- State GDP YoY
- ▲ 3.21%
- F500 in state
- 116
Industry mix (Fortune 500 HQ in CA)
| Industry | F500 HQs | Revenue |
|---|---|---|
| Technology | 27 | $1,492B |
|
||
| Financial Services | 3 | $174B |
|
||
| Retail | 3 | $44B |
|
||
| Insurance | 3 | $26B |
|
||
| Media / Entertainment | 2 | $115B |
|
||
| Pharmaceuticals / Biotech | 2 | $62B |
|
||
Price history
+14.4% since first listed8 events — show timeline
- 2026-05-15 Contingent — AVMLS
- 2026-05-07 Listed $571,999 AVMLS
- 2015-03-17 Listing Removed — AVMLS
- 2015-03-16 Listing Removed — AVMLS
- 2011-11-22 Listing Removed — AVMLS
- 2011-10-31 Listed $199,000 AVMLS
- 2007-02-15 Listed $499,900 AVMLS
- 2006-10-13 Listed $499,900 AVMLS
Property tax history
-0.2%/yrLatest (2025): $4,772 · +6.3% YoY. Source: county tax records.
Cash-flow waterfall
monthlySold comps — $/sqft
last 12 mo · ≤1 miLoading sold comps…