 🌊 Lakefront
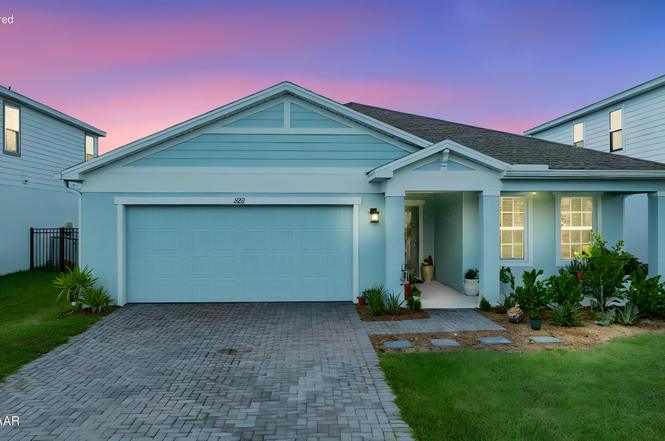
222 Eagle Harbor Way · Daytona Beach, FL
Flood risk 1/10 · Minimal
- FEMA flood zone
- X (unshaded)
- Chance of flooding over 30 yrs
- 0.0%
- Est. flood insurance / yr
- $507 – $1,088
Fire risk 8/10 · Major
- Est. fire insurance / yr
- $947 – $1,759
Heat risk 9/10 · Severe
- Hot days now (above 106°F)
- 7 days/yr
- Hot days in 30 yrs
- 19 days/yr
Wind risk 10/10 · Severe
- Chance of severe wind over 30 yrs
- 99.0%
Air-quality risk 2/10 · Minimal
- Unhealthy air days now
- 1 days/yr
- Unhealthy air days in 30 yrs
- 1 days/yr
Risk factors via First Street. Map © Google.
Why this score? — see what drove the D- grade
The composite is a weighted blend of 9 inputs, each scored 0–100. Each bar is that input's sub-score; the figure is the points it added to the 100-point composite (weight × sub-score).
- Cash flow +7.5/30.0
- ARV discount +7.5/15.0
- Livability +4.2/5.0
- Appreciation +4.0/10.0
- Rent growth +3.9/5.0
- Schools +3.9/10.0
- Condition / age +2.5/5.0
- 1% rule +2.4/10.0
- DSCR +1.7/10.0
$379,900
🖨 Deal sheet 📄 Offer letter ✓ Due diligence
Listing remarks
Located in Eagle Crest off LPGA Blvd in Daytona Beach, this 2023 built home is located in a smaller, more quaint community offering a quieter setting compared to larger high traffic neighborhoods. It's an excellent option for newer construction in a relaxed environment while still being close to everything including Tanger Outlets, shopping, restaurants, hospitals, doctor offices, Embry Riddle, Daytona State College, Father Lopez Catholic High School, and quick access to I-95 and I-4, with the beach and Speedway just a short drive away. The home sits on a nice lakefront lot with deep water views and a fully fenced yard offering privacy and a peaceful outdoor space. An upgraded elevation wit
Key facts
- Lakefront lot
- Upgraded elevation
- Nature preserve area
Tags
Property features AI
Finance
- HOA & community: Has homeowners association; Quarterly association fee of $265 (about $88.33/month)
Exterior
- Parking: 2-car garage
- Utilities: Public water; Sewer connected; Electricity connected; Cable available and connected
- Home design: Single-family residence; One level; Faces west
- Construction: Slab foundation
- Exterior features: Lakefront/pond waterfront; Waterfront lot
Interior
- Kitchen: Refrigerator; Microwave; Electric range; Electric oven; Dishwasher; Garbage disposal; Electric water heater
- Bathrooms: 2 full bathrooms
- Heating & cooling: Central heating; Electric heat pump; Central air conditioning; Electric cooling
- Interior features: Breakfast bar
- Laundry & utility: Washer; Dryer
Neighborhood map
What this means for you Summary
Snapshot
- This is a 3-bed/2.0-bath single-family listed at $380k.
Deal economics
- At list price, monthly cash flow is $-466 ($-6k/yr) — negative.
- To cash-flow at today's rent, offer at most $298k (21.7% below list).
- To meet the 1% rule (rent ≥ 1% of price), the offer needs to be $282k (25.7% below list).
- Recommended offer: $282k (25.7% below list) — sets the bar for 1% rule.
Location & tenants
- Location reads 83/100 on livability (#46 in FL, #867 nationally) — a professional / high-income tenant draw. Strengths: amenities A+, commute A+, cost of living A+; Watch: schools D+, employment D-.
- Volusia (suburban): math 44% / reading 49% proficiency, ranked #47 of 73 in FL (top 64%) — families likely to look elsewhere, expect single-tenant / working-renter base with shorter leases.
- Market conditions: Rents rising fast (+5.5%/yr); 333 active listings in the ZIP; 10 comparable units currently listed for rent nearby; rentals at typical pace (median 24d on market — plan ~3-4 weeks tenant-placement turnaround); solid renter incomes; 3,402 units permitted in Volusia County in 2024 (681 in 5+ unit buildings).
- This rent runs 37% of the median local income ($93k/yr) — at the standard rent-burdened threshold; future hikes will face affordability resistance.
Forward outlook
- Local home prices are declining (-2.0%/yr); year-one equity from $3k of loan paydown is wiped out by about $8k of value loss. Plan a longer hold.
- Volusia County population projected at +19% by 2050 — long-run rental-demand tailwind backs the buy-and-hold thesis.
Negotiation context
- Only 2 days on market — expect competitive offers; lowballing is unlikely to land.
- Current owner paid $278k; 37% above their basis — modest negotiation headroom, anchor on the comps not their cost.
Risks & watch-outs
- Climate carrying-cost: severe wind risk, 99% chance of damaging wind over 30y; severe wildfire risk; extreme-heat days projected 7→19/yr by 2055 (HVAC capex compounding) — expect insurance premiums to compound above CPI over the hold.
Questions for the listing agent
- What do current leases actually rent for vs. the listed asking? Can we see a recent rent roll and the last 12 months of T-12 income?
- What does the HOA fee cover, when was the last increase, and are there any pending special assessments or reserve-fund shortfalls?
- Is there a deadline driving the sale (1031 exchange, divorce, estate, relocation)? That informs how much negotiation room exists.
- Schools are D-rated, which usually means shorter tenancies and higher turnover. Who's the typical renter profile here, and what's been the actual vacancy rate?
- The area grade is low — what's the realistic commute time and amenity access for the typical tenant pool here? Any planned neighborhood developments (good or bad) we should know about?
- This sits on a lake — are riparian / water-frontage rights deeded with the parcel? Any dock permits, shoreline easements, or HOA water-use restrictions?
- What's the documented flood / surge / shoreline-erosion history here (FEMA AND non-FEMA — e.g., storm surge, creek backup, septic-field saturation)?
- Any water-quality or seasonal algae-bloom issues that affect tenant satisfaction or short-term-rental demand?
- What's the average days-on-market for RENTAL listings here right now (not sales)? A rising rental-DOM trend means longer vacancies and softer asking-rent achievability than the comps imply.
- What's the recent tenant-quality profile in this submarket — average credit score on applications, eviction rate, late-payment / NSF rate, and stable-employment percentage? A property-management company in the area should have these aggregated.
- How much new for-sale + rental construction is in the pipeline within 1–3 miles? Heavy new supply typically softens prices + rents 12–24 months out; constrained supply supports both.
Investment metrics
- 1% rule
- 0.74% ✗
- Cap rate
- 4.82%
- Cash-on-cash
- -5.26%
- DSCR
- 0.77
- GRM
- 11.2
CMA / ARV
No comps found within radius.
Projected returns pro-forma
-1.99% appreciation · 5.46% rent growth · sell at horizon
- IRR
- -16.0%
- Equity multiple
- 0.36×
- Total profit
- $-67,723
- Equity at exit
- $73,972
- IRR
- -5.8%
- Equity multiple
- 0.52×
- Total profit
- $-51,447
- Equity at exit
- $63,397
Cash invested: $106,372 (down + closing). Projections, not guarantees.
Landlord ↔ Tenant lean methodology
- Overall (STATE)
- 87 Strongly Landlord-Friendly
- State Florida
- 87 Strongly Landlord-Friendly · R+3
- County
- — inherits STATE
- City
- — inherits STATE
ZIP-level market 32124
- Home prices YoY
- -0.6%
- Rents YoY
- 5.5%
- Active inventory
- 333
- Price-to-rent
- 11.2×
Monthly cashflow live
- Estimated rent
- $2,821 high interval (Pro) →
- Mortgage (P&I)
- −$1,992
- Tax from tax record
- −$456 /mo · $5,476/yr
- Insurance
- −$158
- HOA
- −$88
- Vacancy / Maint / Mgmt
- −$592
- Net cashflow
- $-466
Break-even live
UW: 25.0% down · 7.5% · 30yr · 1.5% tax · 5.0% vac · 8.0% maint · 8.0% mgmt
Financing live
Cash to close
- Down payment
- $94,975
- Closing costs
- $11,397
- Reserves months
- —
- Total cash needed
- —
Loan-product check · same deal, 3 products live
Conventional
25% down · 7.5% · 30yr
- Down + closing
- —
- Monthly P&I
- —
- Monthly cashflow
- —
- DSCR
- —
- Eligible?
- —
Personal DTI + credit; lowest rate.
DSCR
20% down · 8.5% · 30yr
- Down + closing
- —
- Monthly P&I
- —
- Monthly cashflow
- —
- DSCR
- —
- Eligible?
- —
No personal income docs; deal must DSCR.
Hard money
10% down · 12.0% · 12mo
- Down + closing
- —
- Monthly P&I
- —
- Monthly cashflow
- —
- DSCR
- —
- Eligible?
- —
Short-term bridge; refi at stabilization.
Rent comps 10 comps
| Address | Beds | Baths | Sqft | Rent | $/sqft | DOM | Units | Dist |
|---|---|---|---|---|---|---|---|---|
| 1122 Cabot Cliffs Dr Daytona Beach, FL | 3.0 | 2.0 | 1432 | $3,200 | $2.23 | 14d | 1 | 0.46mi |
| 1153 Sand Trap Ct Daytona Beach, FL | 4.0 | 2.0 | 1936 | $2,395 | $1.24 | 21d | 1 | 0.59mi |
| 1100 Sand Trap Ct Daytona Beach, FL | 4.0 | 2.0 | 1935 | $2,600 | $1.34 | 23d | 1 | 0.69mi |
| 1142 Pacific Dunes Ct Daytona Beach, FL | 4.0 | 3.0 | 2010 | $2,599 | $1.29 | 23d | 1 | 0.72mi |
| 1098 Pacific Dunes Ct Daytona Beach, FL | 4.0 | 2.5 | 2576 | $3,000 | $1.16 | 23d | 1 | 0.81mi |
| 1139 Belle Isle Ln Daytona Beach, FL | 3.0 | 2.0 | 1429 | $2,195 | $1.54 | 14d | 1 | 0.99mi |
| 2220 Green Valley St Daytona Beach, FL | 3.0 | 2.0 | 1540 | $2,300 | $1.49 | 23d | 1 | 1.16mi |
| 5135 Magnolia Palm Dr Daytona Beach, FL | 3.0 | 2.0 | 1487 | $2,250 | $1.51 | 11d | 1 | 1.18mi |
| 1347 Belle Isle Ln Daytona Beach, FL | 4.0 | 2.0 | 1846 | $2,400 | $1.30 | 23d | 1 | 1.29mi |
| 207 Wentworth Grande Dr Daytona Beach, FL | 2.0 | 2.5 | 1288 | $2,100 | $1.63 | 23d | 1 | 1.49mi |
HOA detail
- Monthly dues
- $88 · $1,056/yr
- Likely covers
- water
Listing history 5 events
-
2026-06-18days on market $379,900 Active 2 DOM
-
2026-06-17price $379,900 Active 1 DOM
-
2026-06-17price $349,900 Active 1 DOM
-
2026-06-15remarks 699-char remark
-
2026-06-15$379,900 Active 1 DOM
ⓘ Source: listings_history table (triggers on properties + properties_extension) + one-shot
backfill from property_details.listing_events for pre-trigger history.
Tax reassessment forecast FL · Resets to sale price
- Current annual tax
- $5,476 · $456/mo
- Projected year-2 tax
- $5,476 · $456/mo
- Expected delta
- $0/yr ($0/mo · 0.0%)
ⓘ Screening estimate from a state-policy table — verify with the county assessor before closing.
Climate risk First Street
- Flood 1/10 Low FEMA zone X (unshaded) · 0% chance over 30 yrs
- Wildfire 8/10 Severe
- Heat 9/10 Extreme 7 d/yr ≥106°F today · 19 d/yr by 30 yrs out
- Wind 10/10 Extreme 99% chance of damaging wind over 30 yrs
- Air quality 2/10 Low 1 unhealthy d/yr today · 1 by 30 yrs out
Nearby sold comps map
Loading sold comps map…
Walkable amenities ~0.75 mi
Loading nearby amenities…
Taxation est. · year 1
- Rental income
- $33,854
- − Mortgage interest
- −$21,280
- − Property taxes
- −$5,476
- − Insurance
- −$1,900
- − Repairs & maintenance
- −$2,708
- − Management
- −$2,708
- − HOA
- −$1,056
- − Depreciation
- −$11,052
- Taxable loss
- −$12,326
- Est. tax savings @ 24.0%
- +$2,958
- After-tax cash flow
- $-2,636/yr
For passive investors: Depreciation is non-cash, so a rental often shows a tax loss while cash-flowing — sheltering income. Rental losses are passive: they offset passive income freely, and up to $25,000/yr can offset ordinary (W-2) income if you actively participate and your MAGI is under $100k (phasing out to $0 by $150k); unused losses carry forward. On sale, claimed depreciation is recaptured at up to 25%, and gains may owe capital-gains tax (a 1031 exchange can defer both). Figures are a year-1 estimate at your 24.0% rate — not tax advice; consult a CPA.
Schools (NCES district)
- District
- Volusia
- NCES district ID
- 1201920
- Math proficiency
- 44% ▼ -9.00%
- Reading proficiency
- 49% ▼ -3.00%
- Median HH income
- $42,946
- Composite
- 39.2/100
- National rank
- #4019
- State rank
- #47 of 73 in FL
Livability — Daytona Beach
- Score
- 83/100
- State rank
- #46
- US rank
- #867
Category grades
Schools grade is shown separately in the Schools card above.
Census & demographics
- Census place
- Daytona Beach, FL
- County
- Volusia County · 556,871 people
- City population
- 67,539
- Metro
- Deltona-Daytona Beach-Ormond Beach, FL
- Population (ZIP)
- 11,409
- Household income
- $92,616
- Rent vs Own
- Severe rent burden
- 54.0
Population outlook (Volusia County) Hauer SSP2
- Today (2025)
- 572,749 people
- By 2030
- 598,695 · +4.5%
- By 2040
- 644,880 · +12.6%
- By 2050
- 681,451 · +19.0%
- By 2075
- 759,957 · +32.7%
- By 2100
- 778,902 · +36.0%
Race, ethnicity, and origin ACS 2023
- Neighborhood character
- Predominantly White (71%)
- Race & ethnicity
- White 71% Black 20% Hispanic / Latino 5% Asian 2% Two or more races 1%
- Common ancestry
- Romanian 3% Italian 2% Portuguese 1%
- Foreign-born
- 10% · Canada, Mexico, South Korea
- Languages at home
- 91% English-only · Spanish 4% Other Asian/Pacific 1% Other Indo-European 1%
Political lean MEDSL · Volusia
- 2024 margin
- Strong R (+21.8) · D 38.7% · R 60.5%
- 2008→2024 swing
- -27.4pp toward R · 2008: 5.7pp · 2024: -21.8pp
- All cycles
- 2024: R+21.8 2020: R+14.1 2016: R+13.1 2012: R+1.2 2008: D+5.7
Not yet ingested
- Civics
- —
Market trends
- HPI YoY
- ▼ -1.99%
- Current HPI
- 311.7456
- Rent YoY
- ▲ 5.46%
- Metro
- Deltona-Daytona Beach-Ormond Beach, FL
- State GDP YoY
- ▲ 3.28%
- F500 in state
- 36
Industry mix (Fortune 500 HQ in FL)
| Industry | F500 HQs | Revenue |
|---|---|---|
| Industrial Technology | 2 | $29B |
|
||
| Insurance | 2 | $17B |
|
||
| Retail | 1 | $60B |
|
||
| Technology Distribution | 1 | $58B |
|
||
| Homebuilding | 1 | $35B |
|
||
| Technology Manufacturing | 1 | $35B |
|
||
Price history
+36.6% since first listed2 events — show timeline
- 2026-06-15 Listed $379,900 Daytona MLS
- 2023-09-21 Sold (Public Records) $278,191 Public Records
Property tax history
+192.1%/yrLatest (2025): $5,476 · -13.7% YoY. Source: county tax records.
Cash-flow waterfall
monthlySold comps — $/sqft
last 12 mo · ≤1 miLoading sold comps…