 🏷️ Likely Rental
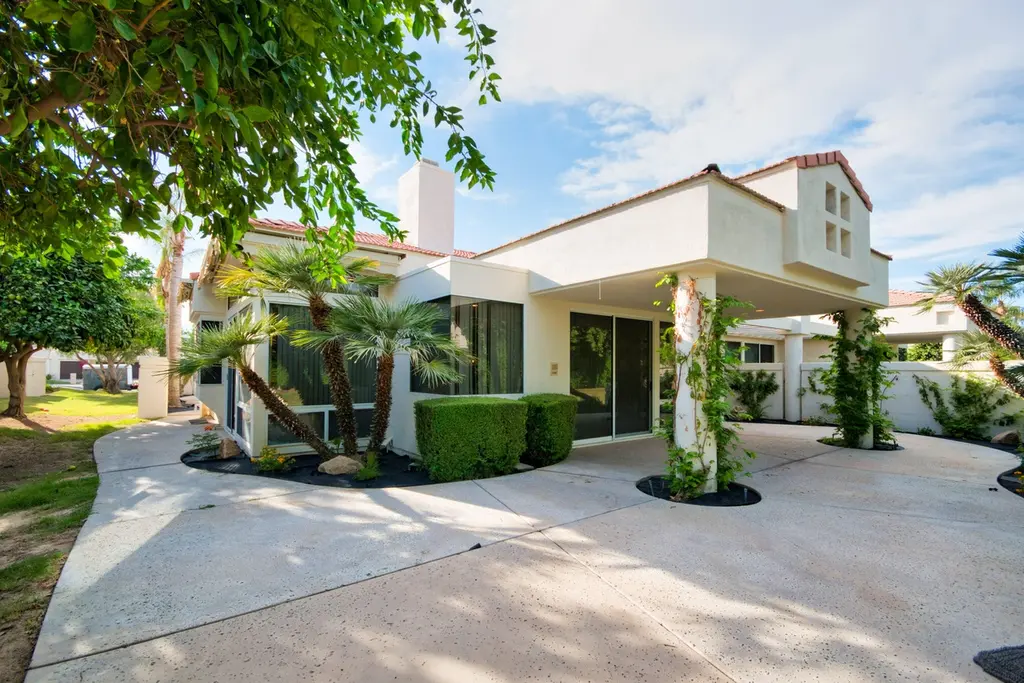
44980 Olympic Ct · Indian Wells, CA
Flood risk 1/10 · Minimal
- FEMA flood zone
- X
- Chance of flooding over 30 yrs
- 0.0%
- Est. flood insurance / yr
- $507 – $1,088
Fire risk 5/10 · Moderate
- Est. fire insurance / yr
- $659 – $1,223
Heat risk 9/10 · Severe
- Hot days now (above 111°F)
- 7 days/yr
- Hot days in 30 yrs
- 19 days/yr
Wind risk 1/10 · Minimal
- Chance of severe wind over 30 yrs
- —
Air-quality risk 4/10 · Minor
- Unhealthy air days now
- 5 days/yr
- Unhealthy air days in 30 yrs
- 6 days/yr
Risk factors via First Street. Map © Google.
Why this score? — see what drove the F grade
The composite is a weighted blend of 9 inputs, each scored 0–100. Each bar is that input's sub-score; the figure is the points it added to the 100-point composite (weight × sub-score).
- ARV discount +15.0/15.0
- Appreciation +6.9/10.0
- Schools +3.8/10.0
- Livability +2.7/5.0
- Rent growth +2.5/5.0
- Condition / age +2.5/5.0
- 1% rule +1.6/10.0
- Cash flow +0.0/30.0
- DSCR +0.0/10.0
$670,000
🖨 Deal sheet (PDF) 📄 Offer letter ✓ Due diligence
Listing remarks MLS
NOTE: Tenant in residence 2/28 - 4/15 showings by appointment only! Owner says 'Bring me an Offer!' A desirable remodeled great room floor plan located on a private cul-de-sac. This home features soaring ceilings, tile flooring, all new appliances and is offered fully furnished. This St. Andrews floor plan boast 3 bedrooms, 3 bathrooms, great room, dining room, breakfast nook and wet bar. An extra special lot location backing to a very private green belt and steps away from a community pool.
Key facts
- Community pool
- Remodeled great room
- New appliances
Tags
Neighborhood map
What this means for you Summary
Snapshot
- This is a 2-bed/3.0-bath condo listed at $670k.
Deal economics
- At list price, monthly cash flow is $-3k ($-41k/yr) — negative.
- To cash-flow at today's rent, offer at most $197k (70.6% below list).
- To meet the 1% rule (rent ≥ 1% of price), the offer needs to be $444k (33.7% below list).
- Recommended offer: $197k (70.6% below list) — sets the bar for cash-flow.
- Cap rate 0.2% vs local median 1.5% in Indian Wells — below-typical yield; the buyer is paying a premium for something (appreciation thesis, condition, location) that the cap rate doesn't capture.
Location & tenants
- Location reads 53/100 on livability (#968 in CA) — a working-class tenant base; expect higher turnover. Strengths: employment A+, schools B+, crime B+; Watch: amenities F, commute F, cost of living F.
- Desert Sands Unified (suburban): math 31% / reading 56% proficiency, ranked #199 of 517 in CA (top 38%) — families likely to look elsewhere, expect single-tenant / working-renter base with shorter leases.
- Market conditions: 150 active listings in the ZIP; 40 comparable units currently listed for rent nearby; rentals lingering (median 45d on market — plan ~5-8 weeks vacancy on turnover, expect pricing pressure); 70% of comp listings sitting > 30 days — soft ceiling on asking rent; high-income renter base; 9,195 units permitted in Riverside County in 2024 (1,512 in 5+ unit buildings).
- This rent runs 33% of the median local income ($163k/yr) — at the standard rent-burdened threshold; future hikes will face affordability resistance.
Forward outlook
- In year one you build about $30k of equity ($5k loan paydown + $25k appreciation (3.8% local appreciation)).
- Riverside County population projected at +22% by 2050 — long-run rental-demand tailwind backs the buy-and-hold thesis.
- By year 2, paydown + projected appreciation supports a ~$48k cash-out refi (75% LTV) — recoverable capital for the next deal without selling this one.
Negotiation context
- It's been on market 189 days — a 12% lower offer ($590k) is reasonable based on typical stale-listing flexibility.
- 11 sale attempts since 24y ago; this cycle's ask has dropped $79k (11%) from the opening price — seller is motivated, your offer sets the floor, not the list.
- Current owner paid $325k; list at $670k implies a 106% gain — meaningful room to come down on a strong offer.
Risks & watch-outs
- Watch-outs: HOA is 48% of rent.
- Climate carrying-cost: moderate wildfire risk; extreme-heat days projected 7→19/yr by 2055 (HVAC capex compounding) — expect insurance premiums to compound above CPI over the hold.
Questions for the listing agent
- What do current leases actually rent for vs. the listed asking? Can we see a recent rent roll and the last 12 months of T-12 income?
- It's been on market 189 days. Have you received any prior offers? Is the seller open to a 71% concession, seller financing, or rate buy-down credit?
- What does the HOA fee cover, when was the last increase, and are there any pending special assessments or reserve-fund shortfalls?
- Any open or pending special assessments — roof, HVAC, plumbing, elevator, façade? What's the per-unit balance and payoff schedule, and is the seller paying it off at close or rolling it to the buyer?
- Why hasn't it sold? Are there any deal-killer items the seller is aware of (foundation, flood, title, zoning, code violations)?
- Is there a deadline driving the sale (1031 exchange, divorce, estate, relocation)? That informs how much negotiation room exists.
- Schools are B-rated — typically a magnet for longer-tenancy family renters. What's the average tenant stay here, and is there a school-zone premium baked into asking?
- The area grade is low — what's the realistic commute time and amenity access for the typical tenant pool here? Any planned neighborhood developments (good or bad) we should know about?
- What's the average days-on-market for RENTAL listings here right now (not sales)? A rising rental-DOM trend means longer vacancies and softer asking-rent achievability than the comps imply.
- What's the recent tenant-quality profile in this submarket — average credit score on applications, eviction rate, late-payment / NSF rate, and stable-employment percentage? A property-management company in the area should have these aggregated.
- How much new apartment / multifamily construction is in the pipeline within 1–3 miles? Heavy new supply (>2% of stock underway) typically softens rents 12–24 months out; light construction supports rent growth.
Investment metrics
- 1% rule
- 0.66% ✗
- Cap rate
- 0.23%
- Cash-on-cash
- -21.67%
- DSCR
- 0.04
- GRM
- 12.6
CMA / ARV
- ARV (median comp)
- $1,235,640
- List price
- $670,000
- Delta
- -45.78%
- Verdict
- UNDERPRICED
- Comps
- 20 within 1.0 mi
Projected returns pro-forma
3.76% appreciation · 3.0% rent growth · sell at horizon
- IRR
- -9.3%
- Equity multiple
- 0.43×
- Total profit
- $-106,298
- Equity at exit
- $330,292
- IRR
- -3.3%
- Equity multiple
- 0.43×
- Total profit
- $-106,613
- Equity at exit
- $532,847
Cash invested: $187,600 (down + closing). Projections, not guarantees.
Landlord ↔ Tenant lean methodology
- Overall (STATE)
- 18 Strongly Tenant-Friendly
- State California
- 18 Strongly Tenant-Friendly · D+13
- County
- — inherits STATE
- City
- — inherits STATE
ZIP-level market 92210
- Home prices YoY
- 1.3%
- Active inventory
- 150
- Price-to-rent
- 12.6×
Monthly cashflow live
- Estimated rent
- $4,445 medium interval (Pro) →
- Mortgage (P&I)
- −$3,514
- Tax from tax record
- −$958 /mo · $11,500/yr
- Insurance
- −$279
- HOA
- −$2,148
- Vacancy / Maint / Mgmt
- −$933
- Net cashflow
- $-3,388
Break-even live
Sensitivity live
| Price | -10% $-3,008 | -5% $-3,198 | +0% $-3,388 | +5% $-3,577 | +10% $-3,767 |
|---|---|---|---|---|---|
| Rent | -10% $-3,739 | -5% $-3,563 | +0% $-3,388 | +5% $-3,212 | +10% $-3,036 |
| Rate | -1.0pp $-3,050 | -0.5pp $-3,217 | base $-3,388 | +0.5pp $-3,561 | +1.0pp $-3,738 |
UW: 25.0% down · 7.5% · 30yr · 1.5% tax · 5.0% vac · 8.0% maint · 8.0% mgmt
Financing live
Cash to close
- Down payment
- $167,500
- Closing costs
- $20,100
- Reserves months
- —
- Total cash needed
- —
Loan-product check · same deal, 3 products live
Conventional
25% down · 7.5% · 30yr
- Down + closing
- —
- Monthly P&I
- —
- Monthly cashflow
- —
- DSCR
- —
- Eligible?
- —
Personal DTI + credit; lowest rate.
DSCR
20% down · 8.5% · 30yr
- Down + closing
- —
- Monthly P&I
- —
- Monthly cashflow
- —
- DSCR
- —
- Eligible?
- —
No personal income docs; deal must DSCR.
Hard money
10% down · 12.0% · 12mo
- Down + closing
- —
- Monthly P&I
- —
- Monthly cashflow
- —
- DSCR
- —
- Eligible?
- —
Short-term bridge; refi at stabilization.
Rent comps 40 comps
| Address | Beds | Baths | Sqft | Rent | $/sqft | DOM | Units | Dist |
|---|---|---|---|---|---|---|---|---|
| 44970 Olympic Ct Indian Wells, CA | 3.0 | 3.0 | 2345 | $7,000 | $2.99 | 44d | 1 | 0.03mi |
| 75270 Inverness Dr Indian Wells, CA | 3.0 | 3.0 | 2568 | $11,000 | $4.28 | 44d | 1 | 0.09mi |
| 75323 Mansfield Dr Indian Wells, CA | 3.0 | 3.5 | 2697 | $7,000 | $2.60 | 44d | 1 | 0.17mi |
| 75395 Riviera Dr Indian Wells, CA | 2.0 | 3.0 | 2655 | $5,800 | $2.18 | 44d | 1 | 0.18mi |
| 75405 Riviera Dr Indian Wells, CA | 3.0 | 3.0 | 2773 | $10,500 | $3.79 | 44d | 1 | 0.19mi |
| 75425 Saint Andrews Ct Indian Wells, CA | 3.0 | 3.0 | 2644 | $8,500 | $3.21 | 44d | 1 | 0.19mi |
| 75211 Palisades Pl Indian Wells, CA | 3.0 | 3.5 | 2697 | $8,500 | $3.15 | 44d | 1 | 0.22mi |
| 75403 Mansfield Dr Indian Wells, CA | 3.0 | 3.5 | 2424 | $8,000 | $3.30 | 44d | 1 | 0.23mi |
| 75208 Citadel Pl Indian Wells, CA | 3.0 | 3.5 | 3299 | $10,500 | $3.18 | 44d | 1 | 0.24mi |
| 75407 Montecito Dr Indian Wells, CA | 3.0 | 4.5 | 3201 | $12,500 | $3.91 | 44d | 1 | 0.26mi |
| 74996 Tahoe Cir Indian Wells, CA | 3.0 | 3.0 | 2942 | $8,500 | $2.89 | 44d | 1 | 0.26mi |
| 74996 Tahoe Cir Indian Wells, CA | 3.0 | 3.0 | 2942 | $8,500 | $2.89 | 6d | 1 | 0.26mi |
| 44350 Michigan Ct Indian Wells, CA | 3.0 | 3.5 | 2368 | $7,200 | $3.04 | 44d | 1 | 0.28mi |
| 75309 Palm Shadow Dr Indian Wells, CA | 3.0 | 2.5 | 2128 | $7,500 | $3.52 | 25d | 1 | 0.29mi |
| 44397 Mesquite Dr Indian Wells, CA | 3.0 | 2.0 | 2117 | $8,000 | $3.78 | 44d | 1 | 0.36mi |
| 75562 Camino de Plata N Indian Wells, CA | 3.0 | 3.0 | 2064 | $5,500 | $2.66 | 0d | 1 | 0.38mi |
| 75543 Calle del Norte Indian Wells, CA | 3.0 | 2.0 | 1907 | $6,500 | $3.41 | 44d | 1 | 0.40mi |
| 75114 Concho Dr Indian Wells, CA | 3.0 | 3.0 | 2399 | $6,000 | $2.50 | 44d | 1 | 0.44mi |
| 74939 Via Lago Indian Wells, CA | 2.0 | 2.5 | 1947 | $5,810 | $2.98 | 44d | 1 | 0.44mi |
| 74939 Via Lago Indian Wells, CA | 2.0 | 2.5 | 1947 | $5,810 | $2.98 | 16d | 1 | 0.44mi |
| 45640 Rancho Palmeras Dr Indian Wells, CA | 2.0 | 3.0 | 2975 | $8,500 | $2.86 | 25d | 1 | 0.51mi |
| 75417 Spyglass Dr Indian Wells, CA | 3.0 | 3.5 | 2871 | $5,000 | $1.74 | 44d | 1 | 0.54mi |
| 74965 Fairway Dr Palm Desert, CA | 3.0 | 2.0 | 2060 | $5,000 | $2.43 | 44d | 1 | 0.56mi |
| 75577 Desert Horizons Dr Indian Wells, CA | 3.0 | 3.0 | 2413 | $7,500 | $3.11 | 44d | 1 | 0.61mi |
| 44842 Guadalupe Dr Indian Wells, CA | 3.0 | 4.0 | 3011 | $8,000 | $2.66 | 44d | 1 | 0.62mi |
| 44824 Del Dios Cir Indian Wells, CA | 3.0 | 3.0 | 2813 | $15,000 | $5.33 | 44d | 1 | 0.65mi |
| 44839 Oro Grande Cir Indian Wells, CA | 3.0 | 3.0 | 2813 | $8,500 | $3.02 | 44d | 1 | 0.65mi |
| 75593 Desert Horizons Dr Indian Wells, CA | 3.0 | 3.0 | 2745 | $9,500 | $3.46 | 44d | 1 | 0.68mi |
| 45455 Crow Cir Indian Wells, CA | 3.0 | 2.0 | 2082 | $5,000 | $2.40 | 44d | 1 | 0.74mi |
| 45805 Cielito Dr Indian Wells, CA | 3.0 | 4.0 | 2965 | $22,000 | $7.42 | 44d | 1 | 0.74mi |
| 44451 Kings Canyon Ln Palm Desert, CA | 3.0 | 2.5 | 2181 | $10,600 | $4.86 | 44d | 1 | 0.79mi |
| 70 Rocio Ct Palm Desert, CA | 3.0 | 2.5 | 2500 | $4,450 | $1.78 | 12d | 1 | 0.79mi |
| 44226 Kings Canyon Ln Palm Desert, CA | 3.0 | 2.5 | 2442 | $5,500 | $2.25 | 18d | 1 | 0.81mi |
| 45618 Panorama Dr Palm Desert, CA | 3.0 | 2.5 | 1682 | $2,600 | $1.55 | 44d | 1 | 0.86mi |
| 34946 Phyllis Jackson Ln Palm Desert, CA | 3.0 | 2.5 | 1600 | $3,400 | $2.12 | 19d | 1 | 0.87mi |
| 34921 Phyllis Jackson Ln Palm Desert, CA | 3.0 | 2.5 | 1600 | $3,375 | $2.11 | 19d | 1 | 0.87mi |
| 34934 Phyllis Jackson Ln Palm Desert, CA | 3.0 | 2.5 | 1600 | $3,400 | $2.12 | 19d | 1 | 0.87mi |
| 34931 Phyllis Jackson Ln Palm Desert, CA | 3.0 | 2.5 | 1600 | $3,375 | $2.11 | 19d | 1 | 0.87mi |
| 45480 Via Corona Indian Wells, CA | 3.0 | 2.0 | 2203 | $9,000 | $4.09 | 44d | 1 | 0.89mi |
| 76158 Via Montelena Indian Wells, CA | 3.0 | 3.5 | 2991 | $6,500 | $2.17 | 19d | 1 | 0.98mi |
HOA detail condo
- Monthly dues
- $2,148 · $25,776/yr
- Likely covers
- pool
- Assessments
- None detected in remarks — confirm with the listing agent.
Listing history 43 events
-
2026-06-21days on market $670,000 Active 189 DOM
-
2026-06-18days on market $670,000 Active 186 DOM
-
2026-06-17days on market $670,000 Active 185 DOM
-
2026-06-16days on market $670,000 Active 184 DOM
-
2026-06-15days on market $670,000 Active 183 DOM
-
2026-06-13days on market $670,000 Active 181 DOM
-
2026-06-09days on market $670,000 Active 177 DOM
-
2026-06-08days on market $670,000 Active 176 DOM
-
2026-06-07days on market $670,000 Active 175 DOM
-
2026-06-04days on market $670,000 Active 172 DOM
-
2026-06-03days on market $670,000 Active 171 DOM
-
2026-06-02days on market $670,000 Active 170 DOM
-
2026-06-01days on market $670,000 Active 169 DOM
-
2026-05-31days on market $670,000 Active 168 DOM
-
2026-04-11status Active 496-char remark
Show marketing remark (496 chars)
NOTE: Tenant in residence 2/28 - 4/15 showings by appointment only! Owner says 'Bring me an Offer!' A desirable remodeled great room floor plan located on a private cul-de-sac. This home features soaring ceilings, tile flooring, all new appliances and is offered fully furnished. This St. Andrews floor plan boast 3 bedrooms, 3 bathrooms, great room, dining room, breakfast nook and wet bar. An extra special lot location backing to a very private green belt and steps away from a community pool.
-
2025-12-04price $695,000 496-char remark
Show marketing remark (496 chars)
NOTE: Tenant in residence 2/28 - 4/15 showings by appointment only! Owner says 'Bring me an Offer!' A desirable remodeled great room floor plan located on a private cul-de-sac. This home features soaring ceilings, tile flooring, all new appliances and is offered fully furnished. This St. Andrews floor plan boast 3 bedrooms, 3 bathrooms, great room, dining room, breakfast nook and wet bar. An extra special lot location backing to a very private green belt and steps away from a community pool.
-
2025-11-03$749,000 Active 496-char remark
Show marketing remark (496 chars)
NOTE: Tenant in residence 2/28 - 4/15 showings by appointment only! Owner says 'Bring me an Offer!' A desirable remodeled great room floor plan located on a private cul-de-sac. This home features soaring ceilings, tile flooring, all new appliances and is offered fully furnished. This St. Andrews floor plan boast 3 bedrooms, 3 bathrooms, great room, dining room, breakfast nook and wet bar. An extra special lot location backing to a very private green belt and steps away from a community pool.
-
2025-10-31historical $9,500
-
2025-10-31historical
-
2025-10-26price $9,500
-
2025-10-12price $749,000
-
2025-10-08price $789,000
-
2025-10-01$799,000 Active
-
2025-08-15$5,000
-
2025-08-14historical $5,000
-
2025-07-29historical
-
2025-07-19$5,000
-
2025-07-19historical $5,000
-
2025-05-13$5,000
-
2025-05-06price $799,000
-
2025-04-17price $825,000
-
2025-04-07price $849,000
-
2025-03-24price $865,000
-
2025-03-10$899,000 Active
-
2025-02-24historical
-
2025-02-23$899,000
-
2024-05-30historical
-
2024-05-04$845,000 Active
-
2023-10-06historical $7,800
-
2023-09-30$7,800
-
2002-11-04historical
-
2002-11-04$425,000
-
1993-06-03soldstatus $325,000
ⓘ Source: listings_history table (triggers on properties + properties_extension) + one-shot
backfill from property_details.listing_events for pre-trigger history.
Tax reassessment forecast CA · Resets to sale price
- Current annual tax
- $11,500 · $958/mo
- Projected year-2 tax
- $11,500 · $958/mo
- Expected delta
- $0/yr ($0/mo · 0.0%)
ⓘ Screening estimate from a state-policy table — verify with the county assessor before closing.
Climate risk First Street
- Flood 1/10 Low FEMA zone X · 0% chance over 30 yrs
- Wildfire 5/10 Major
- Heat 9/10 Extreme 7 d/yr ≥111°F today · 19 d/yr by 30 yrs out
- Wind 1/10 Low
- Air quality 4/10 Moderate 5 unhealthy d/yr today · 6 by 30 yrs out
Nearby sold comps map
Loading sold comps map…
Walkable amenities ~0.75 mi
Loading nearby amenities…
Taxation est. · year 1
- Rental income
- $53,338
- − Mortgage interest
- −$37,530
- − Property taxes
- −$11,500
- − Insurance
- −$3,350
- − Repairs & maintenance
- −$4,267
- − Management
- −$4,267
- − HOA
- −$25,776
- − Depreciation
- −$19,491
- Taxable loss
- −$52,843
- Est. tax savings @ 24.0%
- +$12,682
- After-tax cash flow
- $-27,969/yr
For passive investors: Depreciation is non-cash, so a rental often shows a tax loss while cash-flowing — sheltering income. Rental losses are passive: they offset passive income freely, and up to $25,000/yr can offset ordinary (W-2) income if you actively participate and your MAGI is under $100k (phasing out to $0 by $150k); unused losses carry forward. On sale, claimed depreciation is recaptured at up to 25%, and gains may owe capital-gains tax (a 1031 exchange can defer both). Figures are a year-1 estimate at your 24.0% rate — not tax advice; consult a CPA.
Schools (NCES district)
- District
- Desert Sands Unified
- NCES district ID
- 0611110
- Math proficiency
- 31% ▼ -4.00%
- Reading proficiency
- 56% ▲ 7.00%
- Median HH income
- $54,957
- Composite
- 37.77/100
- National rank
- #4346
- State rank
- #199 of 517 in CA
Livability — Indian Wells
- Score
- 53/100
- State rank
- #968
- US rank
- #24559
Category grades
Schools grade is shown separately in the Schools card above.
Census & demographics
- Census place
- Indian Wells, CA
- County
- Riverside County · 2,287,001 people
- City population
- 4,871
- Metro
- Riverside-San Bernardino-Ontario, CA
- Population (ZIP)
- 4,871
- Household income
- $162,990
- Rent vs Own
- Severe rent burden
- 56.0
Population outlook (Riverside County) Hauer SSP2
- Today (2025)
- 2,664,475 people
- By 2030
- 2,802,692 · +5.2%
- By 2040
- 3,050,904 · +14.5%
- By 2050
- 3,256,783 · +22.2%
- By 2075
- 3,655,058 · +37.2%
- By 2100
- 3,766,594 · +41.4%
Race, ethnicity, and origin ACS 2023
- Neighborhood character
- Predominantly White (86%)
- Race & ethnicity
- White 86% Hispanic / Latino 5% Two or more races 5% Asian 3% Black 3%
- Common ancestry
- Slovak 5% Lithuanian 4% Romanian 3%
- Foreign-born
- 10% · Canada, China
- Languages at home
- 92% English-only · Spanish 3% Russian/Polish/Slavic 1% Tagalog/Filipino 1%
Political lean MEDSL · Riverside
- 2024 margin
- Toss-up / Even · D 48.0% · R 49.3% · Other 2.6%
- 2008→2024 swing
- -3.6pp toward R · 2008: 2.3pp · 2024: -1.3pp
- All cycles
- 2024: R+1.3 2020: D+8.0 2016: D+4.3 2012: R+0.4 2008: D+2.3
Not yet ingested
- Civics
- —
Market trends
- HPI YoY
- ▲ 3.76%
- Current HPI
- 299.2632
- Rent YoY
- —
- Metro
- Riverside-San Bernardino-Ontario, CA
- State GDP YoY
- ▲ 3.21%
- F500 in state
- 116
Industry mix (Fortune 500 HQ in CA)
| Industry | F500 HQs | Revenue |
|---|---|---|
| Technology | 27 | $1,492B |
|
||
| Financial Services | 3 | $174B |
|
||
| Retail | 3 | $44B |
|
||
| Insurance | 3 | $26B |
|
||
| Media / Entertainment | 2 | $115B |
|
||
| Pharmaceuticals / Biotech | 2 | $62B |
|
||
Price history
+113.8% since first listed29 events — show timeline
- 2026-04-11 Relisted — GPSMLS
- 2025-12-04 Price Changed $695,000 GPSMLS
- 2025-11-03 Listed $749,000 GPSMLS
- 2025-10-31 Rental Removed $9,500 CRMLS
- 2025-10-31 Listing Removed — CRMLS
- 2025-10-26 Price Changed $9,500 CRMLS
- 2025-10-12 Price Changed $749,000 CRMLS
- 2025-10-08 Price Changed $789,000 CRMLS
- 2025-10-01 Listed $799,000 CRMLS
- 2025-08-15 Listed for Rent $5,000 CRMLS
- 2025-08-14 Rental Removed $5,000 SDMLS
- 2025-07-29 Listing Removed — CRMLS
- 2025-07-19 Listed for Rent $5,000 SDMLS
- 2025-07-19 Rental Removed $5,000 CRMLS
- 2025-05-13 Listed for Rent $5,000 CRMLS
- 2025-05-06 Price Changed $799,000 CRMLS
- 2025-04-17 Price Changed $825,000 CRMLS
- 2025-04-07 Price Changed $849,000 CRMLS
- 2025-03-24 Price Changed $865,000 CRMLS
- 2025-03-10 Listed $899,000 CRMLS
- 2025-02-24 Listing Removed — CRMLS
- 2025-02-23 Listed $899,000 CRMLS
- 2024-05-30 Listing Removed — CRMLS
- 2024-05-04 Listed $845,000 CRMLS
- 2023-10-06 Rental Removed $7,800 CRMLS
- 2023-09-30 Listed for Rent $7,800 CRMLS
- 2002-11-04 Listed $425,000 GPSMLS
- 2002-11-04 Listing Removed — GPSMLS
- 1993-06-03 Sold (Public Records) $325,000 Public Records
Property tax history
+4.4%/yrLatest (2025): $11,500 · +3.6% YoY. Source: county tax records.
Cash-flow waterfall
monthlySold comps — $/sqft
last 12 mo · ≤1 miLoading sold comps…