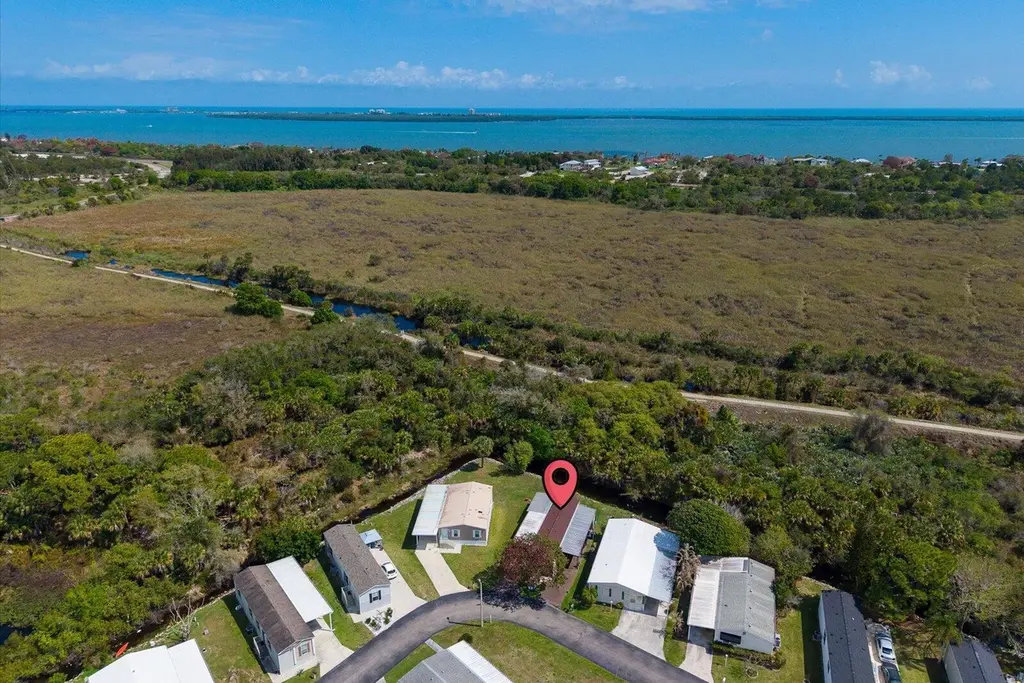
324 Mockingbird Ave · Fort Pierce, FL
Flood risk 1/10 · Minimal
- FEMA flood zone
- X (unshaded)
- Chance of flooding over 30 yrs
- 0.0%
- Est. flood insurance / yr
- $507 – $1,088
Fire risk 3/10 · Minor
- Est. fire insurance / yr
- $947 – $1,759
Heat risk 10/10 · Severe
- Hot days now (above 106°F)
- 7 days/yr
- Hot days in 30 yrs
- 25 days/yr
Wind risk 10/10 · Severe
- Chance of severe wind over 30 yrs
- 99.0%
Air-quality risk 2/10 · Minimal
- Unhealthy air days now
- 1 days/yr
- Unhealthy air days in 30 yrs
- 1 days/yr
Risk factors via First Street. Map © Google.
Why this score? — see what drove the B grade
The composite is a weighted blend of 9 inputs, each scored 0–100. Each bar is that input's sub-score; the figure is the points it added to the 100-point composite (weight × sub-score).
- Cash flow +30.0/30.0
- 1% rule +10.0/10.0
- DSCR +10.0/10.0
- ARV discount +7.5/15.0
- Rent growth +4.4/5.0
- Livability +3.8/5.0
- Schools +3.7/10.0
- Condition / age +2.2/5.0
- Appreciation +0.0/10.0
$49,500
🖨 Deal sheet 📄 Offer letter ✓ Due diligence
Key facts
- 5 parking spots
- Built 1988
- Listed 90 days
Property features AI
Finance
- HOA & community: Senior community; Pets allowed (restrictions possible)
Exterior
- Parking: Total 5 parking spaces; Attached carport with 3 covered/carport spaces; 2 open parking spaces
- Utilities: Public water; Public sewer; Cable available; Electricity available; Sewer available; Water available
- Home design: Manufactured home; One story; Resale condition; Faces southwest
- Construction: Aluminum siding; Composition roof; Built as of prior construction (year not provided)
- Exterior features: Covered patio; Screened porch; Patio; Porch; Zero lot line
Interior
- Kitchen: Dishwasher; Electric range; Microwave
- Bedrooms: 2 bedrooms on the main level
- Flooring: Carpet; Laminate
- Bathrooms: 2 full bathrooms (main level)
- Heating & cooling: Central electric heating; Central air conditioning (electric)
- Interior features: Built-in features; Vaulted ceilings; Split bedroom layout; Negotiable furnishing
- Laundry & utility: Laundry closet; Exterior laundry access
Neighborhood map
What this means for you Summary
Snapshot
- This is a 2-bed/2.0-bath manufactured listed at $50k. Condition is rated fair.
Deal economics
- At list price, monthly cash flow is $952 ($11k/yr) — positive.
- The deal already cash-flows at list — no discount required.
- Meets the 1% rule at list price ($2k rent vs $50k).
- Recommended offer: $47k (6.0% below list) — sets the bar for market timing.
- Cap rate 29.4% vs local median 3.7% in Fort Pierce — top-decile yield for the area; either an underpriced asset or a hidden risk that comps aren't pricing in. Stress-test before assuming the spread holds.
Location & tenants
- Location reads 76/100 on livability (#226 in FL, #3,360 nationally) — a middle-class / working-renter tenant base. Strengths: commute A+, cost of living A+, housing A+; Watch: crime D+, amenities F, employment F.
- St. Lucie (urban): math 40% / reading 48% proficiency, ranked #51 of 73 in FL (top 70%) — families likely to look elsewhere, expect single-tenant / working-renter base with shorter leases.
- Zoned schools: Weatherbee Elementary School (math 32% / reading 32%, grade F, #1,797 of 2,144 statewide, top 86%, 672 students, 90% FRL); Dan Mccarty Middle School (math 23% / reading 23%, grade F, #542 of 571 statewide, top 95%, 747 students, 88% FRL); Fort Pierce Central High School (math 15% / reading 45%, grade F, #441 of 667 statewide, top 67%, 3,091 students, 62% FRL) — zoned schools average 80% FRL vs 59% district-wide (21 pts higher); higher-poverty schools than district average — tighter screening recommended.
- Zoned-school proficiency averages 28% at this address vs 44% district-wide (-16 pts) — the specific schools serving this property underperform the St. Lucie average; the district grade overstates school quality for this exact location.
- Market conditions: Rents rising fast (+7.4%/yr); 336 active listings in the ZIP; 24 comparable units currently listed for rent nearby; rentals at typical pace (median 24d on market — plan ~3-4 weeks tenant-placement turnaround); 4,868 units permitted in St. Lucie County in 2024 (268 in 5+ unit buildings).
- This rent runs 36% of the median local income ($54k/yr) — at the standard rent-burdened threshold; future hikes will face affordability resistance.
Forward outlook
- Local home prices are declining (-3.0%/yr); year-one equity from $342 of loan paydown is wiped out by about $1k of value loss. Plan a longer hold.
- St. Lucie County population projected at +20% by 2050 — long-run rental-demand tailwind backs the buy-and-hold thesis.
- At projected returns (-3.0% appreciation + 7.4% rent growth), your $14k cash investment doubles in ~2 years — after that, you're playing with house money.
Negotiation context
- It's been on market 90 days — a 6% lower offer ($47k) is reasonable based on typical stale-listing flexibility.
Risks & watch-outs
- Climate carrying-cost: severe wind risk, 99% chance of damaging wind over 30y; extreme-heat days projected 7→25/yr by 2055 (HVAC capex compounding) — expect insurance premiums to compound above CPI over the hold.
Questions for the listing agent
- It's been on market 90 days. Have you received any prior offers? Is the seller open to a 6% concession, seller financing, or rate buy-down credit?
- Have any recent inspections been done? Can we get a copy of the seller's disclosures and any deferred-maintenance estimates?
- Why hasn't it sold? Are there any deal-killer items the seller is aware of (foundation, flood, title, zoning, code violations)?
- Is there a deadline driving the sale (1031 exchange, divorce, estate, relocation)? That informs how much negotiation room exists.
- Schools are D-rated, which usually means shorter tenancies and higher turnover. Who's the typical renter profile here, and what's been the actual vacancy rate?
- Crime grade is D in this area — have there been break-ins, vandalism, or insurance claims at this property in the last 3 years? What carrier currently insures it and at what premium?
- What's the average days-on-market for RENTAL listings here right now (not sales)? A rising rental-DOM trend means longer vacancies and softer asking-rent achievability than the comps imply.
- What's the recent tenant-quality profile in this submarket — average credit score on applications, eviction rate, late-payment / NSF rate, and stable-employment percentage? A property-management company in the area should have these aggregated.
- How much new for-sale + rental construction is in the pipeline within 1–3 miles? Heavy new supply typically softens prices + rents 12–24 months out; constrained supply supports both.
Investment metrics
- 1% rule
- 3.31% ✓
- Cap rate
- 29.38%
- Cash-on-cash
- 82.44%
- DSCR
- 4.67
- GRM
- 2.5
CMA / ARV
No comps found within radius.
Projected returns pro-forma
-3.0% appreciation · 7.42% rent growth · sell at horizon
- IRR
- 87.7%
- Equity multiple
- 5.35×
- Total profit
- $60,257
- Equity at exit
- $7,381
- IRR
- 91.8%
- Equity multiple
- 12.90×
- Total profit
- $164,873
- Equity at exit
- $4,280
Cash invested: $13,860 (down + closing). Projections, not guarantees.
Landlord ↔ Tenant lean methodology
- Overall (STATE)
- 87 Strongly Landlord-Friendly
- State Florida
- 87 Strongly Landlord-Friendly · R+3
- County
- — inherits STATE
- City
- — inherits STATE
ZIP-level market 34982
- Home prices YoY
- -33.4%
- Rents YoY
- 7.4%
- Active inventory
- 336
- Price-to-rent
- 2.5×
Monthly cashflow live
- Estimated rent
- $1,638 high interval (Pro) →
- Mortgage (P&I)
- −$260
- Tax est. 1.5%
- −$62 /mo · $742/yr
- Insurance
- −$21
- HOA
- −$0
- Vacancy / Maint / Mgmt
- −$344
- Net cashflow
- $952
Break-even live
UW: 25.0% down · 7.5% · 30yr · 1.5% tax · 5.0% vac · 8.0% maint · 8.0% mgmt
Financing live
Cash to close
- Down payment
- $12,375
- Closing costs
- $1,485
- Reserves months
- —
- Total cash needed
- —
Loan-product check · same deal, 3 products live
Conventional
25% down · 7.5% · 30yr
- Down + closing
- —
- Monthly P&I
- —
- Monthly cashflow
- —
- DSCR
- —
- Eligible?
- —
Personal DTI + credit; lowest rate.
DSCR
20% down · 8.5% · 30yr
- Down + closing
- —
- Monthly P&I
- —
- Monthly cashflow
- —
- DSCR
- —
- Eligible?
- —
No personal income docs; deal must DSCR.
Hard money
10% down · 12.0% · 12mo
- Down + closing
- —
- Monthly P&I
- —
- Monthly cashflow
- —
- DSCR
- —
- Eligible?
- —
Short-term bridge; refi at stabilization.
Rent comps 24 comps
| Address | Beds | Baths | Sqft | Rent | $/sqft | DOM | Units | Dist |
|---|---|---|---|---|---|---|---|---|
| 3200 S US Highway 1 Fort Pierce, FL | 2.0–3.0 | 1.0–2.0 | 1144 | $1,509 | $1.32 | 13d | 1 | 0.18mi |
| 916 Savannas Point Dr Fort Pierce, FL | 2.0 | 2.0 | 1120 | $2,100 | $1.88 | 13d | 1 | 0.52mi |
| 3261 S US Highway 1 Unit 1 Fort Pierce, FL | 1.0 | 1.0 | 576 | $1,050 | $1.82 | 23d | 1 | 0.64mi |
| 605 Ixoria Ave Fort Pierce, FL | 2.0 | 2.0 | 744 | $1,450 | $1.95 | 13d | 2 | 0.67mi |
| 605 Ixoria Ave #15 Fort Pierce, FL | 2.0 | 2.0 | 744 | $1,500 | $2.02 | 23d | 1 | 0.69mi |
| 410 Palm Ave Apt B Fort Pierce, FL | 2.0 | 1.0 | 800 | $1,400 | $1.75 | 13d | 1 | 0.71mi |
| 115 Maple Ave Fort Pierce, FL | 3.0 | 1.0 | 1008 | $1,999 | $1.98 | 23d | 1 | 0.74mi |
| 322 Colony Ln Unit C Fort Pierce, FL | 1.0 | 1.5 | 816 | $1,375 | $1.69 | 23d | 1 | 0.74mi |
| 617 Ixoria Ave Unit 2A Fort Pierce, FL | 2.0 | 2.5 | 764 | $1,500 | $1.96 | 23d | 1 | 0.75mi |
| 3266 S 7th St Fort Pierce, FL | 1.0 | 1.0 | 672 | $1,400 | $2.08 | 23d | 1 | 0.75mi |
| 2625 Heathcote Dr Unit 2623 Fort Pierce, FL | 2.0 | 2.0 | 1000 | $1,700 | $1.70 | 23d | 1 | 0.77mi |
| 2625 Heathcote Dr Unit 2631 Fort Pierce, FL | 2.0 | 2.0 | 1000 | $1,700 | $1.70 | 13d | 1 | 0.77mi |
| 2625 Heathcote Dr Unit 2647 Fort Pierce, FL | 2.0 | 2.0 | 1000 | $1,700 | $1.70 | 21d | 1 | 0.77mi |
| 800 Kanner Dr Unit B Fort Pierce, FL | 2.0 | 1.0 | 900 | $1,550 | $1.72 | 13d | 1 | 0.85mi |
| 802 N Lake Dr Unit B Fort Pierce, FL | 2.0 | 1.0 | 1000 | $1,550 | $1.55 | 23d | 1 | 0.90mi |
| 3300 S 7th St Unit B Fort Pierce, FL | 2.0 | 1.0 | 800 | $1,595 | $1.99 | 23d | 1 | 0.91mi |
| 947 Fra Mar Pl Fort Pierce, FL | 2.0 | 1.0 | 768 | $1,700 | $2.21 | 23d | 1 | 1.18mi |
| 2016 Golfview Ct Fort Pierce, FL | 2.0 | 1.0 | 1055 | $1,750 | $1.66 | 23d | 1 | 1.28mi |
| 2050 Oleander Blvd Unit 703 Fort Pierce, FL | 2.0 | 2.0 | 1014 | $1,800 | $1.78 | 23d | 1 | 1.30mi |
| 2302 Sunrise Blvd #201 Fort Pierce, FL | 2.0 | 1.0 | 966 | $1,500 | $1.55 | 23d | 1 | 1.42mi |
| 2015 Oleander Blvd Unit D Fort Pierce, FL | 1.0 | 1.5 | 660 | $1,475 | $2.23 | 23d | 1 | 1.45mi |
| 2050 Oleander Blvd Fort Pierce, FL | 1.0–2.0 | 1.0–2.0 | 833 | $2,350 | $2.82 | 23d | 4 | 1.46mi |
| 2016 S 10th St Unit A Fort Pierce, FL | 2.0 | 2.5 | 1120 | $1,595 | $1.42 | 23d | 1 | 1.46mi |
| 2011 Oleander Blvd Unit C Fort Pierce, FL | 1.0 | 1.5 | 660 | $1,450 | $2.20 | 23d | 1 | 1.48mi |
Listing history 17 events
-
2026-06-18days on market $49,500 Active 90 DOM
-
2026-06-17days on market $49,500 Active 89 DOM
-
2026-06-16days on market $49,500 Active 88 DOM
-
2026-06-15days on market $49,500 Active 87 DOM
-
2026-06-14days on market $49,500 Active 85 DOM
-
2026-06-13days on market $49,500 Active 84 DOM
-
2026-06-10days on market $49,500 Active 82 DOM
-
2026-06-09days on market $49,500 Active 81 DOM
-
2026-06-08days on market $49,500 Active 80 DOM
-
2026-06-07days on market $49,500 Active 79 DOM
-
2026-06-05days on market $49,500 Active 76 DOM
-
2026-06-03days on market $49,500 Active 75 DOM
-
2026-06-02days on market $49,500 Active 74 DOM
-
2026-06-01days on market $49,500 Active 73 DOM
-
2026-05-31days on market $49,500 Active 72 DOM
-
2026-05-30days on market $49,500 Active 71 DOM
-
2026-03-16$49,500 Active
ⓘ Source: listings_history table (triggers on properties + properties_extension) + one-shot
backfill from property_details.listing_events for pre-trigger history.
Climate risk First Street
- Flood 1/10 Low FEMA zone X (unshaded) · 0% chance over 30 yrs
- Wildfire 3/10 Moderate
- Heat 10/10 Extreme 7 d/yr ≥106°F today · 25 d/yr by 30 yrs out
- Wind 10/10 Extreme 99% chance of damaging wind over 30 yrs
- Air quality 2/10 Low 1 unhealthy d/yr today · 1 by 30 yrs out
Nearby sold comps map
Loading sold comps map…
Walkable amenities ~0.75 mi
Loading nearby amenities…
Taxation est. · year 1
- Rental income
- $19,659
- − Mortgage interest
- −$2,773
- − Property taxes
- −$742
- − Insurance
- −$248
- − Repairs & maintenance
- −$1,573
- − Management
- −$1,573
- − Depreciation
- −$1,440
- Taxable income
- $11,311
- Est. tax owed @ 24.0%
- −$2,715
- After-tax cash flow
- $8,711/yr
For passive investors: Depreciation is non-cash, so a rental often shows a tax loss while cash-flowing — sheltering income. Rental losses are passive: they offset passive income freely, and up to $25,000/yr can offset ordinary (W-2) income if you actively participate and your MAGI is under $100k (phasing out to $0 by $150k); unused losses carry forward. On sale, claimed depreciation is recaptured at up to 25%, and gains may owe capital-gains tax (a 1031 exchange can defer both). Figures are a year-1 estimate at your 24.0% rate — not tax advice; consult a CPA.
Condition & rehab AI · 13 photos
This manufactured home has a fair condition with some cosmetic updates needed to enhance its resale and rental value.
Repairs flagged
- Minor Exterior siding — Weathered appearance
- Minor Carpeted flooring — Worn condition
Value-add opportunities
- Both Paint interior walls — Fresh paint enhances curb appeal and interior aesthetics
- Both Replace carpeted flooring — New flooring improves comfort and value
- Both Clean and organize kitchen and bathroom — A clean and organized space is more appealing to potential buyers/renters
Renovation cost estimate screening
| Repair item | Severity | Est. cost |
|---|---|---|
| Exterior siding · Weathered appearance | Minor | $500–3,000 |
| Carpeted flooring · Worn condition | Minor | $500–3,000 |
| Total estimated repair cost · 2 items | $1,000–6,000 |
Value-add ROI direction
- Both Paint interior walls — Fresh paint enhances curb appeal and interior aesthetics ↑
- Both Replace carpeted flooring — New flooring improves comfort and value ↑
- Both Clean and organize kitchen and bathroom — A clean and organized space is more appealing to potential buyers/renters ↑
ⓘ Cost ranges are severity-bucket heuristics (US national rule-of-thumb). Get contractor quotes + a written scope before underwriting a rehab budget.
Schools (NCES district)
- District
- St. Lucie
- NCES district ID
- 1201770
- Math proficiency
- 40% ▼ -11.00%
- Reading proficiency
- 48% ▼ -4.00%
- Median HH income
- $44,737
- Composite
- 37.28/100
- National rank
- #4449
- State rank
- #51 of 73 in FL
Livability — Fort Pierce
- Score
- 76/100
- State rank
- #226
- US rank
- #3360
Category grades
Schools grade is shown separately in the Schools card above.
Census & demographics
- Census place
- Fort Pierce, FL
- County
- Saint Lucie County · 337,150 people
- City population
- 78,556
- Metro
- Port St. Lucie, FL
- Population (ZIP)
- 31,143
- Household income
- $54,082
- Rent vs Own
- Severe rent burden
- 1086.0
Population outlook (St. Lucie County) Hauer SSP2
- Today (2025)
- 338,016 people
- By 2030
- 355,687 · +5.2%
- By 2040
- 385,521 · +14.1%
- By 2050
- 406,106 · +20.1%
- By 2075
- 441,054 · +30.5%
- By 2100
- 436,885 · +29.2%
Race, ethnicity, and origin ACS 2023
- Neighborhood character
- Majority White (62%)
- Race & ethnicity
- White 62% Hispanic / Latino 22% Two or more races 12% Black 12%
- Hispanic origin (detail)
- Mexican 10% Puerto Rican 3% Cuban 3%
- Common ancestry
- Italian 7% Hispanic 2% Lithuanian 1%
- Foreign-born
- 12% · Canada
- Languages at home
- 80% English-only · Spanish 16% French/Haitian/Cajun 3%
Political lean MEDSL · St. Lucie
- 2024 margin
- Lean R (+9.1) · D 45.1% · R 54.2%
- 2008→2024 swing
- -21.2pp toward R · 2008: 12.1pp · 2024: -9.1pp
- All cycles
- 2024: R+9.1 2020: R+1.6 2016: R+2.5 2012: D+7.9 2008: D+12.1
Not yet ingested
- Civics
- —
Market trends
- HPI YoY
- ▼ -199.47%
- Current HPI
- 397.2649
- Rent YoY
- ▲ 7.42%
- Metro
- Port St. Lucie, FL
- State GDP YoY
- ▲ 3.28%
- F500 in state
- 36
Industry mix (Fortune 500 HQ in FL)
| Industry | F500 HQs | Revenue |
|---|---|---|
| Industrial Technology | 2 | $29B |
|
||
| Insurance | 2 | $17B |
|
||
| Retail | 1 | $60B |
|
||
| Technology Distribution | 1 | $58B |
|
||
| Homebuilding | 1 | $35B |
|
||
| Technology Manufacturing | 1 | $35B |
|
||
Price history
1 event — show timeline
- 2026-03-16 Listed $49,500 Beaches MLS
Cash-flow waterfall
monthlySold comps — $/sqft
last 12 mo · ≤1 miLoading sold comps…