300 Johnson Ferry Rd Unit B812 · Sandy Springs, GA
Flood risk 1/10 · Minimal
- FEMA flood zone
- X (unshaded)
- Chance of flooding over 30 yrs
- 0.0%
- Est. flood insurance / yr
- $507 – $1,088
Fire risk 1/10 · Minimal
- Est. fire insurance / yr
- $963 – $1,789
Heat risk 5/10 · Moderate
- Hot days now (above 103°F)
- 7 days/yr
- Hot days in 30 yrs
- 17 days/yr
Wind risk 4/10 · Minor
- Chance of severe wind over 30 yrs
- 20.0%
Air-quality risk 5/10 · Moderate
- Unhealthy air days now
- 6 days/yr
- Unhealthy air days in 30 yrs
- 8 days/yr
Risk factors via First Street. Map © Google.
Why this score? — see what drove the B- grade
The composite is a weighted blend of 9 inputs, each scored 0–100. Each bar is that input's sub-score; the figure is the points it added to the 100-point composite (weight × sub-score).
- Cash flow +27.1/30.0
- DSCR +9.4/10.0
- 1% rule +8.2/10.0
- ARV discount +7.5/15.0
- Schools +4.5/10.0
- Livability +3.7/5.0
- Condition / age +2.5/5.0
- Rent growth +2.4/5.0
- Appreciation +0.0/10.0
$139,000
🖨 Deal sheet 📄 Offer letter ✓ Due diligence
Listing remarks MLS
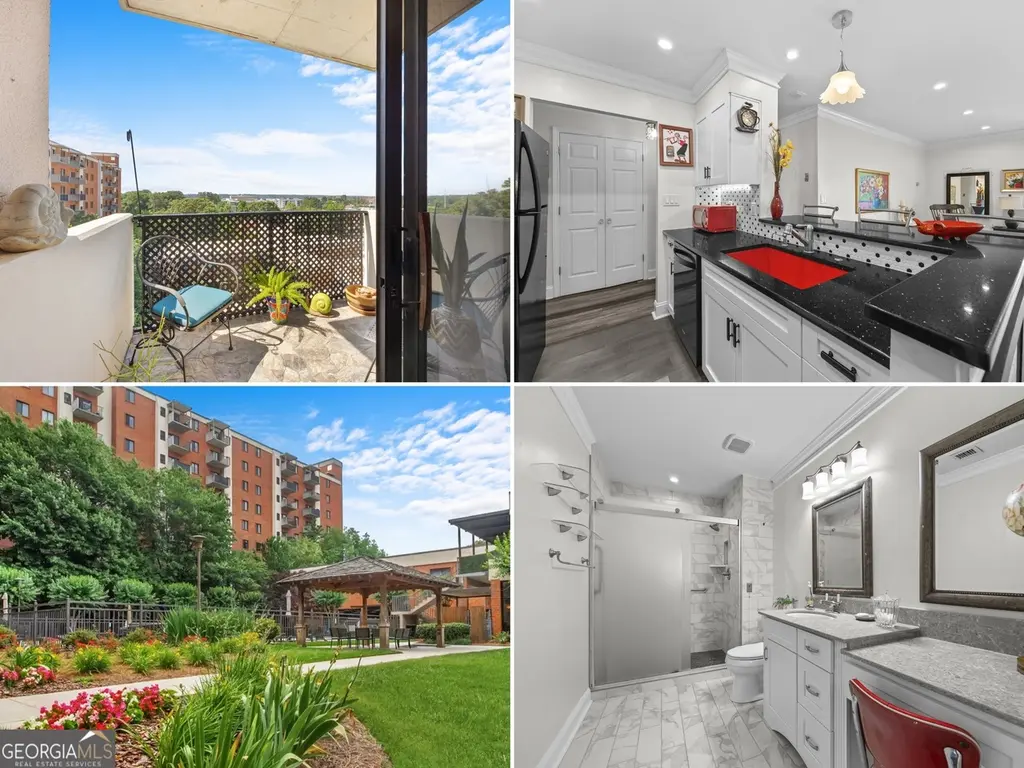
Welcome home to Mount Vernon Towers, a premier 55+ high rise community offering the perfect blend of comfort, convenience and maintenance free living. Perched on the 8th floor, this beautifully updated condo has stunning city views and overlooks the community pool, creating a picturesque setting to enjoy every day. Inside, you'll find a thoughtfully renovated kitchen featuring modern finishes. The updated tiled bathroom adds both style and functionality. The move in ready interior allows you to immediately begin enjoying everything this exceptional community has to offer. Mount Vernon Towers is known for its outstanding amenities and worry free lifestyle. HOA dues include a meal credit for on site dining, utilities, garbage service, local transportation within a five mile radius, a private storage locker, and access to a variety of community amenities. Residents can enjoy a swimming pool, library, 24-hour front desk security, and a full calendar of social activities designed to foster an active and engaging lifestyle. The location is simply unbeatable, placing you just minutes from grocery stores, restaurants, Trader Joe's, Sandy Springs Performing Arts Center and Civic Center, Chick-fil-A, medical offices, and the Sandy Springs Library. Whether you're seeking convenience, community, or peace of mind, this home delivers it all in one of Sandy Springs' most desirable active adult communities.
Key facts
- Community pool
- Tiled bathroom
- Swimming pool
Tags
Property features AI
Finance
- HOA & community: Association fee charged annually; Association covers electricity, grounds & structure maintenance, pest control, reserves, sewer, pool, trash, utilities and water; Community amenities include dog park, fitness center, pool, restaurant, and proximity to public transport and shopping
Exterior
- Parking: Assigned parking
- Security: Gated community
- Utilities: Public water; Public sewer; 220 volt electric service; Cable available; Electricity available; Phone available; Water available
- Home design: Condominium; One level; Resale property
- Construction: Brick construction; Tar/gravel roof
- Exterior features: Balcony; Asphalt road frontage on a city street
Interior
- Kitchen: White cabinets; Stone countertops; Dishwasher; Disposal; Refrigerator
- Bedrooms: One main-level bedroom
- Flooring: Ceramic tile; Laminate
- Bathrooms: One full bathroom; Master bathroom with shower-only
- Heating & cooling: Central heating; Central air
- Interior features: High speed internet; Double pane windows; Shared/common walls (2+)
- Laundry & utility: Laundry in common area
Neighborhood map
What this means for you Summary
Snapshot
- This is a 1-bed/1.0-bath condo listed at $139k.
Deal economics
- At list price, monthly cash flow is $394 ($5k/yr) — positive.
- The deal already cash-flows at list — no discount required.
- Meets the 1% rule at list price ($2k rent vs $139k).
- Cap rate 9.7% vs local median 2.7% in Sandy Springs — top-decile yield for the area; either an underpriced asset or a hidden risk that comps aren't pricing in. Stress-test before assuming the spread holds.
Location & tenants
- Location reads 73/100 on livability (#45 in GA) — a middle-class / working-renter tenant base. Strengths: employment A+, crime A-, commute A-; Watch: amenities F, cost of living F.
- Fulton County (suburban): math 49% / reading 53% proficiency, ranked #12 of 174 in GA (top 7%) — acceptable for families but not a draw, mixed tenant base, ~2y average lease.
- Zoned schools: High Point Elementary School (math 46% / reading 51%, grade D, #284 of 1,228 statewide, top 23%, 675 students, 48% FRL); Ridgeview Charter School (math 33% / reading 45%, grade F, #155 of 470 statewide, top 33%, 996 students, 45% FRL); Riverwood International Charter School (math 24% / reading 10%, grade F, #269 of 424 statewide, top 65%, 1,737 students, 30% FRL) — zoned schools at 41% FRL track the district average.
- Zoned-school proficiency averages 35% at this address vs 51% district-wide (-16 pts) — the specific schools serving this property underperform the Fulton County average; the district grade overstates school quality for this exact location.
- Market conditions: Rents soft (-0.2%/yr); 369 active listings in the ZIP; 40 comparable units currently listed for rent nearby; rentals at typical pace (median 17d on market — plan ~3-4 weeks tenant-placement turnaround); high-income renter base; 11,565 units permitted in Fulton County in 2024 (8,159 in 5+ unit buildings).
Forward outlook
- Local home prices are declining (-3.0%/yr); year-one equity from $961 of loan paydown is wiped out by about $4k of value loss. Plan a longer hold.
- Fulton County population projected at +38% by 2050 — long-run rental-demand tailwind backs the buy-and-hold thesis.
Negotiation context
- Only 14 days on market — expect competitive offers; lowballing is unlikely to land.
- 2 sale attempts; this cycle's ask has dropped $11k (7%) from the opening price — seller is motivated, your offer sets the floor, not the list.
Risks & watch-outs
- Climate carrying-cost: extreme-heat days projected 7→17/yr by 2055 (HVAC capex compounding) — expect insurance premiums to compound above CPI over the hold.
Questions for the listing agent
- What does the HOA fee cover, when was the last increase, and are there any pending special assessments or reserve-fund shortfalls?
- Any open or pending special assessments — roof, HVAC, plumbing, elevator, façade? What's the per-unit balance and payoff schedule, and is the seller paying it off at close or rolling it to the buyer?
- Is there a deadline driving the sale (1031 exchange, divorce, estate, relocation)? That informs how much negotiation room exists.
- What's the average days-on-market for RENTAL listings here right now (not sales)? A rising rental-DOM trend means longer vacancies and softer asking-rent achievability than the comps imply.
- What's the recent tenant-quality profile in this submarket — average credit score on applications, eviction rate, late-payment / NSF rate, and stable-employment percentage? A property-management company in the area should have these aggregated.
- How much new apartment / multifamily construction is in the pipeline within 1–3 miles? Heavy new supply (>2% of stock underway) typically softens rents 12–24 months out; light construction supports rent growth.
Investment metrics
- 1% rule
- 1.32% ✓
- Cap rate
- 9.69%
- Cash-on-cash
- 12.14%
- DSCR
- 1.54
- GRM
- 6.3
CMA / ARV
No comps found within radius.
Projected returns pro-forma
-3.0% appreciation · 0.0% rent growth · sell at horizon
- IRR
- -1.9%
- Equity multiple
- 0.93×
- Total profit
- $-2,750
- Equity at exit
- $20,725
- IRR
- 3.9%
- Equity multiple
- 1.24×
- Total profit
- $9,412
- Equity at exit
- $12,018
Cash invested: $38,920 (down + closing). Projections, not guarantees.
Landlord ↔ Tenant lean methodology
- Overall (STATE)
- 90 Strongly Landlord-Friendly
- State Georgia
- 90 Strongly Landlord-Friendly · R+3
- County
- — inherits STATE
- City
- — inherits STATE
ZIP-level market 30328
- Rents YoY
- -0.2%
- Active inventory
- 369
- Price-to-rent
- 6.3×
Monthly cashflow live
- Estimated rent
- $1,841 high interval (Pro) →
- Mortgage (P&I)
- −$729
- Tax from tax record
- −$153 /mo · $1,834/yr
- Insurance
- −$58
- HOA
- −$121
- Vacancy / Maint / Mgmt
- −$387
- Net cashflow
- $394
Break-even live
UW: 25.0% down · 7.5% · 30yr · 1.5% tax · 5.0% vac · 8.0% maint · 8.0% mgmt
Financing live
Cash to close
- Down payment
- $34,750
- Closing costs
- $4,170
- Reserves months
- —
- Total cash needed
- —
Loan-product check · same deal, 3 products live
Conventional
25% down · 7.5% · 30yr
- Down + closing
- —
- Monthly P&I
- —
- Monthly cashflow
- —
- DSCR
- —
- Eligible?
- —
Personal DTI + credit; lowest rate.
DSCR
20% down · 8.5% · 30yr
- Down + closing
- —
- Monthly P&I
- —
- Monthly cashflow
- —
- DSCR
- —
- Eligible?
- —
No personal income docs; deal must DSCR.
Hard money
10% down · 12.0% · 12mo
- Down + closing
- —
- Monthly P&I
- —
- Monthly cashflow
- —
- DSCR
- —
- Eligible?
- —
Short-term bridge; refi at stabilization.
Rent comps 40 comps
| Address | Beds | Baths | Sqft | Rent | $/sqft | DOM | Units | Dist |
|---|---|---|---|---|---|---|---|---|
| 300 Johnson Ferry Rd NE Sandy Springs, GA | 1.0–2.0 | 1.0–2.0 | 760 | $1,950 | $2.57 | 43d | 2 | 0.05mi |
| 300 Johnson Ferry Rd NE Sandy Springs, GA | 1.0–2.0 | 1.0–2.0 | 760 | $2,395 | $3.15 | 16d | 2 | 0.05mi |
| 6125 Roswell Rd Atlanta, GA | 1.0–3.0 | 1.0–3.0 | 1170 | $1,669 | $1.43 | 1d | 15 | 0.26mi |
| 381 Hilderbrand Dr Atlanta, GA | 2.0 | 1.0 | 1061 | $2,400 | $2.26 | 43d | 1 | 0.28mi |
| 6300 Blue Stone Rd Atlanta, GA | 1.0–3.0 | 1.0–2.0 | 1058 | $1,983 | $1.87 | 1d | 19 | 0.32mi |
| 6400 Blue Stone Rd Sandy Springs, GA | 1.0–2.0 | 1.0–2.0 | 893 | $1,975 | $2.21 | 12d | 1 | 0.32mi |
| 6400 Blue Stone Rd Sandy Springs, GA | 1.0–2.0 | 1.0–2.0 | 893 | $2,019 | $2.26 | 2d | 4 | 0.32mi |
| 6105 Blue Stone Rd #413 Atlanta, GA | 1.0 | 1.0 | 1098 | $2,200 | $2.00 | 4d | 1 | 0.35mi |
| 6075 Roswell Rd Atlanta, GA | 2.0 | 1.0–2.0 | 1015 | $2,344 | $2.31 | 1d | 25 | 0.35mi |
| 220 Sandy Springs Pl NE Apt D Atlanta, GA | 1.0 | 1.0 | 792 | $1,550 | $1.96 | 43d | 1 | 0.37mi |
| 475 Mount Vernon Hwy NE Atlanta, GA | 1.0 | 1.0 | 700 | $2,945 | $4.21 | 24d | 2 | 0.44mi |
| 475 Mount Vernon Hwy NE Unit C225 Atlanta, GA | 1.0 | 1.0 | 700 | $2,995 | $4.28 | 5d | 1 | 0.44mi |
| 6050 Roswell Rd Apt 115 Sandy Springs, GA | 2.0 | 2.0 | 1074 | $2,050 | $1.91 | 22d | 1 | 0.45mi |
| 6050 Roswell Rd Atlanta, GA | 1.0–2.0 | 1.0–2.0 | 990 | $1,525 | $1.54 | 1d | 27 | 0.45mi |
| 6558 Roswell Rd Atlanta, GA | 2.0 | 1.0–2.0 | 1297 | $1,705 | $1.31 | 1d | 42 | 0.65mi |
| 6500 Aria Blvd Atlanta, GA | 1.0–2.0 | 1.0–2.0 | 1007 | $2,036 | $2.02 | 1d | 21 | 0.87mi |
| 346 Carpenter Dr Atlanta, GA | 2.0 | 2.0 | 1138 | $1,798 | $1.58 | 5d | 3 | 0.88mi |
| 760 Mount Vernon Hwy NE Atlanta, GA | 1.0–2.0 | 1.0–2.0 | 626 | $1,289 | $2.06 | 1d | 21 | 0.91mi |
| 613 Granville Ct Atlanta, GA | 2.0 | 2.0 | 1032 | $1,900 | $1.84 | 24d | 1 | 0.94mi |
| 524 Granville Ct Atlanta, GA | 1.0 | 1.0 | 711 | $1,395 | $1.96 | 5d | 1 | 0.94mi |
| 612 Granville Ct Atlanta, GA | 2.0 | 2.0 | 1032 | $1,750 | $1.70 | 4d | 1 | 0.94mi |
| 640 Granville Ct Atlanta, GA | 2.0 | 2.0 | 1032 | $1,875 | $1.82 | 24d | 1 | 0.94mi |
| 310 Granville Ct Unit 310 Atlanta, GA | 2.0 | 2.0 | 1032 | $1,800 | $1.74 | 5d | 1 | 0.94mi |
| 210 Granville Ct Atlanta, GA | 1.0 | 1.0 | 629 | $1,375 | $2.19 | 43d | 1 | 0.97mi |
| 901 Abernathy Rd NE Unit 1 Atlanta, GA | 2.0 | 2.0 | 1002 | $2,100 | $2.10 | 2d | 1 | 1.03mi |
| Goldrush Cir NE Sandy Springs, GA | 1.0 | 1.0 | 600 | $1,400 | $2.33 | 43d | 1 | 1.03mi |
| 6851 Roswell Rd Atlanta, GA | 1.0–3.0 | 1.0–2.0 | 1364 | $1,500 | $1.10 | 43d | 5 | 1.11mi |
| 6851 Roswell Rd Atlanta, GA | 2.0–3.0 | 2.0 | 1364 | $1,715 | $1.26 | 5d | 4 | 1.11mi |
| 5675 Roswell Rd Atlanta, GA | 1.0 | 1.0 | 1065 | $1,441 | $1.35 | 43d | 1 | 1.15mi |
| 799 Hammond Dr #105 Atlanta, GA | 1.0 | 1.0 | 733 | $1,600 | $2.18 | 43d | 1 | 1.16mi |
| 799 Hammond Dr #306 Atlanta, GA | 1.0 | 1.0 | 585 | $1,400 | $2.39 | 17d | 1 | 1.16mi |
| 795 Hammond Dr Unit 1500 Atlanta, GA | 2.0 | 1.0 | 1000 | $2,000 | $2.00 | 43d | 1 | 1.16mi |
| 795 Hammond Dr #505 Atlanta, GA | 1.0 | 1.5 | 703 | $1,300 | $1.85 | 24d | 1 | 1.17mi |
| 795 Hammond Dr #1111 Atlanta, GA | 1.0 | 1.0 | 541 | $1,300 | $2.40 | 24d | 1 | 1.17mi |
| — Atlanta, GA | 1.0 | 1.0 | 750 | $1,200 | $1.60 | 43d | 1 | 1.17mi |
| 6900 Roswell Rd Atlanta, GA | 2.0–3.0 | 2.0–2.5 | 1237 | $1,899 | $1.54 | 2d | 2 | 1.20mi |
| 6940 Roswell Rd Atlanta, GA | 2.0 | 1.5 | 1000 | $1,848 | $1.85 | 43d | 2 | 1.24mi |
| 6940 Roswell Rd Unit 8F Atlanta, GA | 2.0 | 1.5 | 1000 | $1,850 | $1.85 | 24d | 1 | 1.24mi |
| 5555 Roswell Rd NE Unit 13 Atlanta, GA | 1.0 | 1.0 | 1000 | $1,351 | $1.35 | 5d | 1 | 1.26mi |
| 6925 Roswell Rd Atlanta, GA | 1.0–3.0 | 1.0–2.0 | 1155 | $1,345 | $1.16 | 1d | 23 | 1.32mi |
HOA detail condo
- Monthly dues
- $121 · $1,452/yr
- Likely covers
- trashpoolsecurity
- Assessments
- None detected in remarks — confirm with the listing agent.
Listing history 9 events
-
2026-06-18days on market $139,000 Active 14 DOM
-
2026-06-17pricedays on market $139,000 Active 13 DOM
-
2026-06-16days on market $150,000 Active 12 DOM
-
2026-06-15days on market $150,000 Active 11 DOM
-
2026-06-13days on market $150,000 Active 9 DOM
-
2026-06-09days on market $150,000 Active 5 DOM
-
2026-06-08days on market $150,000 Active 4 DOM
-
2026-06-07remarks 699-char remark
-
2026-06-07$150,000 Active 3 DOM
ⓘ Source: listings_history table (triggers on properties + properties_extension) + one-shot
backfill from property_details.listing_events for pre-trigger history.
Tax reassessment forecast GA · Resets to sale price
- Current annual tax
- $1,834 · $153/mo
- Projected year-2 tax
- $1,834 · $153/mo
- Expected delta
- $0/yr ($0/mo · 0.0%)
ⓘ Screening estimate from a state-policy table — verify with the county assessor before closing.
Climate risk First Street
- Flood 1/10 Low FEMA zone X (unshaded) · 0% chance over 30 yrs
- Wildfire 1/10 Low
- Heat 5/10 Major 7 d/yr ≥103°F today · 17 d/yr by 30 yrs out
- Wind 4/10 Moderate 20% chance of damaging wind over 30 yrs
- Air quality 5/10 Major 6 unhealthy d/yr today · 8 by 30 yrs out
Nearby sold comps map
Loading sold comps map…
Walkable amenities ~0.75 mi
Loading nearby amenities…
Taxation est. · year 1
- Rental income
- $22,093
- − Mortgage interest
- −$7,786
- − Property taxes
- −$1,834
- − Insurance
- −$695
- − Repairs & maintenance
- −$1,767
- − Management
- −$1,767
- − HOA
- −$1,452
- − Depreciation
- −$4,044
- Taxable income
- $2,747
- Est. tax owed @ 24.0%
- −$659
- After-tax cash flow
- $4,066/yr
For passive investors: Depreciation is non-cash, so a rental often shows a tax loss while cash-flowing — sheltering income. Rental losses are passive: they offset passive income freely, and up to $25,000/yr can offset ordinary (W-2) income if you actively participate and your MAGI is under $100k (phasing out to $0 by $150k); unused losses carry forward. On sale, claimed depreciation is recaptured at up to 25%, and gains may owe capital-gains tax (a 1031 exchange can defer both). Figures are a year-1 estimate at your 24.0% rate — not tax advice; consult a CPA.
Schools (NCES district)
- District
- Fulton County
- NCES district ID
- 1302280
- Math proficiency
- 49% ▼ -2.00%
- Reading proficiency
- 53% ▬ 0.00%
- Median HH income
- $68,035
- Composite
- 45.33/100
- National rank
- #2640
- State rank
- #12 of 174 in GA
Livability — Sandy Springs
- Score
- 73/100
- State rank
- #45
- US rank
- #5106
Category grades
Schools grade is shown separately in the Schools card above.
Census & demographics
- Census place
- Sandy Springs, GA
- County
- Fulton County · 1,094,430 people
- City population
- 108,027
- Metro
- Atlanta-Sandy Springs-Alpharetta, GA
- Population (ZIP)
- 39,508
- Household income
- $112,111
- Rent vs Own
- Severe rent burden
- 1884.0
Population outlook (Fulton County) Hauer SSP2
- Today (2025)
- 1,203,707 people
- By 2030
- 1,299,706 · +8.0%
- By 2040
- 1,488,256 · +23.6%
- By 2050
- 1,664,580 · +38.3%
- By 2075
- 2,036,072 · +69.2%
- By 2100
- 2,222,402 · +84.6%
Race, ethnicity, and origin ACS 2023
- Neighborhood character
- Diverse neighborhood (Simpson 0.61)
- Race & ethnicity
- White 59% Black 18% Asian 12% Two or more races 8% Hispanic / Latino 7%
- Hispanic origin (detail)
- Mexican 2%
- Common ancestry
- Romanian 3% Italian 3% Slovak 3%
- Foreign-born
- 17% · Canada, China, South Korea
- Languages at home
- 81% English-only · Other Indo-European 5% Spanish 4% Other Asian/Pacific 4%
Political lean MEDSL · Fulton
- 2024 margin
- Solid D (+44.9) · D 71.9% · R 27.0% · Other 1.1%
- 2008→2024 swing
- +9.8pp toward D · 2008: 35.0pp · 2024: 44.9pp
- All cycles
- 2024: D+44.9 2020: D+46.4 2016: D+42.1 2012: D+29.6 2008: D+35.0
Not yet ingested
- Civics
- —
Market trends
- HPI YoY
- ▼ -361.92%
- Current HPI
- 238.4936
- Rent YoY
- ▼ -0.24%
- Metro
- Atlanta-Sandy Springs-Alpharetta, GA
- State GDP YoY
- ▲ 2.66%
- F500 in state
- 28
Industry mix (Fortune 500 HQ in GA)
| Industry | F500 HQs | Revenue |
|---|---|---|
| Paper / Packaging | 2 | $29B |
|
||
| Retail | 1 | $160B |
|
||
| Transportation / Logistics | 1 | $91B |
|
||
| Airlines | 1 | $62B |
|
||
| Consumer Goods | 1 | $47B |
|
||
| Utilities | 1 | $25B |
|
||
Price history
+158.6% since first listed5 events — show timeline
- 2026-06-04 Listed $150,000 FMLS
- 2026-06-04 Listed $150,000 GAMLS
- 2019-08-01 Sold (Public Records) $140,000 Public Records
- 2012-12-18 Sold (Public Records) $50,000 Public Records
- 1998-03-12 Sold (Public Records) $58,000 Public Records
Property tax history
+27.0%/yrLatest (2025): $1,834 · +1.5% YoY. Source: county tax records.
Cash-flow waterfall
monthlySold comps — $/sqft
last 12 mo · ≤1 miLoading sold comps…