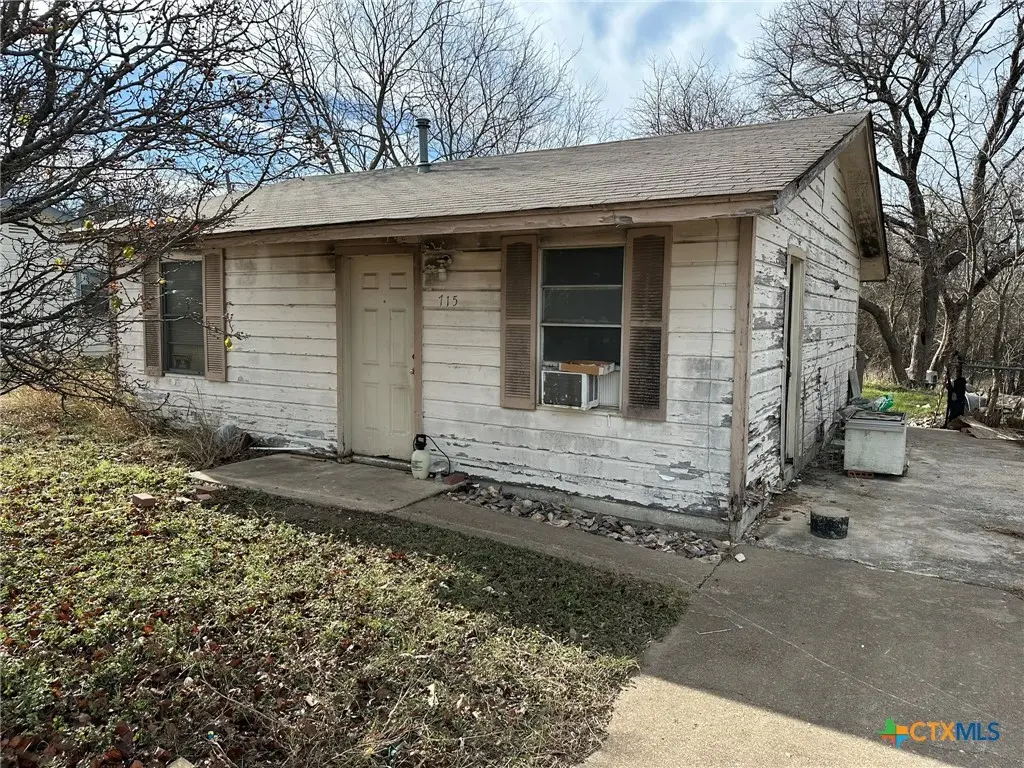
715 W Avenue B · Copperas Cove, TX
Flood risk 1/10 · Minimal
- FEMA flood zone
- X (unshaded)
- Chance of flooding over 30 yrs
- 0.0%
- Est. flood insurance / yr
- $507 – $1,088
Fire risk 5/10 · Moderate
- Est. fire insurance / yr
- $1,222 – $2,270
Heat risk 7/10 · Major
- Hot days now (above 106°F)
- 7 days/yr
- Hot days in 30 yrs
- 23 days/yr
Wind risk 6/10 · Moderate
- Chance of severe wind over 30 yrs
- 55.0%
Air-quality risk 1/10 · Minimal
- Unhealthy air days now
- 0 days/yr
- Unhealthy air days in 30 yrs
- 0 days/yr
Risk factors via First Street. Map © Google.
Why this score? — see what drove the B+ grade
The composite is a weighted blend of 9 inputs, each scored 0–100. Each bar is that input's sub-score; the figure is the points it added to the 100-point composite (weight × sub-score).
- Cash flow +30.0/30.0
- ARV discount +15.0/15.0
- DSCR +10.0/10.0
- 1% rule +9.9/10.0
- Schools +3.6/10.0
- Livability +3.2/5.0
- Condition / age +2.5/5.0
- Rent growth +2.4/5.0
- Appreciation +0.0/10.0
$54,900
🖨 Deal sheet 📄 Offer letter ✓ Due diligence
Listing remarks MLS
sold as-is no repairs will be done CASH ONLY, buyer pays if they want a survey
Key facts
- 6,011 sq ft lot
- Built 1963
- Listed 156 days
Neighborhood map
What this means for you Summary
Snapshot
- This is a 2-bed/1.0-bath single-family listed at $55k.
Deal economics
- At list price, monthly cash flow is $240 ($3k/yr) — positive.
- The deal already cash-flows at list — no discount required.
- Meets the 1% rule at list price ($817 rent vs $55k).
- Recommended offer: $48k (12.0% below list) — sets the bar for market timing.
- Cap rate 11.5% vs local median 3.4% in Copperas Cove — top-decile yield for the area; either an underpriced asset or a hidden risk that comps aren't pricing in. Stress-test before assuming the spread holds.
Location & tenants
- Location reads 65/100 on livability (#706 in TX) — a middle-class / working-renter tenant base. Strengths: cost of living A+, housing A+; Watch: schools C-, employment D+, amenities F.
- Copperas Cove ISD (suburban): math 41% / reading 42% proficiency, ranked #340 of 826 in TX (top 41%) — families likely to look elsewhere, expect single-tenant / working-renter base with shorter leases.
- Market conditions: Rents soft (-0.2%/yr); 605 active listings in the ZIP; 40 comparable units currently listed for rent nearby; rentals lingering (median 44d on market — plan ~5-8 weeks vacancy on turnover, expect pricing pressure); 58% of comp listings sitting > 30 days — soft ceiling on asking rent; 386 units permitted in Coryell County in 2024 (0 in 5+ unit buildings).
- This rent is only 14% of the median local income ($72k/yr) — well below the 30% rent-burden line; pricing power to push rent on renewal without tenant pushback.
Forward outlook
- Local home prices are declining (-3.0%/yr); year-one equity from $380 of loan paydown is wiped out by about $2k of value loss. Plan a longer hold.
- At projected returns (-3.0% appreciation + 0.0% rent growth), your $15k cash investment doubles in ~9 years — after that, you're playing with house money.
Negotiation context
- It's been on market 156 days — a 12% lower offer ($48k) is reasonable based on typical stale-listing flexibility.
- 4 sale attempts since 23y ago with the ask held roughly flat each time — persistent listings suggest the price (not the market) is what's stuck; bring a comps-based counter.
Risks & watch-outs
- Climate carrying-cost: major wind risk, 55% chance of damaging wind over 30y; moderate wildfire risk; extreme-heat days projected 7→23/yr by 2055 (HVAC capex compounding) — expect insurance premiums to compound above CPI over the hold.
Questions for the listing agent
- It's been on market 156 days. Have you received any prior offers? Is the seller open to a 12% concession, seller financing, or rate buy-down credit?
- Built in 1963 — when were the roof, HVAC, electrical panel, plumbing, and water heater last replaced?
- Why hasn't it sold? Are there any deal-killer items the seller is aware of (foundation, flood, title, zoning, code violations)?
- Is there a deadline driving the sale (1031 exchange, divorce, estate, relocation)? That informs how much negotiation room exists.
- What's the average days-on-market for RENTAL listings here right now (not sales)? A rising rental-DOM trend means longer vacancies and softer asking-rent achievability than the comps imply.
- What's the recent tenant-quality profile in this submarket — average credit score on applications, eviction rate, late-payment / NSF rate, and stable-employment percentage? A property-management company in the area should have these aggregated.
- How much new for-sale + rental construction is in the pipeline within 1–3 miles? Heavy new supply typically softens prices + rents 12–24 months out; constrained supply supports both.
Investment metrics
- 1% rule
- 1.49% ✓
- Cap rate
- 11.55%
- Cash-on-cash
- 18.76%
- DSCR
- 1.83
- GRM
- 5.6
CMA / ARV
- ARV (median comp)
- $88,668
- List price
- $54,900
- Delta
- -38.08%
- Verdict
- UNDERPRICED
- Comps
- 6 within 1.0 mi
Show comp detail 1 sale within ~0.75 mi
| Address | Dist | Beds/Ba | Sqft | Sold | Price | $/sf | Match |
|---|---|---|---|---|---|---|---|
| 502 W Avenue A | 0.30mi | 2/1.0 | 560 (-10%) | 3mo | $90,000 | $161 | 66 |
Match score weights: distance 35% · size 25% · config 20% · recency 20%. Top-matched comps best support the ARV.
Projected returns pro-forma
-3.0% appreciation · 0.0% rent growth · sell at horizon
- IRR
- 7.0%
- Equity multiple
- 1.26×
- Total profit
- $4,045
- Equity at exit
- $8,186
- IRR
- 13.4%
- Equity multiple
- 1.92×
- Total profit
- $14,091
- Equity at exit
- $4,747
Cash invested: $15,372 (down + closing). Projections, not guarantees.
Landlord ↔ Tenant lean methodology
- Overall (STATE)
- 87 Strongly Landlord-Friendly
- State Texas
- 87 Strongly Landlord-Friendly · R+5
- County
- — inherits STATE
- City
- — inherits STATE
ZIP-level market 76522
- Home prices YoY
- -22.4%
- Rents YoY
- -0.2%
- Active inventory
- 605
- Price-to-rent
- 5.6×
Monthly cashflow live
- Estimated rent
- $817 high interval (Pro) →
- Mortgage (P&I)
- −$288
- Tax from tax record
- −$95 /mo · $1,135/yr
- Insurance
- −$23
- HOA
- −$0
- Vacancy / Maint / Mgmt
- −$172
- Net cashflow
- $240
Break-even live
UW: 25.0% down · 7.5% · 30yr · 1.5% tax · 5.0% vac · 8.0% maint · 8.0% mgmt
Financing live
Cash to close
- Down payment
- $13,725
- Closing costs
- $1,647
- Reserves months
- —
- Total cash needed
- —
Loan-product check · same deal, 3 products live
Conventional
25% down · 7.5% · 30yr
- Down + closing
- —
- Monthly P&I
- —
- Monthly cashflow
- —
- DSCR
- —
- Eligible?
- —
Personal DTI + credit; lowest rate.
DSCR
20% down · 8.5% · 30yr
- Down + closing
- —
- Monthly P&I
- —
- Monthly cashflow
- —
- DSCR
- —
- Eligible?
- —
No personal income docs; deal must DSCR.
Hard money
10% down · 12.0% · 12mo
- Down + closing
- —
- Monthly P&I
- —
- Monthly cashflow
- —
- DSCR
- —
- Eligible?
- —
Short-term bridge; refi at stabilization.
Rent comps 40 comps
| Address | Beds | Baths | Sqft | Rent | $/sqft | DOM | Units | Dist |
|---|---|---|---|---|---|---|---|---|
| 722 West Avenue B Unit B Copperas Cove, TX | 2.0 | 1.0 | 620 | $1,000 | $1.61 | 44d | 1 | 0.06mi |
| 310 W Washington Ave Unit A Copperas Cove, TX | 2.0 | 1.0 | 661 | $700 | $1.06 | 44d | 1 | 0.39mi |
| 401 W Lincoln Ave Unit 2 Copperas Cove, TX | 2.0 | 1.0 | 740 | $850 | $1.15 | 23d | 1 | 0.41mi |
| 101 N 3rd St Apt 11 Copperas Cove, TX | 1.0 | 1.0 | 535 | $575 | $1.07 | 23d | 1 | 0.44mi |
| 502 Mary St Unit 201 Copperas Cove, TX | 1.0 | 1.0 | 600 | $650 | $1.08 | 44d | 1 | 0.49mi |
| 502 Mary St Unit 204 Copperas Cove, TX | 1.0 | 1.0 | 600 | $599 | $1.00 | 44d | 1 | 0.49mi |
| 402 Mary St Unit 210 Copperas Cove, TX | 1.0 | 1.0 | 600 | $650 | $1.08 | 44d | 1 | 0.53mi |
| 907 N 7th St Apt B Copperas Cove, TX | 2.0 | 1.0 | 735 | $650 | $0.88 | 23d | 1 | 0.56mi |
| 506 N 1st St Copperas Cove, TX | 1.0 | 1.0 | 600 | $650 | $1.08 | 14d | 3 | 0.58mi |
| 505 Hackberry St Unit 18 Copperas Cove, TX | 2.0 | 1.0 | 750 | $675 | $0.90 | 14d | 1 | 0.59mi |
| 301 Bonnie Ln Copperas Cove, TX | 2.0 | 1.0 | 596 | $777 | $1.30 | 44d | 1 | 0.60mi |
| 301 Bonnie Ln Unit A Copperas Cove, TX | 2.0 | 1.0 | 652 | $777 | $1.19 | 23d | 1 | 0.60mi |
| 507 Hackberry St Unit 32 Copperas Cove, TX | 2.0 | 1.0 | 570 | $650 | $1.14 | 23d | 1 | 0.61mi |
| 102 East Ave E Unit 9 Copperas Cove, TX | 1.0 | 1.0 | 560 | $545 | $0.97 | 14d | 1 | 0.62mi |
| 917 N 7th St Apt C Copperas Cove, TX | 2.0 | 1.0 | 692 | $625 | $0.90 | 44d | 1 | 0.62mi |
| 102 East Avenue A Apt 7 Copperas Cove, TX | 2.0 | 1.0 | 560 | $585 | $1.04 | 14d | 1 | 0.62mi |
| 102 East Avenue A Apt 7 Copperas Cove, TX | 2.0 | 1.0 | 560 | $585 | $1.04 | 23d | 1 | 0.62mi |
| 902 J R Ct Unit 902 Copperas Cove, TX | 1.0 | 1.0 | 520 | $675 | $1.30 | 44d | 1 | 0.66mi |
| 101 Meggs St Unit F Copperas Cove, TX | 2.0 | 1.0 | 725 | $695 | $0.96 | 44d | 1 | 0.68mi |
| 907-909 J R Ct Unit 909 Copperas Cove, TX | 1.0 | 1.0 | 528 | $675 | $1.28 | 44d | 1 | 0.68mi |
| 903 S 19th St Unit F Copperas Cove, TX | 1.0 | 1.0 | 539 | $650 | $1.21 | 23d | 1 | 0.68mi |
| 909 S 17th St Unit 907 Copperas Cove, TX | 2.0 | 1.0 | 600 | $875 | $1.46 | 44d | 1 | 0.70mi |
| 918-920 J R Ct Unit 920 Copperas Cove, TX | 1.0 | 1.0 | 520 | $675 | $1.30 | 44d | 1 | 0.70mi |
| 922-932 J R Ct Unit 930 Copperas Cove, TX | 1.0 | 1.0 | 504 | $595 | $1.18 | 23d | 1 | 0.72mi |
| 930 J R Ct Copperas Cove, TX | 1.0 | 1.0 | 504 | $595 | $1.18 | 23d | 1 | 0.72mi |
| 401 N 4th St Apt E Copperas Cove, TX | 2.0 | 1.0 | 750 | $700 | $0.93 | 23d | 1 | 0.74mi |
| 804 Hackberry St Copperas Cove, TX | 1.0 | 1.0 | 643 | $600 | $0.93 | 44d | 1 | 0.75mi |
| 905 N Main St Apt 6 Copperas Cove, TX | 2.0 | 1.0 | 672 | $695 | $1.03 | 44d | 1 | 0.87mi |
| 1012 Georgetown Rd Copperas Cove, TX | 2.0 | 1.0 | 690 | $800 | $1.16 | 44d | 1 | 0.89mi |
| 107 Jason Dr Unit A Copperas Cove, TX | 2.0 | 1.0 | 734 | $925 | $1.26 | 44d | 1 | 0.91mi |
| 1208 Georgetown Rd Unit 1206 Copperas Cove, TX | 1.0 | 1.0 | 600 | $625 | $1.04 | 44d | 1 | 1.00mi |
| 1218 Georgetown Rd Unit 1220 Copperas Cove, TX | 1.0 | 1.0 | 700 | $625 | $0.89 | 44d | 1 | 1.02mi |
| 606 Westview Cir Unit B Copperas Cove, TX | 2.0 | 1.0 | 715 | $700 | $0.98 | 21d | 1 | 1.03mi |
| 606 Westview Cir Unit B Copperas Cove, TX | 2.0 | 1.0 | 715 | $700 | $0.98 | 44d | 1 | 1.03mi |
| 1222 Georgetown Rd Unit 1222 Copperas Cove, TX | 1.0 | 1.0 | 700 | $675 | $0.96 | 23d | 1 | 1.03mi |
| 410 Sunset Ln Unit B Copperas Cove, TX | 1.0 | 1.0 | 530 | $650 | $1.23 | 44d | 1 | 1.08mi |
| 503 Sunset Ln Apt 2 Copperas Cove, TX | 1.0 | 1.0 | 445 | $520 | $1.17 | 44d | 1 | 1.10mi |
| 401 Sunset Ln Unit A Copperas Cove, TX | 2.0 | 1.0 | 690 | $795 | $1.15 | 44d | 1 | 1.10mi |
| 505 Sunset Ln Apt D Copperas Cove, TX | 1.0 | 1.0 | 523 | $525 | $1.00 | 44d | 1 | 1.11mi |
| 505 Sunset Ln Apt E Copperas Cove, TX | 1.0 | 1.0 | 523 | $525 | $1.00 | 14d | 1 | 1.11mi |
Listing history 24 events
-
2026-06-18days on market $54,900 Active 156 DOM
-
2026-06-17days on market $54,900 Active 155 DOM
-
2026-06-16days on market $54,900 Active 154 DOM
-
2026-06-15days on market $54,900 Active 153 DOM
-
2026-06-14days on market $54,900 Active 151 DOM
-
2026-06-13days on market $54,900 Active 150 DOM
-
2026-06-10days on market $54,900 Active 148 DOM
-
2026-06-09days on market $54,900 Active 147 DOM
-
2026-06-08days on market $54,900 Active 146 DOM
-
2026-06-07days on market $54,900 Active 145 DOM
-
2026-06-05days on market $54,900 Active 142 DOM
-
2026-06-03days on market $54,900 Active 141 DOM
-
2026-06-02days on market $54,900 Active 140 DOM
-
2026-06-01days on market $54,900 Active 139 DOM
-
2026-05-31days on market $54,900 Active 138 DOM
-
2026-05-30days on market $54,900 Active 137 DOM
-
2026-01-13$54,900 Active 79-char remark
Show marketing remark (79 chars)
sold as-is no repairs will be done CASH ONLY, buyer pays if they want a survey
-
2018-01-29historical
-
2017-10-23$5,000
-
2005-12-02historical
-
2004-12-02$29,000
-
2003-11-12soldstatus
-
2003-08-01historical
-
2003-07-10$20,000
ⓘ Source: listings_history table (triggers on properties + properties_extension) + one-shot
backfill from property_details.listing_events for pre-trigger history.
Tax reassessment forecast TX · Resets to sale price
- Current annual tax
- $1,135 · $95/mo
- Projected year-2 tax
- $1,135 · $95/mo
- Expected delta
- $0/yr ($0/mo · 0.0%)
ⓘ Screening estimate from a state-policy table — verify with the county assessor before closing.
Climate risk First Street
- Flood 1/10 Low FEMA zone X (unshaded) · 0% chance over 30 yrs
- Wildfire 5/10 Major
- Heat 7/10 Severe 7 d/yr ≥106°F today · 23 d/yr by 30 yrs out
- Wind 6/10 Major 55% chance of damaging wind over 30 yrs
- Air quality 1/10 Low 0 unhealthy d/yr today · 0 by 30 yrs out
Nearby sold comps map
Loading sold comps map…
Walkable amenities ~0.75 mi
Loading nearby amenities…
Taxation est. · year 1
- Rental income
- $9,809
- − Mortgage interest
- −$3,075
- − Property taxes
- −$1,135
- − Insurance
- −$274
- − Repairs & maintenance
- −$785
- − Management
- −$785
- − Depreciation
- −$1,597
- Taxable income
- $2,157
- Est. tax owed @ 24.0%
- −$518
- After-tax cash flow
- $2,367/yr
For passive investors: Depreciation is non-cash, so a rental often shows a tax loss while cash-flowing — sheltering income. Rental losses are passive: they offset passive income freely, and up to $25,000/yr can offset ordinary (W-2) income if you actively participate and your MAGI is under $100k (phasing out to $0 by $150k); unused losses carry forward. On sale, claimed depreciation is recaptured at up to 25%, and gains may owe capital-gains tax (a 1031 exchange can defer both). Figures are a year-1 estimate at your 24.0% rate — not tax advice; consult a CPA.
Schools (NCES district)
- District
- Copperas Cove ISD
- NCES district ID
- 4815240
- Math proficiency
- 41% ▼ -6.00%
- Reading proficiency
- 42% ▼ -2.00%
- Median HH income
- $51,072
- Composite
- 35.85/100
- National rank
- #4822
- State rank
- #340 of 826 in TX
Livability — Copperas Cove
- Score
- 65/100
- State rank
- #706
- US rank
- #13158
Category grades
Schools grade is shown separately in the Schools card above.
Census & demographics
- Census place
- Copperas Cove, TX
- County
- Coryell County · 61,053 people
- City population
- 42,118
- Metro
- Killeen-Temple, TX
- Population (ZIP)
- 42,118
- Household income
- $72,206
- Rent vs Own
- Severe rent burden
- 1019.0
Population outlook (Coryell County) Hauer SSP2
- Today (2025)
- 75,485 people
- By 2030
- 75,627 · +0.2%
- By 2040
- 74,898 · -0.8%
- By 2050
- 74,221 · -1.7%
- By 2075
- 72,688 · -3.7%
- By 2100
- 66,862 · -11.4%
Race, ethnicity, and origin ACS 2023
- Neighborhood character
- Diverse neighborhood (Simpson 0.66)
- Race & ethnicity
- White 53% Hispanic / Latino 21% Two or more races 20% Black 14% Asian 2%
- Hispanic origin (detail)
- Mexican 11% Puerto Rican 6%
- Common ancestry
- Romanian 2% Italian 2% Lithuanian 2%
- Foreign-born
- 7% · Canada, South Korea
- Languages at home
- 85% English-only · Spanish 10% German/W. Germanic 2% Other Asian/Pacific 1%
Political lean MEDSL · Coryell
- 2024 margin
- Solid R (+40.7) · D 29.1% · R 69.8% · Other 1.1%
- 2008→2024 swing
- -13.8pp toward R · 2008: -26.9pp · 2024: -40.7pp
- All cycles
- 2024: R+40.7 2020: R+33.5 2016: R+39.5 2012: R+36.6 2008: R+26.9
Not yet ingested
- Civics
- —
Market trends
- HPI YoY
- ▼ -53.11%
- Current HPI
- 183.9452
- Rent YoY
- ▼ -0.25%
- Metro
- Killeen-Temple, TX
- State GDP YoY
- ▲ 3.95%
- F500 in state
- 110
Industry mix (Fortune 500 HQ in TX)
| Industry | F500 HQs | Revenue |
|---|---|---|
| Energy | 16 | $1,198B |
|
||
| Technology | 5 | $198B |
|
||
| Engineering / Construction | 4 | $72B |
|
||
| Energy Services | 3 | $60B |
|
||
| Utilities | 3 | $41B |
|
||
| Healthcare | 2 | $330B |
|
||
Price history
+174.5% since first listed8 events — show timeline
- 2026-01-13 Listed $54,900 CTXMLS
- 2018-01-29 Listing Removed — CTXMLS
- 2017-10-23 Listed $5,000 CTXMLS
- 2005-12-02 Listing Removed — CTXMLS
- 2004-12-02 Listed $29,000 CTXMLS
- 2003-11-12 Sold (Public Records) — Public Records
- 2003-08-01 Listing Removed — CTXMLS
- 2003-07-10 Listed $20,000 CTXMLS
Property tax history
+5.0%/yrLatest (2025): $1,135 · +2.9% YoY. Source: county tax records.
Cash-flow waterfall
monthlySold comps — $/sqft
last 12 mo · ≤1 miLoading sold comps…