 Multi-family
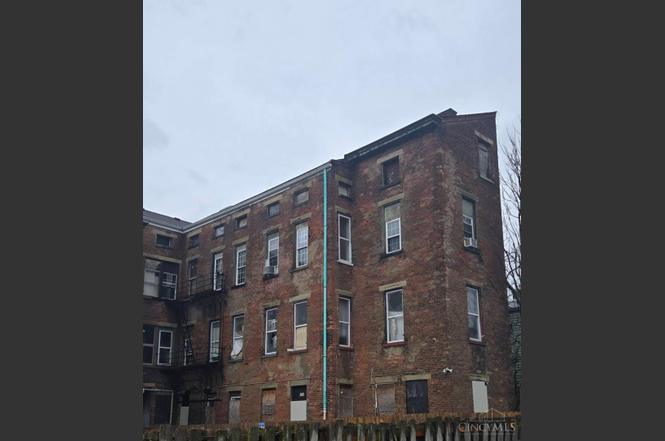
2904 S Colerain Ave · Cincinnati, OH
Flood risk No data
- FEMA flood zone
- —
- Chance of flooding over 30 yrs
- —
- Est. flood insurance / yr
- —
Fire risk No data
- Est. fire insurance / yr
- —
Heat risk No data
- Hot days now (above threshold)
- —
- Hot days in 30 yrs
- —
Wind risk No data
- Chance of severe wind over 30 yrs
- —
Air-quality risk No data
- Unhealthy air days now
- —
- Unhealthy air days in 30 yrs
- —
Risk factors via First Street. Map © Google.
Why this score? — see what drove the A grade
The composite is a weighted blend of 9 inputs, each scored 0–100. Each bar is that input's sub-score; the figure is the points it added to the 100-point composite (weight × sub-score).
- Cash flow +30.0/30.0
- ARV discount +15.0/15.0
- 1% rule +10.0/10.0
- DSCR +10.0/10.0
- Appreciation +10.0/10.0
- Livability +4.0/5.0
- Rent growth +2.5/5.0
- Schools +2.5/10.0
- Condition / age +2.5/5.0
$160,000
🖨 Deal sheet 📄 Offer letter ✓ Due diligence
Multi-family units
County records classify this as Multi-Family (5+ Unit). Listing-text estimate: 1 unit. estimate disagrees with records
5+ unit building — per-unit beds/baths from public records are typically unavailable; the breakdown below (if shown) is an estimate from the listing text.
Listing remarks
Rare Opportunity in heart of Camp Washington. Mixed use property street level commercial space- store front and 4 residential units upstairs. The attic could be turned into an apartment as well. Building requires substantial exterior improvements and full mechanical reno making it ideal for a value add repositioning project. This space is sold as is - buyer to verify all information , zoning, room counts, configurations and development potential.
Key facts
- 2,614 sq ft lot
- Built 1900
- Listed 8 days
Property features AI
Finance
- Other: Lot roughly 0.06 acres (about 2,600 sq ft)
- Financial info: One building containing 4 units
- HOA & community: HOA details not specified
Exterior
- Parking: Public parking
- Security: Security details not specified
- Utilities: Public water; Public sewer; Gas available at street; Gas heating (listed under utilities)
- Home design: Quadruplex (multi-family); Three or more levels; Zoned for multi-family
- Construction: Membrane roof; Stone foundation
- Exterior features: Casement windows; Brick exterior
Interior
- Kitchen: Kitchens in each unit (details not specified)
- Bedrooms: Four 1-bedroom units
- Flooring: Flooring details not specified
- Bathrooms: Each unit has one full bathroom (4 total)
- Heating & cooling: Gas heating
- Interior features: Full basement; No fireplace
- Laundry & utility: Utility details not specified
Neighborhood map
What this means for you Summary
Snapshot
- This is a 4-bed/4.0-bath multifamily listed at $160k.
Deal economics
- At list price, monthly cash flow is $3k ($39k/yr) — positive.
- The deal already cash-flows at list — no discount required.
- Meets the 1% rule at list price ($6k rent vs $160k).
- Cap rate 30.9% vs local median 3.9% in Cincinnati — top-decile yield for the area; either an underpriced asset or a hidden risk that comps aren't pricing in. Stress-test before assuming the spread holds.
Location & tenants
- Location reads 80/100 on livability (#130 in OH, #1,856 nationally) — a professional / high-income tenant draw. Strengths: amenities A+, commute A+, cost of living A+; Watch: employment D, crime F.
- Cincinnati Public Schools (urban): math 25% / reading 36% proficiency, ranked #581 of 656 in OH (top 89%) — families likely to look elsewhere, expect single-tenant / working-renter base with shorter leases; 70% free/reduced lunch — lower-income household profile, screen leases tightly.
- Market conditions: 32 active listings in the ZIP; 25 comparable units currently listed for rent nearby; rentals at typical pace (median 24d on market — plan ~3-4 weeks tenant-placement turnaround); lower-income renter base — watch delinquency; 801 units permitted in Hamilton County in 2024 (190 in 5+ unit buildings).
- At $5,549/mo this rent would consume 327% of the median local household income ($20k/yr) (locally 1466% of renters already pay >50% of income on rent) — very limited rent-growth headroom before tenants either downsize or default.
Forward outlook
- In year one you build about $17k of equity ($1k loan paydown + $16k appreciation (10.0% local appreciation)).
- At projected returns (10.0% appreciation + 3.0% rent growth), your $45k cash investment doubles in ~1 year — after that, you're playing with house money.
- By year 3, paydown + projected appreciation supports a ~$43k cash-out refi (75% LTV) — recoverable capital for the next deal without selling this one.
Negotiation context
- Only 8 days on market — expect competitive offers; lowballing is unlikely to land.
- 2 sale attempts since 24y ago with the ask held roughly flat each time — persistent listings suggest the price (not the market) is what's stuck; bring a comps-based counter.
Risks & watch-outs
- Watch-outs: built in 1900 — expect roof / HVAC / electrical / plumbing capex.
Questions for the listing agent
- Built in 1900 — when were the roof, HVAC, electrical panel, plumbing, and water heater last replaced?
- Is there a deadline driving the sale (1031 exchange, divorce, estate, relocation)? That informs how much negotiation room exists.
- Schools are B-rated — typically a magnet for longer-tenancy family renters. What's the average tenant stay here, and is there a school-zone premium baked into asking?
- Crime grade is F in this area — have there been break-ins, vandalism, or insurance claims at this property in the last 3 years? What carrier currently insures it and at what premium?
- What's the average days-on-market for RENTAL listings here right now (not sales)? A rising rental-DOM trend means longer vacancies and softer asking-rent achievability than the comps imply.
- What's the recent tenant-quality profile in this submarket — average credit score on applications, eviction rate, late-payment / NSF rate, and stable-employment percentage? A property-management company in the area should have these aggregated.
- How much new apartment / multifamily construction is in the pipeline within 1–3 miles? Heavy new supply (>2% of stock underway) typically softens rents 12–24 months out; light construction supports rent growth.
Investment metrics
- 1% rule
- 3.47% ✓
- Cap rate
- 30.88%
- Cash-on-cash
- 87.80%
- DSCR
- 4.91
- GRM
- 2.4
CMA / ARV
- ARV (on-the-fly)
- $250,042
- Comps found
- 2
Show comp detail 2 sales within ~0.75 mi
| Address | Dist | Beds/Ba | Sqft | Sold | Price | $/sf | Match |
|---|---|---|---|---|---|---|---|
| 600 Riddle Rd | 0.54mi | 4/— | 1,657 (+8%) | 2mo | $270,000 | $163 | 60 |
| 2752 Enslin St | 0.51mi | 3/2.0 (-1) | 1,584 (+3%) | 16mo | $108,000 | $68 | 44 |
Match score weights: distance 35% · size 25% · config 20% · recency 20%. Top-matched comps best support the ARV.
Projected returns pro-forma
10.0% appreciation · 3.0% rent growth · sell at horizon
- IRR
- 97.1%
- Equity multiple
- 7.61×
- Total profit
- $296,001
- Equity at exit
- $144,141
- IRR
- 92.2%
- Equity multiple
- 16.80×
- Total profit
- $707,659
- Equity at exit
- $310,845
Cash invested: $44,800 (down + closing). Projections, not guarantees.
Landlord ↔ Tenant lean methodology
- Overall (STATE)
- 73 Landlord-Friendly
- State Ohio
- 73 Landlord-Friendly · R+6
- County
- — inherits STATE
- City
- — inherits STATE
ZIP-level market 45225
- Home prices YoY
- 4.6%
- Active inventory
- 32
- Price-to-rent
- 12.0×
Monthly cashflow live
- Estimated rent
- $5,549 medium interval (Pro) →
- Mortgage (P&I)
- −$839
- Tax est. 1.5%
- −$200 /mo · $2,400/yr
- Insurance
- −$67
- HOA
- −$0
- Vacancy / Maint / Mgmt
- −$1,165
- Net cashflow
- $3,278
Break-even live
5-unit breakdown (identical units grouped — click to expand)
| Units | Beds | Baths | Est. rent |
|---|---|---|---|
| 5× units | 2 | 1 | $5,550 |
| #1 | 2 | 1 | $1,110 |
| #2 | 2 | 1 | $1,110 |
| #3 | 2 | 1 | $1,110 |
| #4 | 2 | 1 | $1,110 |
| #5 | 2 | 1 | $1,110 |
| Total (5 units) | $5,549 | ||
UW: 25.0% down · 7.5% · 30yr · 1.5% tax · 5.0% vac · 8.0% maint · 8.0% mgmt
Financing live
Cash to close
- Down payment
- $40,000
- Closing costs
- $4,800
- Reserves months
- —
- Total cash needed
- —
Loan-product check · same deal, 3 products live
Conventional
25% down · 7.5% · 30yr
- Down + closing
- —
- Monthly P&I
- —
- Monthly cashflow
- —
- DSCR
- —
- Eligible?
- —
Personal DTI + credit; lowest rate.
DSCR
20% down · 8.5% · 30yr
- Down + closing
- —
- Monthly P&I
- —
- Monthly cashflow
- —
- DSCR
- —
- Eligible?
- —
No personal income docs; deal must DSCR.
Hard money
10% down · 12.0% · 12mo
- Down + closing
- —
- Monthly P&I
- —
- Monthly cashflow
- —
- DSCR
- —
- Eligible?
- —
Short-term bridge; refi at stabilization.
Rent comps 25 comps
| Address | Beds | Baths | Sqft | Rent | $/sqft | DOM | Units | Dist |
|---|---|---|---|---|---|---|---|---|
| 1042 Marshall Ave Apt 3 Cincinnati, OH | 3.0 | 1.0 | 1400 | $1,195 | $0.85 | 23d | 1 | 0.22mi |
| 1241 Bates Ave Cincinnati, OH | 3.0 | 2.5 | 2100 | $1,875 | $0.89 | 23d | 1 | 0.41mi |
| 2704 W McMicken Ave Unit 2 Cincinnati, OH | 3.0 | 1.0 | 1760 | $1,500 | $0.85 | 23d | 1 | 0.43mi |
| 623 Riddle Rd Cincinnati, OH | 3.0 | 2.0 | 2028 | $1,800 | $0.89 | 23d | 1 | 0.46mi |
| 595 Martin Luther King Dr W Cincinnati, OH | 3.0 | 2.0 | 2048 | $1,650 | $0.81 | 10d | 1 | 0.52mi |
| 2521 Ravine St Cincinnati, OH | 3.0 | 3.5 | 1528 | $2,995 | $1.96 | 23d | 1 | 0.68mi |
| 421 Southview Ave Unit 2 Cincinnati, OH | 3.0 | 1.0 | 1350 | $1,800 | $1.33 | 23d | 1 | 0.72mi |
| 348 Volkert Ave Cincinnati, OH | 4.0 | 2.5 | 1400 | $2,800 | $2.00 | 23d | 1 | 0.80mi |
| 2231 Flora St Cincinnati, OH | 4.0 | 2.0 | 1728 | $1,500 | $0.87 | 23d | 1 | 0.96mi |
| 2332 Chickasaw St Unit 1 Cincinnati, OH | 3.0 | 1.0 | 2000 | $1,800 | $0.90 | 23d | 1 | 0.97mi |
| 2235 Victor St Cincinnati, OH | 4.0 | 2.0 | 2043 | $2,250 | $1.10 | 23d | 1 | 0.97mi |
| 2388 Wheeler St Cincinnati, OH | 4.0 | 2.0 | 1740 | $2,700 | $1.55 | 23d | 1 | 1.00mi |
| 2386 Wheeler St Cincinnati, OH | 4.0 | 1.0 | 1740 | $2,700 | $1.55 | 23d | 1 | 1.00mi |
| 358 Shiloh St Cincinnati, OH | 1.0–3.0 | 1.0 | 1400 | $2,100 | $1.50 | 1d | 1 | 1.02mi |
| 445 W McMicken Ave Cincinnati, OH | 3.0 | 1.0 | 1090 | $1,350 | $1.24 | 23d | 1 | 1.04mi |
| 231 Emming St Unit 2 Cincinnati, OH | 3.0 | 1.0 | 1200 | $1,800 | $1.50 | 23d | 1 | 1.15mi |
| 217 Emming St Unit 1 Cincinnati, OH | 4.0 | 2.0 | 1510 | $1,800 | $1.19 | 23d | 1 | 1.17mi |
| 1852 Knox St Cincinnati, OH | 4.0 | 1.5 | 1747 | $1,850 | $1.06 | 23d | 1 | 1.19mi |
| 3141 Bishop St Unit 1 Cincinnati, OH | 3.0 | 1.0 | 1500 | $2,100 | $1.40 | 23d | 1 | 1.20mi |
| 812 Dayton St Unit 1056021P Cincinnati, OH | 3.0 | 1.0 | 1453 | $2,995 | $2.06 | 1d | 1 | 1.23mi |
| 3263 Bishop St Cincinnati, OH | 3.0 | 2.0 | 1465 | $2,395 | $1.63 | 23d | 1 | 1.23mi |
| 414 Dayton St Cincinnati, OH | 3.0 | 2.5 | 1176 | $2,400 | $2.04 | 23d | 1 | 1.30mi |
| 7 W Hollister St Cincinnati, OH | 5.0 | 2.0 | 1585 | $2,750 | $1.74 | 14d | 1 | 1.35mi |
| 107 E Clifton Ave Unit 1234537P Cincinnati, OH | 2.0–3.0 | 1.0–2.0 | 2260 | $6,619 | $2.93 | 14d | 2 | 1.44mi |
| 2504 White St Apt 5 Cincinnati, OH | 3.0 | 2.0 | 1150 | $1,150 | $1.00 | 23d | 1 | 1.46mi |
Listing history 8 events
-
2026-06-18days on market $160,000 Active 8 DOM
-
2026-06-17days on market $160,000 Active 7 DOM
-
2026-06-16remarks 450-char remark
-
2026-06-16days on market $160,000 Active 6 DOM
-
2026-06-15days on market $160,000 Active 5 DOM
-
2026-06-13days on market $160,000 Active 3 DOM
-
2026-06-13remarks 384-char remark
-
2026-06-13$160,000 Active 2 DOM
ⓘ Source: listings_history table (triggers on properties + properties_extension) + one-shot
backfill from property_details.listing_events for pre-trigger history.
Nearby sold comps map
Loading sold comps map…
Walkable amenities ~0.75 mi
Loading nearby amenities…
Taxation est. · year 1
- Rental income
- $66,588
- − Mortgage interest
- −$8,962
- − Property taxes
- −$2,400
- − Insurance
- −$800
- − Repairs & maintenance
- −$5,327
- − Management
- −$5,327
- − Depreciation
- −$4,655
- Taxable income
- $39,117
- Est. tax owed @ 24.0%
- −$9,388
- After-tax cash flow
- $29,948/yr
For passive investors: Depreciation is non-cash, so a rental often shows a tax loss while cash-flowing — sheltering income. Rental losses are passive: they offset passive income freely, and up to $25,000/yr can offset ordinary (W-2) income if you actively participate and your MAGI is under $100k (phasing out to $0 by $150k); unused losses carry forward. On sale, claimed depreciation is recaptured at up to 25%, and gains may owe capital-gains tax (a 1031 exchange can defer both). Figures are a year-1 estimate at your 24.0% rate — not tax advice; consult a CPA.
Schools (NCES district)
- District
- Cincinnati Public Schools
- NCES district ID
- 3904375
- Math proficiency
- 25% ▼ -19.00%
- Reading proficiency
- 36% ▼ -14.00%
- Median HH income
- $35,743
- Composite
- 25.21/100
- National rank
- #7508
- State rank
- #581 of 656 in OH
Livability — Cincinnati
- Score
- 80/100
- State rank
- #130
- US rank
- #1856
Category grades
Schools grade is shown separately in the Schools card above.
Census & demographics
- Census place
- Cincinnati, OH
- County
- Hamilton County · 701,295 people
- City population
- 505,555
- Metro
- Cincinnati, OH-KY-IN
- Population (ZIP)
- 9,583
- Household income
- $20,348
- Rent vs Own
- Severe rent burden
- 1466.0
Population outlook (Hamilton County) Hauer SSP2
- Today (2025)
- 826,054 people
- By 2030
- 830,947 · +0.6%
- By 2040
- 832,319 · +0.8%
- By 2050
- 822,428 · -0.4%
- By 2075
- 788,688 · -4.5%
- By 2100
- 710,674 · -14.0%
Race, ethnicity, and origin ACS 2023
- Neighborhood character
- Predominantly Black (72%)
- Race & ethnicity
- Black 72% White 17% Two or more races 7% Hispanic / Latino 5%
- Common ancestry
- Slovak 1% Romanian 1%
- Foreign-born
- 6% · Canada
- Languages at home
- 92% English-only · Spanish 2%
Political lean MEDSL · Hamilton
- 2024 margin
- D (+14.9) · D 57.0% · R 42.1%
- 2008→2024 swing
- +7.9pp toward D · 2008: 7.0pp · 2024: 14.9pp
- All cycles
- 2024: D+14.9 2020: D+15.9 2016: D+9.5 2012: D+4.9 2008: D+7.0
Not yet ingested
- Civics
- —
Market trends
- HPI YoY
- ▲ 10.21%
- Current HPI
- 232.7908
- Rent YoY
- —
- Metro
- Cincinnati, OH-KY-IN
- State GDP YoY
- ▲ 1.98%
- F500 in state
- 48
Industry mix (Fortune 500 HQ in OH)
| Industry | F500 HQs | Revenue |
|---|---|---|
| Insurance | 3 | $145B |
|
||
| Industrial Machinery | 3 | $49B |
|
||
| Financial Services | 3 | $24B |
|
||
| Consumer Goods | 2 | $93B |
|
||
| Aerospace / Defense | 2 | $47B |
|
||
| Utilities | 2 | $33B |
|
||
Price history
+28.0% since first listed3 events — show timeline
- 2026-06-10 Listed $160,000 Cincy MLS
- 2003-02-07 Listing Removed — Cincy MLS
- 2002-08-06 Listed $125,000 Cincy MLS
Cash-flow waterfall
monthlySold comps — $/sqft
last 12 mo · ≤1 miLoading sold comps…