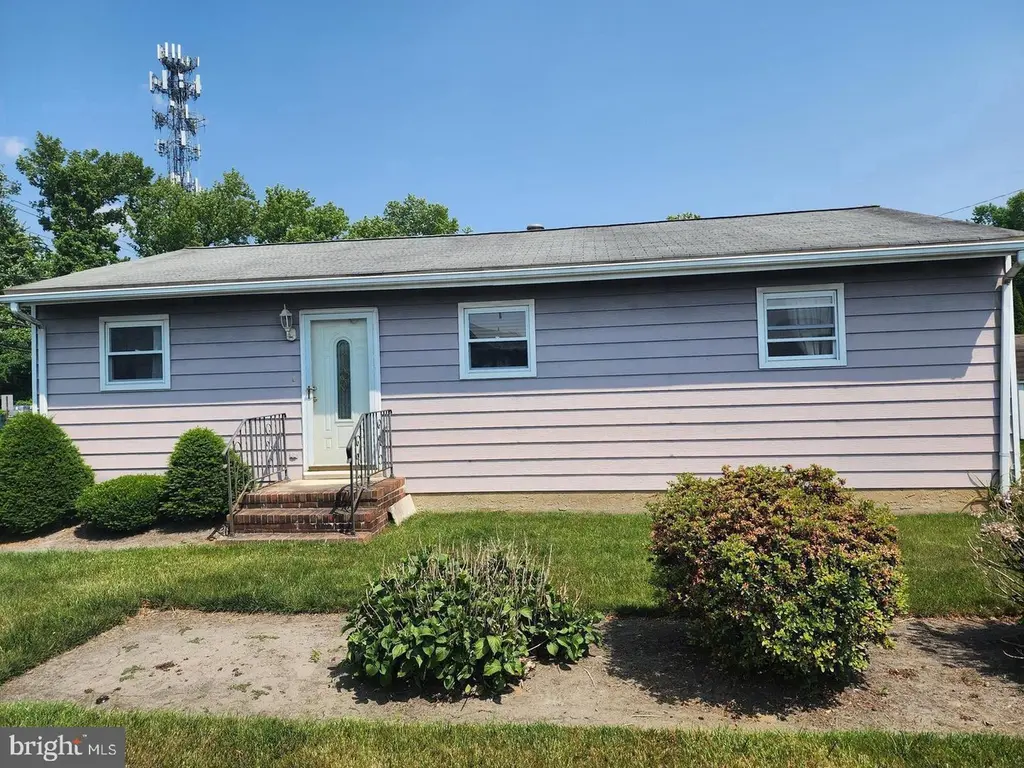
145 Gantt Ave · Woodbury, NJ
Flood risk 1/10 · Minimal
- FEMA flood zone
- X (unshaded)
- Chance of flooding over 30 yrs
- 0.0%
- Est. flood insurance / yr
- $507 – $1,088
Fire risk 1/10 · Minimal
- Est. fire insurance / yr
- $526 – $976
Heat risk 6/10 · Moderate
- Hot days now (above 104°F)
- 7 days/yr
- Hot days in 30 yrs
- 15 days/yr
Wind risk 6/10 · Moderate
- Chance of severe wind over 30 yrs
- 27.0%
Air-quality risk 3/10 · Minor
- Unhealthy air days now
- 2 days/yr
- Unhealthy air days in 30 yrs
- 5 days/yr
Risk factors via First Street. Map © Google.
Why this score? — see what drove the C+ grade
The composite is a weighted blend of 9 inputs, each scored 0–100. Each bar is that input's sub-score; the figure is the points it added to the 100-point composite (weight × sub-score).
- Cash flow +21.0/30.0
- ARV discount +15.0/15.0
- 1% rule +6.8/10.0
- DSCR +6.7/10.0
- Livability +3.8/5.0
- Rent growth +2.5/5.0
- Condition / age +2.5/5.0
- Schools +2.0/10.0
- Appreciation +0.0/10.0
$189,900
🖨 Deal sheet 📄 Offer letter ✓ Due diligence
Listing remarks
Welcome to 145 Gantt Avenue, a charming ranch-style home nestled in the desirable Woodbury Heights neighborhood of New Jersey. This lovely residence offers a comfortable and inviting living space, with several desirable features that are sure to impress prospective buyers. Step inside and discover a thoughtfully designed floor plan, boasting five well-appointed rooms that can be customized to suit your needs. The layout includes bedrooms for restful nights, bathrooms for convenience, a spacious living room for relaxation, and a kitchen perfect for culinary endeavors. One of the standout features of this home is the brand new central air conditioning and heating system, ensuring a comfortabl
Key facts
- Heating system
- Single-level living
- Granite countertops
Tags
Property features AI
Finance
- Other: Fee simple ownership; Not in a federal flood zone; Property condition listed as good to very good
Exterior
- Parking: Driveway parking (2 spaces); Total of 2 garage/parking spaces
- Utilities: Public water; Public sewer; Electric service (100 Amp); Natural gas available; Cable TV available
- Home design: Detached single-family home; Finished living area above grade (per assessor)
- Construction: Frame construction; Asphalt roof; Block foundation with crawl space; Double-pane insulated windows; Building not winterized
- Exterior features: Public water and sewer; Municipal trash service; Cable and electric available; Natural gas available; Shed on property; Lot dimensions approximately 50 x 105
Interior
- Kitchen: Built-in microwave; Dishwasher; Gas range/oven; Refrigerator
- Bedrooms: 3 bedrooms on main level
- Flooring: Ceramic tile; Engineered wood; Hardwood
- Bathrooms: 1 full bathroom on main level
- Heating & cooling: Central heating (forced air) with natural gas; Central air conditioning; Ceiling fans; Attic fan; 100 Amp electric service; Hot water: Electric and natural gas
- Interior features: Attic; Ceiling fans; Combination dining and living area; Eat-in kitchen; Insulated and storm doors
- Laundry & utility: Washer; Dryer
Neighborhood map
What this means for you Summary
Snapshot
- This is a 3-bed/1.0-bath single-family listed at $190k.
Deal economics
- At list price, monthly cash flow is $266 ($3k/yr) — positive.
- The deal already cash-flows at list — no discount required.
- Meets the 1% rule at list price ($2k rent vs $190k).
- Cap rate 8.0% vs local median 4.3% in Woodbury — top-decile yield for the area; either an underpriced asset or a hidden risk that comps aren't pricing in. Stress-test before assuming the spread holds.
Location & tenants
- Location reads 75/100 on livability (#163 in NJ, #4,241 nationally) — a middle-class / working-renter tenant base. Strengths: housing A+, health & safety A; Watch: schools C-, amenities D-, commute F.
- Woodbury City Public School District (suburban): math 10% / reading 35% proficiency, ranked #411 of 472 in NJ (top 87%) — low school quality limits family demand, transient renter base, plan for 1-2y turnover.
- Market conditions: 21 active listings in the ZIP; 4 comparable units currently listed for rent nearby; rentals at typical pace (median 15d on market — plan ~3-4 weeks tenant-placement turnaround); 1,047 units permitted in Gloucester County in 2024 (183 in 5+ unit buildings).
Forward outlook
- Local home prices are declining (-3.0%/yr); year-one equity from $1k of loan paydown is wiped out by about $6k of value loss. Plan a longer hold.
- Gloucester County population projected to shrink 5% by 2050 — rents likely to lag national; underwrite the cash flow, not the appreciation.
Negotiation context
- Only 13 days on market — expect competitive offers; lowballing is unlikely to land.
- 2 sale attempts since 3y ago with the ask held roughly flat each time — persistent listings suggest the price (not the market) is what's stuck; bring a comps-based counter.
- Current owner paid $49k; list at $190k implies a 288% gain — meaningful room to come down on a strong offer.
Risks & watch-outs
- Watch-outs: property tax is 2.7% of price.
- Climate carrying-cost: major wind risk, 27% chance of damaging wind over 30y; extreme-heat days projected 7→15/yr by 2055 (HVAC capex compounding) — expect insurance premiums to compound above CPI over the hold.
Questions for the listing agent
- Built in 1960 — when were the roof, HVAC, electrical panel, plumbing, and water heater last replaced?
- Property tax is high relative to price — has the assessment been appealed recently, and will the sale trigger a re-assessment?
- Is there a deadline driving the sale (1031 exchange, divorce, estate, relocation)? That informs how much negotiation room exists.
- What's the average days-on-market for RENTAL listings here right now (not sales)? A rising rental-DOM trend means longer vacancies and softer asking-rent achievability than the comps imply.
- What's the recent tenant-quality profile in this submarket — average credit score on applications, eviction rate, late-payment / NSF rate, and stable-employment percentage? A property-management company in the area should have these aggregated.
- How much new for-sale + rental construction is in the pipeline within 1–3 miles? Heavy new supply typically softens prices + rents 12–24 months out; constrained supply supports both.
Investment metrics
- 1% rule
- 1.18% ✓
- Cap rate
- 7.98%
- Cash-on-cash
- 6.01%
- DSCR
- 1.27
- GRM
- 7.1
CMA / ARV
- ARV (on-the-fly)
- $237,120
- Comps found
- 8
Show comp detail 8 sales within ~0.75 mi
| Address | Dist | Beds/Ba | Sqft | Sold | Price | $/sf | Match |
|---|---|---|---|---|---|---|---|
| 36 Packard Ave | 0.28mi | 3/1.0 | 936 (-2%) | 18mo | $230,922 | $247 | 68 |
| 58 Stuart St | 0.20mi | 3/1.0 | 1,024 (+7%) | 17mo | $150,000 | $146 | 65 |
| 210 Harding Ave | 0.35mi | 2/1.0 (-1) | 1,008 (+5%) | 23mo | $195,000 | $193 | 51 |
| 643 W Jersey Ave | 0.61mi | 2/1.5 (-1) | 1,027 (+7%) | 3mo | $310,000 | $302 | 51 |
| 232 S Maple St | 0.41mi | 3/1.0 | 1,058 (+10%) | 22mo | $250,000 | $236 | 45 |
| 62 Nelson Ave SE | 0.36mi | 2/1.0 (-1) | 820 (-15%) | 13mo | $184,900 | $225 | 43 |
| 156 Emerson St | 0.61mi | 4/1.0 (+1) | 1,064 (+11%) | 8mo | $281,000 | $264 | 42 |
| 730 Maple Rd | 0.70mi | 3/1.0 | 906 (-6%) | 22mo | $295,000 | $326 | 39 |
Match score weights: distance 35% · size 25% · config 20% · recency 20%. Top-matched comps best support the ARV.
Projected returns pro-forma
-3.0% appreciation · 3.0% rent growth · sell at horizon
- IRR
- -6.9%
- Equity multiple
- 0.74×
- Total profit
- $-13,657
- Equity at exit
- $28,315
- IRR
- 2.8%
- Equity multiple
- 1.20×
- Total profit
- $10,561
- Equity at exit
- $16,419
Cash invested: $53,172 (down + closing). Projections, not guarantees.
Landlord ↔ Tenant lean methodology
- Overall (STATE)
- 21 Tenant-Leaning
- State New Jersey
- 21 Tenant-Leaning · D+6
- County
- — inherits STATE
- City
- — inherits STATE
ZIP-level market 08097
- Home prices YoY
- -20.0%
- Active inventory
- 21
- Price-to-rent
- 7.1×
Monthly cashflow live
- Estimated rent
- $2,238 medium interval (Pro) →
- Mortgage (P&I)
- −$996
- Tax from tax record
- −$426 /mo · $5,118/yr
- Insurance
- −$79
- HOA
- −$0
- Vacancy / Maint / Mgmt
- −$470
- Net cashflow
- $266
Break-even live
UW: 25.0% down · 7.5% · 30yr · 1.5% tax · 5.0% vac · 8.0% maint · 8.0% mgmt
Financing live
Cash to close
- Down payment
- $47,475
- Closing costs
- $5,697
- Reserves months
- —
- Total cash needed
- —
Loan-product check · same deal, 3 products live
Conventional
25% down · 7.5% · 30yr
- Down + closing
- —
- Monthly P&I
- —
- Monthly cashflow
- —
- DSCR
- —
- Eligible?
- —
Personal DTI + credit; lowest rate.
DSCR
20% down · 8.5% · 30yr
- Down + closing
- —
- Monthly P&I
- —
- Monthly cashflow
- —
- DSCR
- —
- Eligible?
- —
No personal income docs; deal must DSCR.
Hard money
10% down · 12.0% · 12mo
- Down + closing
- —
- Monthly P&I
- —
- Monthly cashflow
- —
- DSCR
- —
- Eligible?
- —
Short-term bridge; refi at stabilization.
Rent comps 4 comps
| Address | Beds | Baths | Sqft | Rent | $/sqft | DOM | Units | Dist |
|---|---|---|---|---|---|---|---|---|
| 523 Chestnut Ave Woodbury Heights, NJ | 1.0–2.0 | 1.0–2.0 | 929 | $3,007 | $3.24 | 1d | 138 | 1.07mi |
| 568 N Evergreen Ave Woodbury, NJ | 1.0–2.0 | 1.0 | 842 | $1,870 | $2.22 | 12d | 5 | 1.31mi |
| 517 Tatum St West Deptford, NJ | 2.0 | 1.0 | 722 | $2,000 | $2.77 | 23d | 1 | 1.38mi |
| 601 Tatum St West Deptford, NJ | 1.0–2.0 | 1.0 | 750 | $1,650 | $2.20 | 14d | 3 | 1.44mi |
Listing history 10 events
-
2026-05-05status Pending
-
2026-04-08historical Active Under Contract
-
2026-03-26$189,900 Active
-
2023-06-28status Pending
-
2023-06-28historical
-
2023-06-27historical Active Under Contract
-
2023-06-08$179,900 Active
-
2023-06-08historical
-
1994-12-07soldstatus $49,000
-
1979-06-01soldstatus $27,000
ⓘ Source: listings_history table (triggers on properties + properties_extension) + one-shot
backfill from property_details.listing_events for pre-trigger history.
Tax reassessment forecast NJ · Partial reset (capped growth)
- Current annual tax
- $5,118 · $426/mo
- Projected year-2 tax
- $5,118 · $426/mo
- Expected delta
- $0/yr ($0/mo · 0.0%)
ⓘ Screening estimate from a state-policy table — verify with the county assessor before closing.
Climate risk First Street
- Flood 1/10 Low FEMA zone X (unshaded) · 0% chance over 30 yrs
- Wildfire 1/10 Low
- Heat 6/10 Major 7 d/yr ≥104°F today · 15 d/yr by 30 yrs out
- Wind 6/10 Major 27% chance of damaging wind over 30 yrs
- Air quality 3/10 Moderate 2 unhealthy d/yr today · 5 by 30 yrs out
Nearby sold comps map
Loading sold comps map…
Walkable amenities ~0.75 mi
Loading nearby amenities…
Taxation est. · year 1
- Rental income
- $26,853
- − Mortgage interest
- −$10,637
- − Property taxes
- −$5,118
- − Insurance
- −$950
- − Repairs & maintenance
- −$2,148
- − Management
- −$2,148
- − Depreciation
- −$5,524
- Taxable income
- $328
- Est. tax owed @ 24.0%
- −$79
- After-tax cash flow
- $3,118/yr
For passive investors: Depreciation is non-cash, so a rental often shows a tax loss while cash-flowing — sheltering income. Rental losses are passive: they offset passive income freely, and up to $25,000/yr can offset ordinary (W-2) income if you actively participate and your MAGI is under $100k (phasing out to $0 by $150k); unused losses carry forward. On sale, claimed depreciation is recaptured at up to 25%, and gains may owe capital-gains tax (a 1031 exchange can defer both). Figures are a year-1 estimate at your 24.0% rate — not tax advice; consult a CPA.
Schools (NCES district)
- District
- Woodbury City Public School District
- NCES district ID
- 3418150
- Math proficiency
- 10% ▼ -13.00%
- Reading proficiency
- 35% ▬ 0.00%
- Median HH income
- $53,810
- Composite
- 20.25/100
- National rank
- #8621
- State rank
- #411 of 472 in NJ
Livability — Woodbury
- Score
- 75/100
- State rank
- #163
- US rank
- #4241
Category grades
Schools grade is shown separately in the Schools card above.
Census & demographics
- Census place
- Woodbury, NJ
- City population
- 35,336
- Population (ZIP)
- 3,207
Population outlook (Gloucester County) Hauer SSP2
- Today (2025)
- 298,895 people
- By 2030
- 299,031 · +0.0%
- By 2040
- 294,020 · -1.6%
- By 2050
- 284,188 · -4.9%
- By 2075
- 260,720 · -12.8%
- By 2100
- 229,565 · -23.2%
Race, ethnicity, and origin ACS 2023
- Neighborhood character
- Predominantly White (87%)
- Race & ethnicity
- White 87% Hispanic / Latino 5% Two or more races 5% Black 3% Asian 1%
- Hispanic origin (detail)
- Mexican 2% Puerto Rican 2%
- Common ancestry
- Romanian 6% Slovak 2% Lithuanian 2%
- Foreign-born
- 2% · Canada
- Languages at home
- 94% English-only · Spanish 5% Other Indo-European 1% Tagalog/Filipino 1%
Political lean MEDSL · Gloucester
- 2024 margin
- Toss-up / Even · D 47.8% · R 50.6% · Other 1.6%
- 2008→2024 swing
- -15.0pp toward R · 2008: 12.2pp · 2024: -2.8pp
- All cycles
- 2024: R+2.8 2020: D+1.9 2016: R+0.4 2012: D+10.5 2008: D+12.2
Not yet ingested
- Civics
- —
Market trends
- HPI YoY
- ▼ -85.24%
- Current HPI
- 340.3502
- Rent YoY
- —
- Metro
- —
- State GDP YoY
- ▲ 2.05%
- F500 in state
- 34
Industry mix (Fortune 500 HQ in NJ)
| Industry | F500 HQs | Revenue |
|---|---|---|
| Consumer Goods | 3 | $31B |
|
||
| Pharmaceuticals | 2 | $153B |
|
||
| Technology | 2 | $21B |
|
||
| Insurance | 2 | $20B |
|
||
| Healthcare | 2 | $19B |
|
||
| Financial Services | 1 | $70B |
|
||
Price history
+603.3% since first listed10 events — show timeline
- 2026-05-05 Pending — BRIGHT MLS
- 2026-04-08 Contingent — BRIGHT MLS
- 2026-03-26 Listed $189,900 BRIGHT MLS
- 2023-06-28 Pending — BRIGHT MLS
- 2023-06-28 Listing Removed — BRIGHT MLS
- 2023-06-27 Contingent — BRIGHT MLS
- 2023-06-08 Listed $179,900 BRIGHT MLS
- 2023-06-08 Coming Soon — BRIGHT MLS
- 1994-12-07 Sold (Public Records) $49,000 Public Records
- 1979-06-01 Sold (Public Records) $27,000 Public Records
Property tax history
+2.3%/yrLatest (2025): $5,118 · +1.1% YoY. Source: county tax records.
Cash-flow waterfall
monthlySold comps — $/sqft
last 12 mo · ≤1 miLoading sold comps…