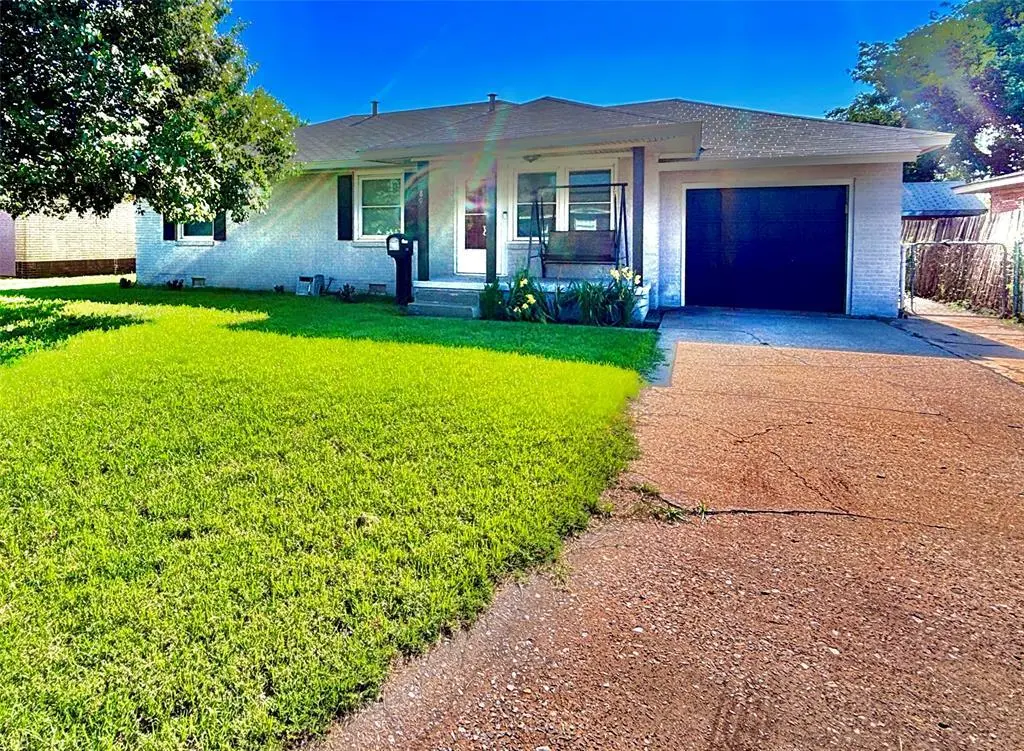
1805 N Willard St · Altus, OK
Flood risk 1/10 · Minimal
- FEMA flood zone
- X (unshaded)
- Chance of flooding over 30 yrs
- 0.0%
- Est. flood insurance / yr
- $507 – $1,088
Fire risk 1/10 · Minimal
- Est. fire insurance / yr
- $2,463 – $4,575
Heat risk 6/10 · Moderate
- Hot days now (above 108°F)
- 7 days/yr
- Hot days in 30 yrs
- 20 days/yr
Wind risk 3/10 · Minor
- Chance of severe wind over 30 yrs
- 4.0%
Air-quality risk 1/10 · Minimal
- Unhealthy air days now
- 0 days/yr
- Unhealthy air days in 30 yrs
- 0 days/yr
Risk factors via First Street. Map © Google.
Why this score? — see what drove the F grade
The composite is a weighted blend of 9 inputs, each scored 0–100. Each bar is that input's sub-score; the figure is the points it added to the 100-point composite (weight × sub-score).
- Cash flow +10.9/30.0
- DSCR +3.2/10.0
- Livability +3.2/5.0
- Rent growth +2.5/5.0
- Schools +2.5/10.0
- Condition / age +2.5/5.0
- 1% rule +2.4/10.0
- ARV discount +0.0/15.0
- Appreciation +0.0/10.0
$129,900
🖨 Deal sheet 📄 Offer letter ✓ Due diligence
Listing remarks MLS
Totally updated inside and out! Kitchen has new recess lighting, countertops, backsplash, and cabinets with GE black appliances. New light fixtures, carpet, white trim and neutral paint throughout. Bathroom has oversized tub and tiled shower. Good size bedrooms with white doors and nice size closets. Inside laundry. Newer windows and furnace. Outside has been completely repainted with a new garage door and opener. Detached two car garage with alley entrance. Large fenced backyard. Move in ready!
Key facts
- Cozy breakfast nook
- Large kitchen
- Two separate garages
Tags
Property features AI
Finance
- Other: Located in Lakeview Terrace addition; Homestead not indicated
- Financial info: Not assumable
- HOA & community: No mandatory association dues
Exterior
- Parking: 3-car garage
- Utilities: No flood insurance indicated
- Home design: Single-family residence; One story; Existing property
- Construction: Brick construction; Composition roof; Post-tension foundation; Built as existing (no recent construction)
- Exterior features: Porch; Storage; Workshop; Chain link fence
Interior
- Bedrooms: 3 bedrooms (all on one level)
- Bathrooms: 1 full bathroom
- Interior features: No fireplace; No in-law plan; One living area; One dining area
Neighborhood map
What this means for you Summary
Snapshot
- This is a 2-bed/1.0-bath single-family listed at $130k.
Deal economics
- At list price, monthly cash flow is $-58 ($-692/yr) — negative.
- To cash-flow at today's rent, offer at most $120k (7.8% below list).
- To meet the 1% rule (rent ≥ 1% of price), the offer needs to be $97k (25.5% below list).
- Recommended offer: $97k (25.5% below list) — sets the bar for 1% rule.
- Cap rate 5.8% vs local median 3.7% in Altus — top-decile yield for the area; either an underpriced asset or a hidden risk that comps aren't pricing in. Stress-test before assuming the spread holds.
Location & tenants
- Location reads 65/100 on livability (#151 in OK) — a middle-class / working-renter tenant base. Strengths: cost of living A+, housing A+; Watch: employment C-, amenities F, commute F.
- Altus (town): math 31% / reading 28% proficiency, ranked #69 of 270 in OK (top 26%) — low school quality limits family demand, transient renter base, plan for 1-2y turnover.
- Zoned schools: Altus Es (math 27% / reading 17%, grade F, #413 of 845 statewide, top 54%, 408 students, 0% FRL); Altus Hs (math 21% / reading 26%, grade F, #218 of 447 statewide, top 49%, 921 students, 0% FRL) — zoned schools average 0% FRL vs 55% district-wide (55 pts lower); this property's tenant base skews higher-income than the district average.
- Market conditions: 165 active listings in the ZIP; 8 units permitted in Jackson County in 2024 (0 in 5+ unit buildings).
Forward outlook
- Local home prices are declining (-3.0%/yr); year-one equity from $898 of loan paydown is wiped out by about $4k of value loss. Plan a longer hold.
- Jackson County population projected to shrink 6% by 2050 — rents likely to lag national; underwrite the cash flow, not the appreciation.
Negotiation context
- Only 1 days on market — expect competitive offers; lowballing is unlikely to land.
- 5 sale attempts since 15y ago with the ask held roughly flat each time — persistent listings suggest the price (not the market) is what's stuck; bring a comps-based counter.
- Current owner paid $90k; 45% above their basis — modest negotiation headroom, anchor on the comps not their cost.
Risks & watch-outs
- Climate carrying-cost: extreme-heat days projected 7→20/yr by 2055 (HVAC capex compounding) — expect insurance premiums to compound above CPI over the hold.
Questions for the listing agent
- What do current leases actually rent for vs. the listed asking? Can we see a recent rent roll and the last 12 months of T-12 income?
- Built in 1977 — when were the roof, HVAC, electrical panel, plumbing, and water heater last replaced?
- Is there a deadline driving the sale (1031 exchange, divorce, estate, relocation)? That informs how much negotiation room exists.
- Schools are D-rated, which usually means shorter tenancies and higher turnover. Who's the typical renter profile here, and what's been the actual vacancy rate?
- The area grade is low — what's the realistic commute time and amenity access for the typical tenant pool here? Any planned neighborhood developments (good or bad) we should know about?
- What's the average days-on-market for RENTAL listings here right now (not sales)? A rising rental-DOM trend means longer vacancies and softer asking-rent achievability than the comps imply.
- What's the recent tenant-quality profile in this submarket — average credit score on applications, eviction rate, late-payment / NSF rate, and stable-employment percentage? A property-management company in the area should have these aggregated.
- How much new for-sale + rental construction is in the pipeline within 1–3 miles? Heavy new supply typically softens prices + rents 12–24 months out; constrained supply supports both.
Investment metrics
- 1% rule
- 0.74% ✗
- Cap rate
- 5.76%
- Cash-on-cash
- -1.90%
- DSCR
- 0.92
- GRM
- 11.2
CMA / ARV
- ARV (on-the-fly)
- $110,864
- Comps found
- 9
Show comp detail 9 sales within ~0.75 mi
| Address | Dist | Beds/Ba | Sqft | Sold | Price | $/sf | Match |
|---|---|---|---|---|---|---|---|
| 1424 N Lee St | 0.34mi | 2/1.0 | 1,126 (+6%) | 4mo | $49,900 | $44 | 71 |
| 711 W Martha St | 0.31mi | 3/1.5 (+1) | 1,120 (+5%) | 4mo | $117,000 | $104 | 67 |
| 1120 N Benson St | 0.59mi | 2/1.0 | 1,043 (-2%) | 13mo | $87,500 | $84 | 58 |
| 1727 Crain Dr | 0.08mi | 3/1.0 (+1) | 956 (-10%) | 22mo | $103,000 | $108 | 56 |
| 112 S Mockingbird Dr | 0.20mi | 3/2.0 (+1) | 1,164 (+9%) | 14mo | $163,500 | $140 | 55 |
| 805 W Judy Ave | 0.38mi | 3/1.0 (+1) | 1,204 (+13%) | 1mo | $77,500 | $64 | 54 |
| 2009 N Canary Ln | 0.38mi | 3/1.5 (+1) | 1,158 (+9%) | 23mo | $170,000 | $147 | 42 |
| 2421 Cherokee Strip | 0.56mi | 3/2.0 (+1) | 1,208 (+13%) | 7mo | $165,000 | $137 | 37 |
| 2013 N Flamingo Ln | 0.31mi | 3/2.0 (+1) | 1,221 (+14%) | 21mo | $125,000 | $102 | 35 |
Match score weights: distance 35% · size 25% · config 20% · recency 20%. Top-matched comps best support the ARV.
Projected returns pro-forma
-3.0% appreciation · 3.0% rent growth · sell at horizon
- IRR
- -19.5%
- Equity multiple
- 0.32×
- Total profit
- $-24,755
- Equity at exit
- $19,369
- IRR
- -12.3%
- Equity multiple
- 0.27×
- Total profit
- $-26,417
- Equity at exit
- $11,231
Cash invested: $36,372 (down + closing). Projections, not guarantees.
Landlord ↔ Tenant lean methodology
- Overall (STATE)
- 83 Strongly Landlord-Friendly
- State Oklahoma
- 83 Strongly Landlord-Friendly · R+20
- County
- — inherits STATE
- City
- — inherits STATE
ZIP-level market 73521
- Home prices YoY
- -18.4%
- Active inventory
- 165
- Price-to-rent
- 11.2×
Monthly cashflow live
- Estimated rent
- $967 medium interval (Pro) →
- Mortgage (P&I)
- −$681
- Tax from tax record
- −$87 /mo · $1,040/yr
- Insurance
- −$54
- HOA
- −$0
- Vacancy / Maint / Mgmt
- −$203
- Net cashflow
- $-58
Break-even live
UW: 25.0% down · 7.5% · 30yr · 1.5% tax · 5.0% vac · 8.0% maint · 8.0% mgmt
Financing live
Cash to close
- Down payment
- $32,475
- Closing costs
- $3,897
- Reserves months
- —
- Total cash needed
- —
Loan-product check · same deal, 3 products live
Conventional
25% down · 7.5% · 30yr
- Down + closing
- —
- Monthly P&I
- —
- Monthly cashflow
- —
- DSCR
- —
- Eligible?
- —
Personal DTI + credit; lowest rate.
DSCR
20% down · 8.5% · 30yr
- Down + closing
- —
- Monthly P&I
- —
- Monthly cashflow
- —
- DSCR
- —
- Eligible?
- —
No personal income docs; deal must DSCR.
Hard money
10% down · 12.0% · 12mo
- Down + closing
- —
- Monthly P&I
- —
- Monthly cashflow
- —
- DSCR
- —
- Eligible?
- —
Short-term bridge; refi at stabilization.
Listing history 3 events
-
2026-06-12status $129,900 Pending 1 DOM
-
2026-06-09remarks 462-char remark
-
2026-06-09$129,900 Active 1 DOM
ⓘ Source: listings_history table (triggers on properties + properties_extension) + one-shot
backfill from property_details.listing_events for pre-trigger history.
Tax reassessment forecast OK · Resets to sale price
- Current annual tax
- $1,040 · $87/mo
- Projected year-2 tax
- $1,169 · $97/mo
- Expected delta
- +$129/yr (+$11/mo · 12.4%)
ⓘ Screening estimate from a state-policy table — verify with the county assessor before closing.
Climate risk First Street
- Flood 1/10 Low FEMA zone X (unshaded) · 0% chance over 30 yrs
- Wildfire 1/10 Low
- Heat 6/10 Major 7 d/yr ≥108°F today · 20 d/yr by 30 yrs out
- Wind 3/10 Moderate 4% chance of damaging wind over 30 yrs
- Air quality 1/10 Low 0 unhealthy d/yr today · 0 by 30 yrs out
Nearby sold comps map
Loading sold comps map…
Walkable amenities ~0.75 mi
Loading nearby amenities…
Taxation est. · year 1
- Rental income
- $11,610
- − Mortgage interest
- −$7,276
- − Property taxes
- −$1,040
- − Insurance
- −$650
- − Repairs & maintenance
- −$929
- − Management
- −$929
- − Depreciation
- −$3,779
- Taxable loss
- −$2,993
- Est. tax savings @ 24.0%
- +$718
- After-tax cash flow
- $26/yr
For passive investors: Depreciation is non-cash, so a rental often shows a tax loss while cash-flowing — sheltering income. Rental losses are passive: they offset passive income freely, and up to $25,000/yr can offset ordinary (W-2) income if you actively participate and your MAGI is under $100k (phasing out to $0 by $150k); unused losses carry forward. On sale, claimed depreciation is recaptured at up to 25%, and gains may owe capital-gains tax (a 1031 exchange can defer both). Figures are a year-1 estimate at your 24.0% rate — not tax advice; consult a CPA.
Schools (NCES district)
- District
- Altus
- NCES district ID
- 4002850
- Math proficiency
- 31% ▼ -9.00%
- Reading proficiency
- 28% ▼ -10.00%
- Median HH income
- $40,607
- Composite
- 24.91/100
- National rank
- #7574
- State rank
- #69 of 270 in OK
Livability — Altus
- Score
- 65/100
- State rank
- #151
- US rank
- #13386
Category grades
Schools grade is shown separately in the Schools card above.
Census & demographics
- Census place
- Altus, OK
- City population
- 20,574
- Population (ZIP)
- 20,352
Population outlook (Jackson County) Hauer SSP2
- Today (2025)
- 24,084 people
- By 2030
- 23,476 · -2.5%
- By 2040
- 22,731 · -5.6%
- By 2050
- 22,586 · -6.2%
- By 2075
- 25,413 · +5.5%
- By 2100
- 31,069 · +29.0%
Race, ethnicity, and origin ACS 2023
- Neighborhood character
- Diverse neighborhood (Simpson 0.57)
- Race & ethnicity
- White 60% Hispanic / Latino 26% Two or more races 12% Black 7% Native American 2% Asian 2%
- Hispanic origin (detail)
- Mexican 21% Puerto Rican 1%
- Common ancestry
- Slovak 2% Lithuanian 1% Iranian 1%
- Foreign-born
- 6% · Canada
- Languages at home
- 83% English-only · Spanish 15% Tagalog/Filipino 1% German/W. Germanic 1%
Political lean MEDSL · Jackson
- 2024 margin
- Solid R (+58.3) · D 19.9% · R 78.2% · Other 1.9%
- 2008→2024 swing
- -8.7pp toward R · 2008: -49.6pp · 2024: -58.3pp
- All cycles
- 2024: R+58.3 2020: R+57.7 2016: R+57.6 2012: R+50.7 2008: R+49.6
Not yet ingested
- Civics
- —
Market trends
- HPI YoY
- ▼ -40.26%
- Current HPI
- 178.7106
- Rent YoY
- —
- Metro
- —
- State GDP YoY
- ▲ 1.55%
- F500 in state
- 6
Industry mix (Fortune 500 HQ in OK)
| Industry | F500 HQs | Revenue |
|---|---|---|
| Energy | 3 | $48B |
|
||
Price history
+116.5% since first listed11 events — show timeline
- 2026-06-04 Listed $129,900 MLSOK
- 2016-05-13 Sold (Public Records) $89,600 Public Records
- 2016-05-13 Sold (MLS) $89,600 MLSOK
- 2016-03-30 Listed $92,500 MLSOK
- 2015-12-03 Listed $41,500 MLSOK
- 2015-12-01 Sold (MLS) $41,000 LBRMLS
- 2015-11-05 Listed $41,500 LBRMLS
- 2011-07-15 Sold (MLS) $80,000 MLSOK
- 2011-06-17 Sold (Public Records) $80,000 Public Records
- 2011-04-19 Listed $80,000 MLSOK
- 1998-09-04 Sold (Public Records) $60,000 Public Records
Property tax history
+3.5%/yrLatest (2025): $1,040 · +4.6% YoY. Source: county tax records.
Cash-flow waterfall
monthlySold comps — $/sqft
last 12 mo · ≤1 miLoading sold comps…