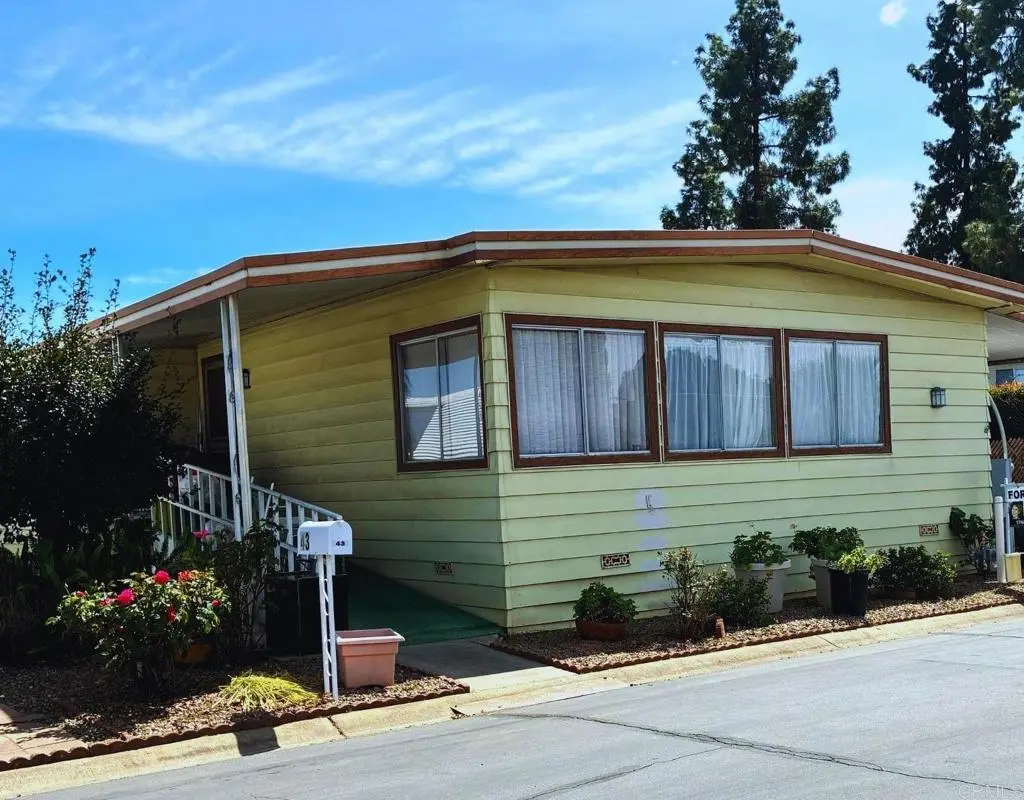
2280 E Valley Pkwy #43 · Escondido, CA
Flood risk 1/10 · Minimal
- FEMA flood zone
- X (shaded)
- Chance of flooding over 30 yrs
- 0.0%
- Est. flood insurance / yr
- $507 – $1,088
Fire risk 7/10 · Major
- Est. fire insurance / yr
- $659 – $1,223
Heat risk 6/10 · Moderate
- Hot days now (above 99°F)
- 7 days/yr
- Hot days in 30 yrs
- 21 days/yr
Wind risk 1/10 · Minimal
- Chance of severe wind over 30 yrs
- —
Air-quality risk 4/10 · Minor
- Unhealthy air days now
- 6 days/yr
- Unhealthy air days in 30 yrs
- 7 days/yr
Risk factors via First Street. Map © Google.
Why this score? — see what drove the B+ grade
The composite is a weighted blend of 9 inputs, each scored 0–100. Each bar is that input's sub-score; the figure is the points it added to the 100-point composite (weight × sub-score).
- Cash flow +30.0/30.0
- ARV discount +15.0/15.0
- 1% rule +10.0/10.0
- DSCR +10.0/10.0
- Livability +3.5/5.0
- Schools +3.3/10.0
- Rent growth +3.1/5.0
- Condition / age +2.5/5.0
- Appreciation +0.0/10.0
$139,000
🖨 Deal sheet 📄 Offer letter ✓ Due diligence
Listing remarks MLS
VERY SPACIOUS TWO BEDROOM HOME LOCATED TOWARDS THE BACK OF THE PARK-AWAY FROM VALLEY PARKWAY. EARTHQUAKE BRACING, NEWER CARPET, COPPER PLUMBING & ROOF CHECKED EVERY YEAR. LARGE LIVING ROOM, COZY FAMILY ROOM AND TWO VERY GOOD SIZED BEDROOMS PLUS A CALIFORNIA ROOM. THIS IS A SENIOR PARK WITH A GREAT CLUBHOUSE, POOL, SPA, POOL TABLES, LIBRARY AND COMPUTER ROOM. BUSSTOP IN FRONT. VONS & RALPHS 2 BLOCKS AWAY. RENT INCLUDES WATER, TRASH, SEWER & CABLE. INDOOR PET ON APPROVAL. COME & SEE!
Key facts
- Clubhouse
- Spa
- Sauna
Tags
Property features AI
Finance
- Other: Lot size and living area per public records
- Financial info: Land lease of $695 per month
- HOA & community: Located in a senior community; Community features include valley setting and street lighting; Park name: TOWN & COUNTRY; Manager approval required
Exterior
- Parking: 2 parking spaces; 2 carport spaces
- Utilities: Public sewer
- Home design: Single-story mobile home (Skyline model); Mobile home dimensions approximately 12' x 56'; Mobile home remains on the lot; Entry at front door or carport
- Construction: Mobile home construction
- Exterior features: Community pool; Cul-de-sac location; Front yard; Has a view; One shed on the property
Interior
- Bedrooms: All bedrooms located on the main level
- Bathrooms: 2 full bathrooms
- Heating & cooling: Cooling present (details in remarks)
- Interior features: One-level home; Front door or carport entry; All bedrooms on the main level; Has cooling (see remarks for details)
- Laundry & utility: Laundry inside the home
Neighborhood map
What this means for you Summary
Snapshot
- This is a 2-bed/2.0-bath manufactured listed at $139k.
Deal economics
- At list price, monthly cash flow is $1k ($17k/yr) — positive.
- The deal already cash-flows at list — no discount required.
- Meets the 1% rule at list price ($3k rent vs $139k).
- Recommended offer: $135k (3.0% below list) — sets the bar for market timing.
- Cap rate 18.4% vs local median 2.5% in Escondido — top-decile yield for the area; either an underpriced asset or a hidden risk that comps aren't pricing in. Stress-test before assuming the spread holds.
Location & tenants
- Location reads 70/100 on livability (#238 in CA) — a middle-class / working-renter tenant base. Strengths: amenities A+, commute A+, employment B; Watch: health & safety C-, schools D+, crime D+.
- Escondido Union High (suburban): math 19% / reading 56% proficiency, ranked #247 of 517 in CA (top 48%) — families likely to look elsewhere, expect single-tenant / working-renter base with shorter leases.
- Market conditions: Rents rising (+2.5%/yr); 136 active listings in the ZIP; 22 comparable units currently listed for rent nearby; rentals leasing fast (median 2d on market — plan ~1-2 weeks tenant-placement turnaround); solid renter incomes; 11,759 units permitted in San Diego County in 2024 (7,244 in 5+ unit buildings).
- This rent runs 36% of the median local income ($93k/yr) — at the standard rent-burdened threshold; future hikes will face affordability resistance.
Forward outlook
- Local home prices are declining (-3.0%/yr); year-one equity from $961 of loan paydown is wiped out by about $4k of value loss. Plan a longer hold.
- San Diego County population projected at +20% by 2050 — long-run rental-demand tailwind backs the buy-and-hold thesis.
- At projected returns (-3.0% appreciation + 2.5% rent growth), your $39k cash investment doubles in ~3 years — after that, you're playing with house money.
Negotiation context
- It's been on market 53 days — a 3% lower offer ($135k) is reasonable based on typical stale-listing flexibility.
- 3 sale attempts since 18y ago with the ask held roughly flat each time — persistent listings suggest the price (not the market) is what's stuck; bring a comps-based counter.
- Current owner paid $35k; list at $139k implies a 297% gain — meaningful room to come down on a strong offer.
Risks & watch-outs
- Climate carrying-cost: major wildfire risk; extreme-heat days projected 7→21/yr by 2055 (HVAC capex compounding) — expect insurance premiums to compound above CPI over the hold.
Questions for the listing agent
- It's been on market 53 days. Have you received any prior offers? Is the seller open to a 3% concession, seller financing, or rate buy-down credit?
- Built in 1970 — when were the roof, HVAC, electrical panel, plumbing, and water heater last replaced?
- Is there a deadline driving the sale (1031 exchange, divorce, estate, relocation)? That informs how much negotiation room exists.
- Schools are D-rated, which usually means shorter tenancies and higher turnover. Who's the typical renter profile here, and what's been the actual vacancy rate?
- Crime grade is D in this area — have there been break-ins, vandalism, or insurance claims at this property in the last 3 years? What carrier currently insures it and at what premium?
- What's the average days-on-market for RENTAL listings here right now (not sales)? A rising rental-DOM trend means longer vacancies and softer asking-rent achievability than the comps imply.
- What's the recent tenant-quality profile in this submarket — average credit score on applications, eviction rate, late-payment / NSF rate, and stable-employment percentage? A property-management company in the area should have these aggregated.
- How much new for-sale + rental construction is in the pipeline within 1–3 miles? Heavy new supply typically softens prices + rents 12–24 months out; constrained supply supports both.
Investment metrics
- 1% rule
- 2.02% ✓
- Cap rate
- 18.43%
- Cash-on-cash
- 43.35%
- DSCR
- 2.93
- GRM
- 4.1
CMA / ARV
- ARV (on-the-fly)
- $256,704
- Comps found
- 12
Show comp detail 12 sales within ~0.75 mi
| Address | Dist | Beds/Ba | Sqft | Sold | Price | $/sf | Match |
|---|---|---|---|---|---|---|---|
| 2280 E Valley Pkwy #4 | 0.00mi | 2/2.0 | 1,362 (+1%) | 2mo | $259,999 | $191 | 96 |
| 2280 E Valley Pkwy #79 | 0.00mi | 2/2.0 | 1,368 (+2%) | 4mo | $160,000 | $117 | 94 |
| 211 N Citrus Ave #270 | 0.40mi | 2/2.0 | 1,344 (0%) | 0mo | $147,000 | $109 | 81 |
| 2300 E Valley Pkwy #237 | 0.17mi | 2/2.0 | 1,440 (+7%) | 6mo | $150,000 | $104 | 75 |
| 2300 E Valley #84 | 0.17mi | 2/2.0 | 1,440 (+7%) | 6mo | $179,000 | $124 | 75 |
| 2550 E Valley Pkwy #77 | 0.43mi | 3/2.0 (+1) | 1,344 (0%) | 0mo | $370,000 | $275 | 74 |
| 2300 E Valley #76 | 0.17mi | 2/2.0 | 1,222 (-9%) | 5mo | $246,000 | $201 | 73 |
| 2700 E Valley Pkwy #272 | 0.64mi | 3/2.0 (+1) | 1,344 (0%) | 3mo | $280,000 | $208 | 62 |
| 2300 E Valley Pkwy Spc 125 Pkwy | 0.14mi | 3/2.0 (+1) | 1,535 (+14%) | 8mo | $270,000 | $176 | 58 |
| 211 N Citrus Ave #22 | 0.40mi | 2/2.0 | 1,200 (-11%) | 8mo | $195,000 | $163 | 57 |
| 2700 E Valley Pkwy #298 | 0.74mi | 3/2.0 (+1) | 1,404 (+4%) | 8mo | $362,000 | $258 | 46 |
| 2700 E Valley Pkwy #315 | 0.70mi | 3/2.0 (+1) | 1,152 (-14%) | 1mo | $260,000 | $226 | 37 |
Match score weights: distance 35% · size 25% · config 20% · recency 20%. Top-matched comps best support the ARV.
Projected returns pro-forma
-3.0% appreciation · 2.5% rent growth · sell at horizon
- IRR
- 39.6%
- Equity multiple
- 2.68×
- Total profit
- $65,565
- Equity at exit
- $20,725
- IRR
- 45.8%
- Equity multiple
- 5.28×
- Total profit
- $166,487
- Equity at exit
- $12,018
Cash invested: $38,920 (down + closing). Projections, not guarantees.
Landlord ↔ Tenant lean methodology
- Overall (STATE)
- 18 Strongly Tenant-Friendly
- State California
- 18 Strongly Tenant-Friendly · D+13
- County
- — inherits STATE
- City
- — inherits STATE
ZIP-level market 92027
- Rents YoY
- 2.5%
- Active inventory
- 136
- Price-to-rent
- 4.1×
Monthly cashflow live
- Estimated rent
- $2,811 high interval (Pro) →
- Mortgage (P&I)
- −$729
- Tax from tax record
- −$28 /mo · $335/yr
- Insurance
- −$58
- HOA
- −$0
- Vacancy / Maint / Mgmt
- −$590
- Net cashflow
- $1,406
Break-even live
UW: 25.0% down · 7.5% · 30yr · 1.5% tax · 5.0% vac · 8.0% maint · 8.0% mgmt
Financing live
Cash to close
- Down payment
- $34,750
- Closing costs
- $4,170
- Reserves months
- —
- Total cash needed
- —
Loan-product check · same deal, 3 products live
Conventional
25% down · 7.5% · 30yr
- Down + closing
- —
- Monthly P&I
- —
- Monthly cashflow
- —
- DSCR
- —
- Eligible?
- —
Personal DTI + credit; lowest rate.
DSCR
20% down · 8.5% · 30yr
- Down + closing
- —
- Monthly P&I
- —
- Monthly cashflow
- —
- DSCR
- —
- Eligible?
- —
No personal income docs; deal must DSCR.
Hard money
10% down · 12.0% · 12mo
- Down + closing
- —
- Monthly P&I
- —
- Monthly cashflow
- —
- DSCR
- —
- Eligible?
- —
Short-term bridge; refi at stabilization.
Rent comps 22 comps
| Address | Beds | Baths | Sqft | Rent | $/sqft | DOM | Units | Dist |
|---|---|---|---|---|---|---|---|---|
| 610 Daisy St Escondido, CA | 3.0 | 2.0 | 1100 | $3,995 | $3.63 | 1d | 1 | 0.36mi |
| 2520 Wanek Rd Unit B Escondido, CA | 2.0 | 1.5 | 896 | $2,750 | $3.07 | 3d | 1 | 0.47mi |
| 2100 E Grand Ave Escondido, CA | 1.0–2.0 | 1.0 | 832 | $2,500 | $3.00 | 1d | 3 | 0.47mi |
| 151 Gayland St Escondido, CA | 1.0–2.0 | 1.0 | 780 | $2,393 | $3.07 | 1d | 9 | 0.54mi |
| 2460 Bear Valley Pkwy Escondido, CA | 2.0–3.0 | 2.0 | 1049 | $2,958 | $2.82 | 1d | 4 | 0.55mi |
| 2536 White Oak Pl #2 Escondido, CA | 3.0 | 2.0 | 1039 | $3,500 | $3.37 | 1d | 1 | 0.55mi |
| 521 Sandalwood Pl #8 Escondido, CA | 3.0 | 2.0 | 1095 | $3,000 | $2.74 | 1d | 1 | 0.61mi |
| 512 Sandalwood Pl Escondido, CA | 2.0 | 1.5 | 899 | $2,450 | $2.73 | 10d | 2 | 0.64mi |
| 512 Sandalwood Pl Escondido, CA | 2.0 | 1.5 | 899 | $2,550 | $2.84 | 14d | 1 | 0.64mi |
| 2723 Malibu Pl Escondido, CA | 3.0 | 2.0 | 1204 | $3,400 | $2.82 | 23d | 1 | 0.69mi |
| 1817 E Grand Ave Escondido, CA | 2.0 | 1.5–2.0 | 942 | $2,298 | $2.44 | 1d | 2 | 0.70mi |
| 1817 E Grand Ave Escondido, CA | 2.0 | 1.5–2.0 | 942 | $2,398 | $2.55 | 10d | 2 | 0.70mi |
| 1501 E Grand Ave Escondido, CA | 2.0 | 1.0–2.0 | 718 | $2,418 | $3.37 | 1d | 19 | 1.02mi |
| 1695 Kenora Dr Escondido, CA | 3.0 | 2.0 | 1610 | $4,275 | $2.66 | 1d | 1 | 1.10mi |
| 1316 E Grand Ave Apt 104 Escondido, CA | 2.0 | 2.0 | 965 | $2,695 | $2.79 | 1d | 1 | 1.14mi |
| 1333 E Grand Ave Escondido, CA | 1.0–2.0 | 1.0–2.0 | 914 | $2,800 | $3.06 | 1d | 13 | 1.14mi |
| 1333 E Grand Ave Escondido, CA | 1.0 | 1.0 | 818 | $2,100 | $2.57 | 10d | 17 | 1.14mi |
| 1315 E Grand Ave Escondido, CA | 2.0 | 2.0 | 1120 | $2,400 | $2.14 | 1d | 1 | 1.18mi |
| 1924 Sheridan Ave Escondido, CA | 2.0 | 2.0 | 1228 | $2,695 | $2.19 | 1d | 1 | 1.38mi |
| 1020 E Washington Ave Escondido, CA | 1.0 | 1.0 | 1178 | $1,900 | $1.61 | 1d | 1 | 1.39mi |
| 950 E Washington Ave Escondido, CA | 2.0 | 1.0 | 1200 | $2,750 | $2.29 | 1d | 1 | 1.42mi |
| 505 San Pasqual Valley Rd Escondido, CA | 1.0–2.0 | 1.0–2.5 | 904 | $2,950 | $3.26 | 1d | 1 | 1.48mi |
Listing history 21 events
-
2026-06-18days on market $139,000 Active 53 DOM
-
2026-06-17days on market $139,000 Active 52 DOM
-
2026-06-16days on market $139,000 Active 51 DOM
-
2026-06-15days on market $139,000 Active 50 DOM
-
2026-06-13days on market $139,000 Active 48 DOM
-
2026-06-09days on market $139,000 Active 44 DOM
-
2026-06-08days on market $139,000 Active 43 DOM
-
2026-06-07days on market $139,000 Active 42 DOM
-
2026-06-04days on market $139,000 Active 39 DOM
-
2026-06-03days on market $139,000 Active 38 DOM
-
2026-06-02days on market $139,000 Active 37 DOM
-
2026-06-01days on market $139,000 Active 36 DOM
-
2026-05-31days on market $139,000 Active 35 DOM
-
2026-05-15status Active
-
2026-04-28status Pending Sale
-
2026-03-31$139,000 Active
-
2009-08-03soldstatus $35,000 510-char remark
Show marketing remark (510 chars)
VERY SPACIOUS TWO BEDROOM HOME LOCATED TOWARDS THE BACK OF THE PARK-AWAY FROM VALLEY PARKWAY. EARTHQUAKE BRACING, NEWER CARPET, COPPER PLUMBING & ROOF CHECKED EVERY YEAR. LARGE LIVING ROOM, COZY FAMILY ROOM AND TWO VERY GOOD SIZED BEDROOMS PLUS A CALIFORNIA ROOM. THIS IS A SENIOR PARK WITH A GREAT CLUBHOUSE, POOL, SPA, POOL TABLES, LIBRARY AND COMPUTER ROOM. BUSSTOP IN FRONT. VONS & RALPHS 2 BLOCKS AWAY. RENT INCLUDES WATER, TRASH, SEWER & CABLE. INDOOR PET ON APPROVAL. COME & SEE!
-
2009-03-16price $39,900
-
2009-02-18price $42,000
-
2008-12-17price $49,000
-
2008-10-03$39,900 510-char remark
Show marketing remark (510 chars)
VERY SPACIOUS TWO BEDROOM HOME LOCATED TOWARDS THE BACK OF THE PARK-AWAY FROM VALLEY PARKWAY. EARTHQUAKE BRACING, NEWER CARPET, COPPER PLUMBING & ROOF CHECKED EVERY YEAR. LARGE LIVING ROOM, COZY FAMILY ROOM AND TWO VERY GOOD SIZED BEDROOMS PLUS A CALIFORNIA ROOM. THIS IS A SENIOR PARK WITH A GREAT CLUBHOUSE, POOL, SPA, POOL TABLES, LIBRARY AND COMPUTER ROOM. BUSSTOP IN FRONT. VONS & RALPHS 2 BLOCKS AWAY. RENT INCLUDES WATER, TRASH, SEWER & CABLE. INDOOR PET ON APPROVAL. COME & SEE!
ⓘ Source: listings_history table (triggers on properties + properties_extension) + one-shot
backfill from property_details.listing_events for pre-trigger history.
Tax reassessment forecast CA · Resets to sale price
- Current annual tax
- $335 · $28/mo
- Projected year-2 tax
- $1,056 · $88/mo
- Expected delta
- +$721/yr (+$60/mo · 215.3%)
ⓘ Screening estimate from a state-policy table — verify with the county assessor before closing.
Climate risk First Street
- Flood 1/10 Low FEMA zone X (shaded) · 0% chance over 30 yrs
- Wildfire 7/10 Severe
- Heat 6/10 Major 7 d/yr ≥99°F today · 21 d/yr by 30 yrs out
- Wind 1/10 Low
- Air quality 4/10 Moderate 6 unhealthy d/yr today · 7 by 30 yrs out
Nearby sold comps map
Loading sold comps map…
Walkable amenities ~0.75 mi
Loading nearby amenities…
Taxation est. · year 1
- Rental income
- $33,732
- − Mortgage interest
- −$7,786
- − Property taxes
- −$335
- − Insurance
- −$695
- − Repairs & maintenance
- −$2,699
- − Management
- −$2,699
- − Depreciation
- −$4,044
- Taxable income
- $15,475
- Est. tax owed @ 24.0%
- −$3,714
- After-tax cash flow
- $13,157/yr
For passive investors: Depreciation is non-cash, so a rental often shows a tax loss while cash-flowing — sheltering income. Rental losses are passive: they offset passive income freely, and up to $25,000/yr can offset ordinary (W-2) income if you actively participate and your MAGI is under $100k (phasing out to $0 by $150k); unused losses carry forward. On sale, claimed depreciation is recaptured at up to 25%, and gains may owe capital-gains tax (a 1031 exchange can defer both). Figures are a year-1 estimate at your 24.0% rate — not tax advice; consult a CPA.
Schools (NCES district)
- District
- Escondido Union High
- NCES district ID
- 0612910
- Math proficiency
- 19% ▼ -2.00%
- Reading proficiency
- 56% ▼ -1.00%
- Median HH income
- $55,731
- Composite
- 32.82/100
- National rank
- #5620
- State rank
- #247 of 517 in CA
Livability — Escondido
- Score
- 70/100
- State rank
- #238
- US rank
- #7829
Category grades
Schools grade is shown separately in the Schools card above.
Census & demographics
- Census place
- Escondido, CA
- County
- San Diego County · 3,178,799 people
- City population
- 177,903
- Metro
- San Diego-Chula Vista-Carlsbad, CA
- Population (ZIP)
- 54,113
- Household income
- $93,338
- Rent vs Own
- Severe rent burden
- 1638.0
Population outlook (San Diego County) Hauer SSP2
- Today (2025)
- 3,678,185 people
- By 2030
- 3,856,546 · +4.8%
- By 2040
- 4,171,407 · +13.4%
- By 2050
- 4,421,607 · +20.2%
- By 2075
- 4,831,599 · +31.4%
- By 2100
- 4,832,502 · +31.4%
Race, ethnicity, and origin ACS 2023
- Neighborhood character
- Diverse neighborhood (Simpson 0.58)
- Race & ethnicity
- Hispanic / Latino 57% White 32% Two or more races 24% Asian 6% Native American 2% Black 2%
- Hispanic origin (detail)
- Mexican 51% Puerto Rican 1%
- Common ancestry
- Italian 2% Lithuanian 2% Romanian 1%
- Foreign-born
- 30% · Canada, Vietnam, China
- Languages at home
- 54% English-only · Spanish 39% Tagalog/Filipino 2% Vietnamese 2%
Political lean MEDSL · San Diego
- 2024 margin
- D (+16.8) · D 56.9% · R 40.1% · Other 2.9%
- 2008→2024 swing
- +6.6pp toward D · 2008: 10.2pp · 2024: 16.8pp
- All cycles
- 2024: D+16.8 2020: D+22.8 2016: D+17.8 2012: D+5.1 2008: D+10.2
Not yet ingested
- Civics
- —
Market trends
- HPI YoY
- ▼ -768.40%
- Current HPI
- 362.1027
- Rent YoY
- ▲ 2.50%
- Metro
- San Diego-Chula Vista-Carlsbad, CA
- State GDP YoY
- ▲ 3.21%
- F500 in state
- 116
Industry mix (Fortune 500 HQ in CA)
| Industry | F500 HQs | Revenue |
|---|---|---|
| Technology | 27 | $1,492B |
|
||
| Financial Services | 3 | $174B |
|
||
| Retail | 3 | $44B |
|
||
| Insurance | 3 | $26B |
|
||
| Media / Entertainment | 2 | $115B |
|
||
| Pharmaceuticals / Biotech | 2 | $62B |
|
||
Price history
+248.4% since first listed8 events — show timeline
- 2026-05-15 Relisted — CRMLS
- 2026-04-28 Pending — CRMLS
- 2026-03-31 Listed $139,000 CRMLS
- 2009-08-03 Sold (MLS) $35,000 CRMLS
- 2009-03-16 Price Changed $39,900 SDMLS
- 2009-02-18 Price Changed $42,000 SDMLS
- 2008-12-17 Price Changed $49,000 SDMLS
- 2008-10-03 Listed $39,900 CRMLS
Property tax history
+5.7%/yrLatest (2013): $335 · +1.7% YoY. Source: county tax records.
Cash-flow waterfall
monthlySold comps — $/sqft
last 12 mo · ≤1 miLoading sold comps…