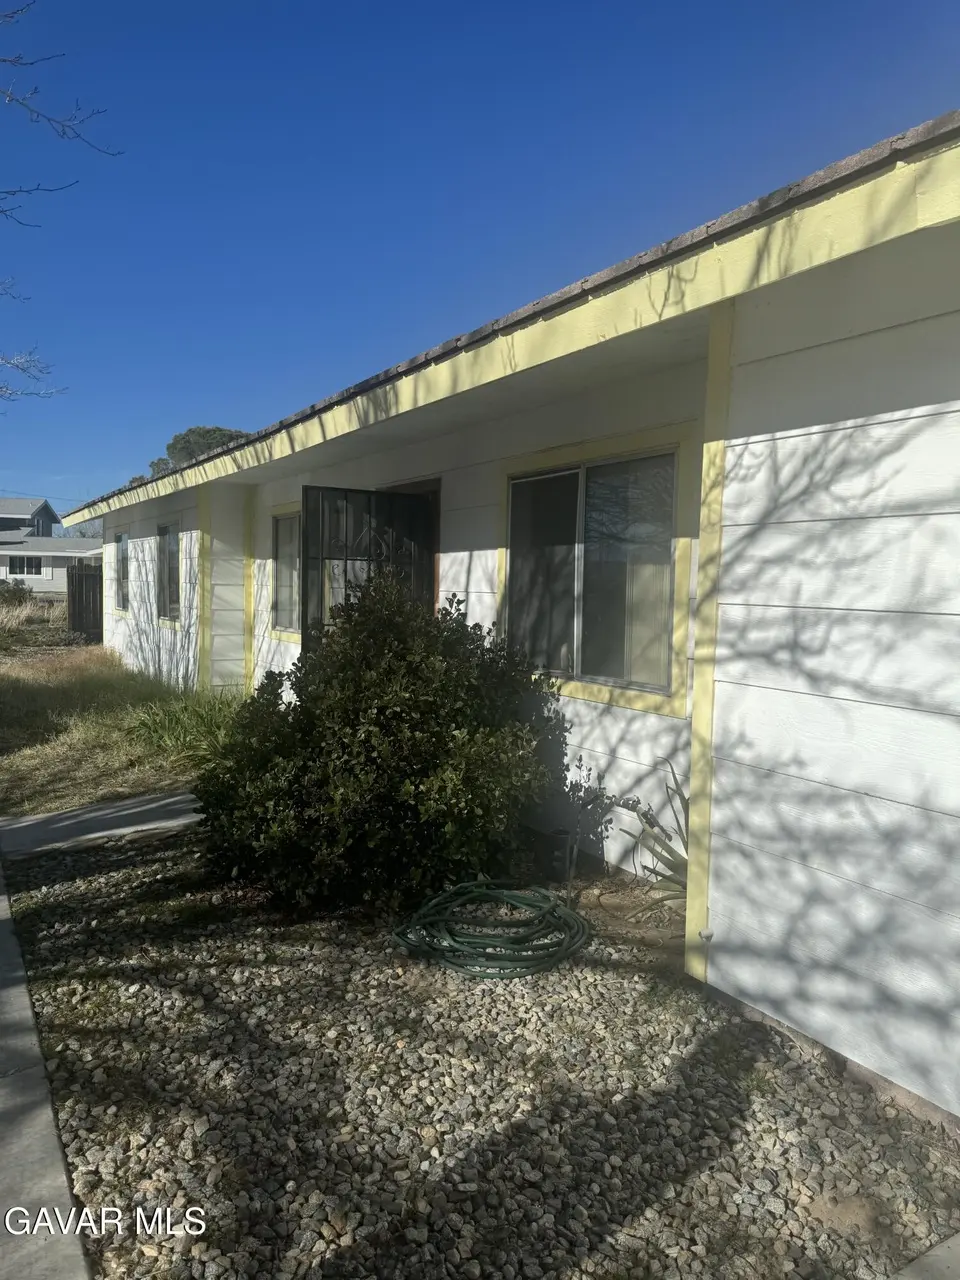
21400 Jupiter Pl Unit 1054-A · California City, CA
Flood risk 1/10 · Minimal
- FEMA flood zone
- X (unshaded)
- Chance of flooding over 30 yrs
- 0.0%
- Est. flood insurance / yr
- $507 – $1,088
Fire risk 1/10 · Minimal
- Est. fire insurance / yr
- $659 – $1,223
Heat risk 8/10 · Major
- Hot days now (above 101°F)
- 5 days/yr
- Hot days in 30 yrs
- 13 days/yr
Wind risk 1/10 · Minimal
- Chance of severe wind over 30 yrs
- —
Air-quality risk 7/10 · Major
- Unhealthy air days now
- 13 days/yr
- Unhealthy air days in 30 yrs
- 15 days/yr
Risk factors via First Street. Map © Google.
Why this score? — see what drove the D grade
The composite is a weighted blend of 9 inputs, each scored 0–100. Each bar is that input's sub-score; the figure is the points it added to the 100-point composite (weight × sub-score).
- ARV discount +10.2/15.0
- Appreciation +10.0/10.0
- Cash flow +8.4/30.0
- Rent growth +3.9/5.0
- 1% rule +2.6/10.0
- DSCR +2.3/10.0
- Livability +2.2/5.0
- Condition / age +2.2/5.0
- Schools +2.1/10.0
$235,000
🖨 Deal sheet (PDF) 📄 Offer letter ✓ Due diligence
Listing remarks
Opportunity Knocks with this great home in California City! Priced well and waiting for your touch to bring out all this homes full potential. Nice living room of entry with sliding door to back covered patio, 3 bedrooms, full bath in hall, walk in shower in primary bathroom, great size primary bedroom that also has sliding door access to backyard. Kitchen has lots of cabinets & dining space too. 2 car attached garage with laundry hook ups, large vehicle door in front and small vehicle door leading to backyard, enclosed storage room off garage. fenced backyard, RV parking potential on both sides of home. Tiled roof
Key facts
- Sliding door access
- Lots of cabinets
- Covered patio
Tags
Property features AI
Exterior
- Parking: Attached 2-car garage
- Utilities: Public water; Sewer connected; Natural gas available
- Home design: Ranch style; Single-story
- Construction: Tile roof; Wood siding; Concrete slab foundation; Built on a corner lot; Paved streets
- Exterior features: Block and wood fencing; Covered patio; RV access
Interior
- Kitchen: Dishwasher
- Flooring: Carpet; Laminate
- Bathrooms: One full bathroom; One three-quarter bathroom
- Heating & cooling: Central gas heating; Natural gas
- Interior features: Dining area; Storage off garage
- Laundry & utility: Laundry area in garage
Neighborhood map
What this means for you Summary
Snapshot
- This is a 3-bed/2.0-bath single-family listed at $235k. Condition is rated fair.
Deal economics
- At list price, monthly cash flow is $-209 ($-3k/yr) — negative.
- To cash-flow at today's rent, offer at most $205k (12.9% below list).
- To meet the 1% rule (rent ≥ 1% of price), the offer needs to be $179k (23.8% below list).
- Recommended offer: $179k (23.8% below list) — sets the bar for 1% rule.
Location & tenants
- Location reads 44/100 on livability (#1,329 in CA) — a working-class tenant base; expect higher turnover. Strengths: housing A+; Watch: crime F, amenities F, commute F.
- Mojave Unified (town): math 25% / reading 25% proficiency, ranked #411 of 517 in CA (top 80%) — low school quality limits family demand, transient renter base, plan for 1-2y turnover; 76% free/reduced lunch — lower-income household profile, screen leases tightly.
- Zoned schools: Hacienda Elementary (528 students, 92% FRL); California City Middle (501 students, 87% FRL); California City High (655 students, 85% FRL).
- Market conditions: Rents rising fast (+5.5%/yr); 704 active listings in the ZIP; 16 comparable units currently listed for rent nearby; rentals at typical pace (median 21d on market — plan ~3-4 weeks tenant-placement turnaround); 3,244 units permitted in Kern County in 2024 (73 in 5+ unit buildings).
- This rent runs 36% of the median local income ($60k/yr) — at the standard rent-burdened threshold; future hikes will face affordability resistance.
Forward outlook
- In year one you build about $25k of equity ($2k loan paydown + $24k appreciation (10.0% local appreciation)).
- Kern County population projected at +17% by 2050 — long-run rental-demand tailwind backs the buy-and-hold thesis.
- By year 2, paydown + projected appreciation supports a ~$40k cash-out refi (75% LTV) — recoverable capital for the next deal without selling this one.
Negotiation context
- Only 4 days on market — expect competitive offers; lowballing is unlikely to land.
Risks & watch-outs
- Climate carrying-cost: extreme-heat days projected 5→13/yr by 2055 (HVAC capex compounding) — expect insurance premiums to compound above CPI over the hold.
Questions for the listing agent
- What do current leases actually rent for vs. the listed asking? Can we see a recent rent roll and the last 12 months of T-12 income?
- Have any recent inspections been done? Can we get a copy of the seller's disclosures and any deferred-maintenance estimates?
- Is there a deadline driving the sale (1031 exchange, divorce, estate, relocation)? That informs how much negotiation room exists.
- Schools are F-rated, which usually means shorter tenancies and higher turnover. Who's the typical renter profile here, and what's been the actual vacancy rate?
- Crime grade is F in this area — have there been break-ins, vandalism, or insurance claims at this property in the last 3 years? What carrier currently insures it and at what premium?
- The area grade is low — what's the realistic commute time and amenity access for the typical tenant pool here? Any planned neighborhood developments (good or bad) we should know about?
- What's the average days-on-market for RENTAL listings here right now (not sales)? A rising rental-DOM trend means longer vacancies and softer asking-rent achievability than the comps imply.
- What's the recent tenant-quality profile in this submarket — average credit score on applications, eviction rate, late-payment / NSF rate, and stable-employment percentage? A property-management company in the area should have these aggregated.
- How much new for-sale + rental construction is in the pipeline within 1–3 miles? Heavy new supply typically softens prices + rents 12–24 months out; constrained supply supports both.
Investment metrics
- 1% rule
- 0.76% ✗
- Cap rate
- 5.23%
- Cash-on-cash
- -3.81%
- DSCR
- 0.83
- GRM
- 10.9
CMA / ARV
- ARV (on-the-fly)
- $250,096
- Comps found
- 12
Show comp detail 12 sales within ~0.75 mi
| Address | Dist | Beds/Ba | Sqft | Sold | Price | $/sf | Match |
|---|---|---|---|---|---|---|---|
| 21400 Jupiter Pl Unit 1054-A | 0.00mi | 3/2.0 | 1,276 (0%) | 1mo | $155,000 | $121 | 100 |
| 21400 Jupiter Pl | 0.00mi | 3/2.0 | 1,276 (0%) | 1mo | $155,000 | $121 | 100 |
| 11125 Rome Beauty Dr | 0.48mi | 3/2.0 | 1,237 (-3%) | 1mo | $225,000 | $182 | 71 |
| 10945 Rome Beauty Dr | 0.37mi | 4/2.0 (+1) | 1,236 (-3%) | 5mo | $210,000 | $170 | 68 |
| 10621 Applewood Dr | 0.27mi | 3/2.0 | 1,390 (+9%) | 16mo | $272,000 | $196 | 59 |
| 21740 Bancroft Dr | 0.57mi | 3/2.0 | 1,400 (+10%) | 10mo | $290,000 | $207 | 49 |
| 10624 Aspen Ave | 0.49mi | 4/2.0 (+1) | 1,376 (+8%) | 13mo | $275,000 | $200 | 48 |
| 21251 Calhoun Ct | 0.62mi | 3/2.0 | 1,429 (+12%) | 4mo | $330,000 | $231 | 48 |
| 21231 Calhoun Ct | 0.62mi | 3/2.0 | 1,429 (+12%) | 4mo | $331,000 | $232 | 47 |
| 21313 Heather Pl | 0.65mi | 3/2.0 | 1,389 (+9%) | 9mo | $215,000 | $155 | 47 |
| 21241 Calhoun Ct | 0.63mi | 4/2.0 (+1) | 1,429 (+12%) | 2mo | $323,000 | $226 | 44 |
| 21148 Bancroft Ct | 0.70mi | 3/2.0 | 1,152 (-10%) | 14mo | $225,000 | $195 | 40 |
Match score weights: distance 35% · size 25% · config 20% · recency 20%. Top-matched comps best support the ARV.
Projected returns pro-forma
10.0% appreciation · 5.45% rent growth · sell at horizon
- IRR
- 22.3%
- Equity multiple
- 2.81×
- Total profit
- $119,231
- Equity at exit
- $211,707
- IRR
- 20.6%
- Equity multiple
- 6.65×
- Total profit
- $371,770
- Equity at exit
- $456,553
Cash invested: $65,800 (down + closing). Projections, not guarantees.
Landlord ↔ Tenant lean methodology
- Overall (STATE)
- 18 Strongly Tenant-Friendly
- State California
- 18 Strongly Tenant-Friendly · D+13
- County
- — inherits STATE
- City
- — inherits STATE
ZIP-level market 93505
- Home prices YoY
- 13.0%
- Rents YoY
- 5.5%
- Active inventory
- 704
- Price-to-rent
- 10.9×
Monthly cashflow live
- Estimated rent
- $1,791 high interval (Pro) →
- Mortgage (P&I)
- −$1,232
- Tax est. 1.5%
- −$294 /mo · $3,525/yr
- Insurance
- −$98
- HOA
- −$0
- Vacancy / Maint / Mgmt
- −$376
- Net cashflow
- $-209
Break-even live
Sensitivity live
| Price | -10% $-47 | -5% $-128 | +0% $-209 | +5% $-290 | +10% $-371 |
|---|---|---|---|---|---|
| Rent | -10% $-350 | -5% $-280 | +0% $-209 | +5% $-138 | +10% $-67 |
| Rate | -1.0pp $-91 | -0.5pp $-149 | base $-209 | +0.5pp $-270 | +1.0pp $-332 |
UW: 25.0% down · 7.5% · 30yr · 1.5% tax · 5.0% vac · 8.0% maint · 8.0% mgmt
Financing live
Cash to close
- Down payment
- $58,750
- Closing costs
- $7,050
- Reserves months
- —
- Total cash needed
- —
Loan-product check · same deal, 3 products live
Conventional
25% down · 7.5% · 30yr
- Down + closing
- —
- Monthly P&I
- —
- Monthly cashflow
- —
- DSCR
- —
- Eligible?
- —
Personal DTI + credit; lowest rate.
DSCR
20% down · 8.5% · 30yr
- Down + closing
- —
- Monthly P&I
- —
- Monthly cashflow
- —
- DSCR
- —
- Eligible?
- —
No personal income docs; deal must DSCR.
Hard money
10% down · 12.0% · 12mo
- Down + closing
- —
- Monthly P&I
- —
- Monthly cashflow
- —
- DSCR
- —
- Eligible?
- —
Short-term bridge; refi at stabilization.
Rent comps 16 comps
| Address | Beds | Baths | Sqft | Rent | $/sqft | DOM | Units | Dist |
|---|---|---|---|---|---|---|---|---|
| 21601 Randsburg Mojave Rd Unit C California City, CA | 2.0 | 2.0 | 896 | $1,150 | $1.28 | 4d | 1 | 0.28mi |
| 21398 Baldwin Ln California City, CA | 4.0 | 2.0 | 1527 | $2,000 | $1.31 | 4d | 1 | 0.28mi |
| 21306 Bancroft Ct California City, CA | 2.0 | 2.0 | 906 | $1,800 | $1.99 | 5d | 1 | 0.67mi |
| 10193 Evelyn Ave California City, CA | 3.0 | 2.0 | 1616 | $2,150 | $1.33 | 16d | 1 | 0.69mi |
| 21319 Conklin Ct California City, CA | 2.0 | 2.0 | 1816 | $2,200 | $1.21 | 45d | 1 | 0.76mi |
| 21187 Conklin Blvd California City, CA | 3.0 | 2.0 | 1473 | $1,800 | $1.22 | 16d | 1 | 0.78mi |
| 9931 Putter Ct California City, CA | 3.0 | 2.0 | 1445 | $1,675 | $1.16 | 5d | 1 | 0.81mi |
| 9933 N Loop Blvd Unit B California City, CA | 2.0 | 2.0 | 895 | $1,875 | $2.09 | 25d | 1 | 0.82mi |
| 21235 Windsong St California City, CA | 3.0 | 3.0 | 1780 | $2,100 | $1.18 | 25d | 1 | 0.83mi |
| 9848 Sally Ave Unit 2 California City, CA | 2.0 | 1.0 | 980 | $1,495 | $1.53 | 25d | 1 | 0.89mi |
| 9825 N Loop Blvd Unit B California City, CA | 2.0 | 1.0 | 883 | $1,350 | $1.53 | 21d | 1 | 0.93mi |
| 9749 N Loop Blvd California City, CA | 2.0 | 1.0 | 900 | $1,350 | $1.50 | 13d | 1 | 1.00mi |
| 9749 N Loop Blvd California City, CA | 2.0 | 1.0 | 900 | $1,350 | $1.50 | 5d | 1 | 1.00mi |
| 9749 N Loop Blvd California City, CA | 2.0 | 1.0 | 900 | $1,350 | $1.50 | 25d | 1 | 1.00mi |
| 9548 Sally Ave Unit B California City, CA | 3.0 | 2.5 | 1200 | $1,695 | $1.41 | 25d | 1 | 1.22mi |
| 9524 Sally Ave Unit C California City, CA | 2.0 | 1.5 | 1140 | $1,300 | $1.14 | 25d | 1 | 1.27mi |
Listing history 2 events
-
2026-05-08status Pending
-
2026-05-04$235,000 Active
ⓘ Source: listings_history table (triggers on properties + properties_extension) + one-shot
backfill from property_details.listing_events for pre-trigger history.
Climate risk First Street
- Flood 1/10 Low FEMA zone X (unshaded) · 0% chance over 30 yrs
- Wildfire 1/10 Low
- Heat 8/10 Severe 5 d/yr ≥101°F today · 13 d/yr by 30 yrs out
- Wind 1/10 Low
- Air quality 7/10 Severe 13 unhealthy d/yr today · 15 by 30 yrs out
Nearby sold comps map
Loading sold comps map…
Walkable amenities ~0.75 mi
Loading nearby amenities…
Taxation est. · year 1
- Rental income
- $21,495
- − Mortgage interest
- −$13,164
- − Property taxes
- −$3,525
- − Insurance
- −$1,175
- − Repairs & maintenance
- −$1,720
- − Management
- −$1,720
- − Depreciation
- −$6,836
- Taxable loss
- −$6,644
- Est. tax savings @ 24.0%
- +$1,595
- After-tax cash flow
- $-913/yr
For passive investors: Depreciation is non-cash, so a rental often shows a tax loss while cash-flowing — sheltering income. Rental losses are passive: they offset passive income freely, and up to $25,000/yr can offset ordinary (W-2) income if you actively participate and your MAGI is under $100k (phasing out to $0 by $150k); unused losses carry forward. On sale, claimed depreciation is recaptured at up to 25%, and gains may owe capital-gains tax (a 1031 exchange can defer both). Figures are a year-1 estimate at your 24.0% rate — not tax advice; consult a CPA.
Condition & rehab AI · 12 photos
This home requires moderate renovations to update the kitchen and bathrooms, and improve the landscaping. It has a good roof and a fenced backyard, making it a good investment opportunity.
Repairs flagged
- Moderate kitchen cabinets — dated and in need of replacement
- Moderate kitchen appliances — outdated and in need of replacement
- Moderate bathroom fixtures — outdated and in need of replacement
- Minor landscaping — basic landscaping
Value-add opportunities
- Both update kitchen cabinets and appliances — modernizing kitchen will appeal to buyers and renters
- Both update bathroom fixtures — modernizing bathrooms will appeal to buyers and renters
- Both landscaping — improved landscaping will enhance curb appeal and attract more buyers
Renovation cost estimate screening
| Repair item | Severity | Est. cost |
|---|---|---|
| kitchen cabinets · dated and in need of replacement | Moderate | $3,000–15,000 |
| kitchen appliances · outdated and in need of replacement | Moderate | $3,000–15,000 |
| bathroom fixtures · outdated and in need of replacement | Moderate | $3,000–15,000 |
| landscaping · basic landscaping | Minor | $500–3,000 |
| Total estimated repair cost · 4 items | $9,500–48,000 |
Value-add ROI direction
- Both update kitchen cabinets and appliances — modernizing kitchen will appeal to buyers and renters ↑
- Both update bathroom fixtures — modernizing bathrooms will appeal to buyers and renters ↑
- Both landscaping — improved landscaping will enhance curb appeal and attract more buyers ↑
ⓘ Cost ranges are severity-bucket heuristics (US national rule-of-thumb). Get contractor quotes + a written scope before underwriting a rehab budget.
Schools (NCES district)
- District
- Mojave Unified
- NCES district ID
- 0625230
- Math proficiency
- 25% ▲ 11.00%
- Reading proficiency
- 25% ▼ -1.00%
- Median HH income
- $43,017
- Composite
- 21.4/100
- National rank
- #8350
- State rank
- #411 of 517 in CA
Livability — California City
- Score
- 44/100
- State rank
- #1329
- US rank
- #26753
Category grades
Schools grade is shown separately in the Schools card above.
Census & demographics
- Census place
- California City, CA
- County
- Kern County · 710,371 people
- City population
- 14,353
- Metro
- Bakersfield, CA
- Population (ZIP)
- 14,353
- Household income
- $59,827
- Rent vs Own
- Severe rent burden
- 883.0
Population outlook (Kern County) Hauer SSP2
- Today (2025)
- 947,286 people
- By 2030
- 978,984 · +3.3%
- By 2040
- 1,045,018 · +10.3%
- By 2050
- 1,105,232 · +16.7%
- By 2075
- 1,229,538 · +29.8%
- By 2100
- 1,238,059 · +30.7%
Race, ethnicity, and origin ACS 2023
- Neighborhood character
- Highly diverse neighborhood (Simpson 0.70)
- Race & ethnicity
- Hispanic / Latino 40% White 30% Black 22% Two or more races 16% Native American 3% Asian 1%
- Hispanic origin (detail)
- Mexican 29%
- Common ancestry
- Italian 3% Lithuanian 1% Romanian 1%
- Foreign-born
- 13% · Canada, Dominican Republic
- Languages at home
- 68% English-only · Spanish 29%
Political lean MEDSL · Kern
- 2024 margin
- Strong R (+21.1) · D 38.2% · R 59.3% · Other 2.5%
- 2008→2024 swing
- -3.3pp toward R · 2008: -17.8pp · 2024: -21.1pp
- All cycles
- 2024: R+21.1 2020: R+10.2 2016: R+15.0 2012: R+20.9 2008: R+17.8
Not yet ingested
- Civics
- —
Market trends
- HPI YoY
- ▲ 46.32%
- Current HPI
- 402.4192
- Rent YoY
- ▲ 5.45%
- Metro
- Bakersfield, CA
- State GDP YoY
- ▲ 3.21%
- F500 in state
- 116
Industry mix (Fortune 500 HQ in CA)
| Industry | F500 HQs | Revenue |
|---|---|---|
| Technology | 27 | $1,492B |
|
||
| Financial Services | 3 | $174B |
|
||
| Retail | 3 | $44B |
|
||
| Insurance | 3 | $26B |
|
||
| Media / Entertainment | 2 | $115B |
|
||
| Pharmaceuticals / Biotech | 2 | $62B |
|
||
Price history
2 events — show timeline
- 2026-05-08 Pending — AVMLS
- 2026-05-04 Listed $235,000 AVMLS
Cash-flow waterfall
monthlySold comps — $/sqft
last 12 mo · ≤1 miLoading sold comps…