180 Grace Chapel Rd #234 · Blue Eye, MO
Flood risk 1/10 · Minimal
- FEMA flood zone
- X (unshaded)
- Chance of flooding over 30 yrs
- 0.0%
- Est. flood insurance / yr
- $507 – $1,088
Fire risk 3/10 · Minor
- Est. fire insurance / yr
- $1,054 – $1,958
Heat risk 4/10 · Minor
- Hot days now (above 104°F)
- 7 days/yr
- Hot days in 30 yrs
- 20 days/yr
Wind risk 2/10 · Minimal
- Chance of severe wind over 30 yrs
- 1.0%
Air-quality risk 2/10 · Minimal
- Unhealthy air days now
- 0 days/yr
- Unhealthy air days in 30 yrs
- 1 days/yr
Risk factors via First Street. Map © Google.
Why this score? — see what drove the B- grade
The composite is a weighted blend of 9 inputs, each scored 0–100. Each bar is that input's sub-score; the figure is the points it added to the 100-point composite (weight × sub-score).
- Cash flow +26.6/30.0
- DSCR +9.1/10.0
- 1% rule +7.7/10.0
- ARV discount +7.5/15.0
- Appreciation +6.3/10.0
- Schools +3.7/10.0
- Livability +3.1/5.0
- Rent growth +2.5/5.0
- Condition / age +2.5/5.0
$129,900
🖨 Deal sheet (PDF) 📄 Offer letter ✓ Due diligence
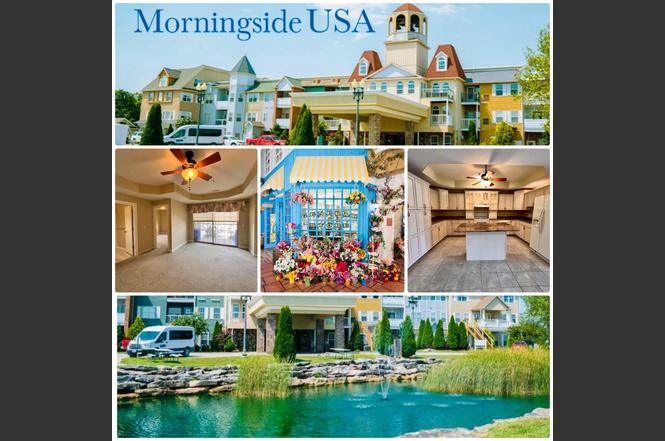
Listing remarks
Discover the perfect balance of practical luxury and community in this Morningside gem. The kitchen is a true showstopper, featuring full pull-out drawers for optimal organization and a beautifully illuminated dish cabinet above the stove. Granite countertops and included appliances enhance the cooking experience. This 2-bedroom (plus non-conforming 3rd bedroom/office), 2-bathroom unit offers low-maintenance living with elevator access and a vibrant community atmosphere. On-site amenities include a hair salon, general store, and restaurant. Enjoy spectacular Ozark sunsets from your private covered deck. Conveniently located near Kimberling City's outdoor attractions, this property is ideal
Key facts
- On-site amenities
- Granite countertops
- Elevator access
Tags
Neighborhood map
What this means for you Summary
Snapshot
- This is a 3-bed/2.0-bath condo listed at $130k.
Deal economics
- At list price, monthly cash flow is $346 ($4k/yr) — positive.
- The deal already cash-flows at list — no discount required.
- Meets the 1% rule at list price ($2k rent vs $130k).
- Recommended offer: $114k (12.0% below list) — sets the bar for market timing.
- Cap rate 9.5% vs local median 3.9% in Blue Eye — top-decile yield for the area; either an underpriced asset or a hidden risk that comps aren't pricing in. Stress-test before assuming the spread holds.
Location & tenants
- Location reads 61/100 on livability (#449 in MO) — a middle-class / working-renter tenant base. Strengths: cost of living A+; Watch: health & safety C-, crime F, amenities F.
- Blue Eye R-V (rural): math 41% / reading 47% proficiency, ranked #107 of 324 in MO (top 33%) — families likely to look elsewhere, expect single-tenant / working-renter base with shorter leases.
- Zoned schools: Blue Eye Elem. (math 37% / reading 47%, grade F, #481 of 1,115 statewide, top 46%, 198 students, 48% FRL); Blue Eye Middle (math 42% / reading 42%, grade D-, #149 of 391 statewide, top 41%, 170 students, 51% FRL); Blue Eye High (math 54% / reading 64%, grade C+, #35 of 521 statewide, top 8%, 178 students, 42% FRL) — zoned schools at 47% FRL track the district average.
- Market conditions: 91 active listings in the ZIP; 191 units permitted in Stone County in 2024 (0 in 5+ unit buildings).
Forward outlook
- In year one you build about $4k of equity ($898 loan paydown + $3k appreciation (2.6% local appreciation)).
- Stone County population projected at -30% by 2050 — secular population decline; favor cash flow + early exit over multi-decade hold.
- At projected returns (2.6% appreciation + 3.0% rent growth), your $36k cash investment doubles in ~4 years — after that, you're playing with house money.
- By year 8, paydown + projected appreciation supports a ~$32k cash-out refi (75% LTV) — recoverable capital for the next deal without selling this one.
Negotiation context
- It's been on market 329 days — a 12% lower offer ($114k) is reasonable based on typical stale-listing flexibility.
- 2 sale attempts since 2y ago; this cycle's ask has dropped $30k (19%) from the opening price — seller is motivated, your offer sets the floor, not the list.
Questions for the listing agent
- It's been on market 329 days. Have you received any prior offers? Is the seller open to a 12% concession, seller financing, or rate buy-down credit?
- What does the HOA fee cover, when was the last increase, and are there any pending special assessments or reserve-fund shortfalls?
- Any open or pending special assessments — roof, HVAC, plumbing, elevator, façade? What's the per-unit balance and payoff schedule, and is the seller paying it off at close or rolling it to the buyer?
- Why hasn't it sold? Are there any deal-killer items the seller is aware of (foundation, flood, title, zoning, code violations)?
- Is there a deadline driving the sale (1031 exchange, divorce, estate, relocation)? That informs how much negotiation room exists.
- Schools are D-rated, which usually means shorter tenancies and higher turnover. Who's the typical renter profile here, and what's been the actual vacancy rate?
- Crime grade is F in this area — have there been break-ins, vandalism, or insurance claims at this property in the last 3 years? What carrier currently insures it and at what premium?
- What's the average days-on-market for RENTAL listings here right now (not sales)? A rising rental-DOM trend means longer vacancies and softer asking-rent achievability than the comps imply.
- What's the recent tenant-quality profile in this submarket — average credit score on applications, eviction rate, late-payment / NSF rate, and stable-employment percentage? A property-management company in the area should have these aggregated.
- How much new apartment / multifamily construction is in the pipeline within 1–3 miles? Heavy new supply (>2% of stock underway) typically softens rents 12–24 months out; light construction supports rent growth.
Investment metrics
- 1% rule
- 1.27% ✓
- Cap rate
- 9.49%
- Cash-on-cash
- 11.41%
- DSCR
- 1.51
- GRM
- 6.6
CMA / ARV
No comps found within radius.
Projected returns pro-forma
2.63% appreciation · 3.0% rent growth · sell at horizon
- IRR
- 17.3%
- Equity multiple
- 1.97×
- Total profit
- $35,235
- Equity at exit
- $55,756
- IRR
- 19.1%
- Equity multiple
- 3.69×
- Total profit
- $97,828
- Equity at exit
- $83,919
Cash invested: $36,372 (down + closing). Projections, not guarantees.
Landlord ↔ Tenant lean methodology
- Overall (STATE)
- 81 Strongly Landlord-Friendly
- State Missouri
- 81 Strongly Landlord-Friendly · R+10
- County
- — inherits STATE
- City
- — inherits STATE
ZIP-level market 65611
- Home prices YoY
- 1.3%
- Active inventory
- 91
- Price-to-rent
- 6.6×
Monthly cashflow live
- Estimated rent
- $1,651 medium interval (Pro) →
- Mortgage (P&I)
- −$681
- Tax from tax record
- −$73 /mo · $877/yr
- Insurance
- −$54
- HOA
- −$150
- Vacancy / Maint / Mgmt
- −$347
- Net cashflow
- $346
Break-even live
Sensitivity live
| Price | -10% $419 | -5% $382 | +0% $346 | +5% $309 | +10% $272 |
|---|---|---|---|---|---|
| Rent | -10% $215 | -5% $280 | +0% $346 | +5% $411 | +10% $476 |
| Rate | -1.0pp $411 | -0.5pp $379 | base $346 | +0.5pp $312 | +1.0pp $278 |
UW: 25.0% down · 7.5% · 30yr · 1.5% tax · 5.0% vac · 8.0% maint · 8.0% mgmt
Financing live
Cash to close
- Down payment
- $32,475
- Closing costs
- $3,897
- Reserves months
- —
- Total cash needed
- —
Loan-product check · same deal, 3 products live
Conventional
25% down · 7.5% · 30yr
- Down + closing
- —
- Monthly P&I
- —
- Monthly cashflow
- —
- DSCR
- —
- Eligible?
- —
Personal DTI + credit; lowest rate.
DSCR
20% down · 8.5% · 30yr
- Down + closing
- —
- Monthly P&I
- —
- Monthly cashflow
- —
- DSCR
- —
- Eligible?
- —
No personal income docs; deal must DSCR.
Hard money
10% down · 12.0% · 12mo
- Down + closing
- —
- Monthly P&I
- —
- Monthly cashflow
- —
- DSCR
- —
- Eligible?
- —
Short-term bridge; refi at stabilization.
HOA detail condo
- Monthly dues
- $150 · $1,800/yr
- Assessments
- None detected in remarks — confirm with the listing agent.
Listing history 10 events
-
2026-02-04status Pending
-
2026-01-09price $129,900
-
2025-11-10price $140,000
-
2025-06-20price $155,000
-
2025-03-11$160,000 Active
-
2024-12-11price $160,000
-
2024-08-16price $175,000
-
2024-06-07price $180,000
-
2024-03-04$199,900 Active
-
2012-02-09soldstatus
ⓘ Source: listings_history table (triggers on properties + properties_extension) + one-shot
backfill from property_details.listing_events for pre-trigger history.
Tax reassessment forecast MO · Resets to sale price
- Current annual tax
- $877 · $73/mo
- Projected year-2 tax
- $1,260 · $105/mo
- Expected delta
- +$383/yr (+$32/mo · 43.7%)
ⓘ Screening estimate from a state-policy table — verify with the county assessor before closing.
Climate risk First Street
- Flood 1/10 Low FEMA zone X (unshaded) · 0% chance over 30 yrs
- Wildfire 3/10 Moderate
- Heat 4/10 Moderate 7 d/yr ≥104°F today · 20 d/yr by 30 yrs out
- Wind 2/10 Low 100% chance of damaging wind over 30 yrs
- Air quality 2/10 Low 0 unhealthy d/yr today · 1 by 30 yrs out
Nearby sold comps map
Loading sold comps map…
Walkable amenities ~0.75 mi
Loading nearby amenities…
Taxation est. · year 1
- Rental income
- $19,809
- − Mortgage interest
- −$7,276
- − Property taxes
- −$877
- − Insurance
- −$650
- − Repairs & maintenance
- −$1,585
- − Management
- −$1,585
- − HOA
- −$1,800
- − Depreciation
- −$3,779
- Taxable income
- $2,258
- Est. tax owed @ 24.0%
- −$542
- After-tax cash flow
- $3,606/yr
For passive investors: Depreciation is non-cash, so a rental often shows a tax loss while cash-flowing — sheltering income. Rental losses are passive: they offset passive income freely, and up to $25,000/yr can offset ordinary (W-2) income if you actively participate and your MAGI is under $100k (phasing out to $0 by $150k); unused losses carry forward. On sale, claimed depreciation is recaptured at up to 25%, and gains may owe capital-gains tax (a 1031 exchange can defer both). Figures are a year-1 estimate at your 24.0% rate — not tax advice; consult a CPA.
Schools (NCES district)
- District
- Blue Eye R-V
- NCES district ID
- 2905280
- Math proficiency
- 41% ▲ 3.00%
- Reading proficiency
- 47% ▼ -5.00%
- Median HH income
- $42,591
- Composite
- 37.08/100
- National rank
- #4500
- State rank
- #107 of 324 in MO
Livability — Blue Eye
- Score
- 61/100
- State rank
- #449
- US rank
- #18289
Category grades
Schools grade is shown separately in the Schools card above.
Census & demographics
- Census place
- Blue Eye, MO
- Population (ZIP)
- 1,784
Population outlook (Stone County) Hauer SSP2
- Today (2025)
- 28,147 people
- By 2030
- 26,405 · -6.2%
- By 2040
- 22,762 · -19.1%
- By 2050
- 19,706 · -30.0%
- By 2075
- 14,742 · -47.6%
- By 2100
- 10,832 · -61.5%
Race, ethnicity, and origin ACS 2023
- Neighborhood character
- Predominantly White (96%)
- Race & ethnicity
- White 96% Two or more races 1%
- Common ancestry
- Lithuanian 6% Romanian 4% Slovak 2%
- Foreign-born
- 1% · Canada
Political lean MEDSL · Stone
- 2024 margin
- Solid R (+61.4) · D 18.9% · R 80.3%
- 2008→2024 swing
- -24.1pp toward R · 2008: -37.3pp · 2024: -61.4pp
- All cycles
- 2024: R+61.4 2020: R+61.1 2016: R+62.1 2012: R+49.2 2008: R+37.3
Not yet ingested
- Civics
- —
Market trends
- HPI YoY
- ▲ 2.63%
- Current HPI
- 204.4936
- Rent YoY
- —
- Metro
- —
- State GDP YoY
- ▲ 1.84%
- F500 in state
- 20
Industry mix (Fortune 500 HQ in MO)
| Industry | F500 HQs | Revenue |
|---|---|---|
| Healthcare | 1 | $163B |
|
||
| Insurance | 1 | $21B |
|
||
| Industrial Technology | 1 | $17B |
|
||
| Retail | 1 | $16B |
|
||
| Industrial Distribution | 1 | $10B |
|
||
| Utilities | 1 | $9B |
|
||
Price history
-35.0% since first listed10 events — show timeline
- 2026-02-04 Pending — SOMO
- 2026-01-09 Price Changed $129,900 SOMO
- 2025-11-10 Price Changed $140,000 SOMO
- 2025-06-20 Price Changed $155,000 SOMO
- 2025-03-11 Listed $160,000 SOMO
- 2024-12-11 Price Changed $160,000 SOMO
- 2024-08-16 Price Changed $175,000 SOMO
- 2024-06-07 Price Changed $180,000 SOMO
- 2024-03-04 Listed $199,900 SOMO
- 2012-02-09 Sold (Public Records) — Public Records
Property tax history
-0.8%/yrLatest (2025): $877 · +1.2% YoY. Source: county tax records.
Cash-flow waterfall
monthlySold comps — $/sqft
last 12 mo · ≤1 miLoading sold comps…