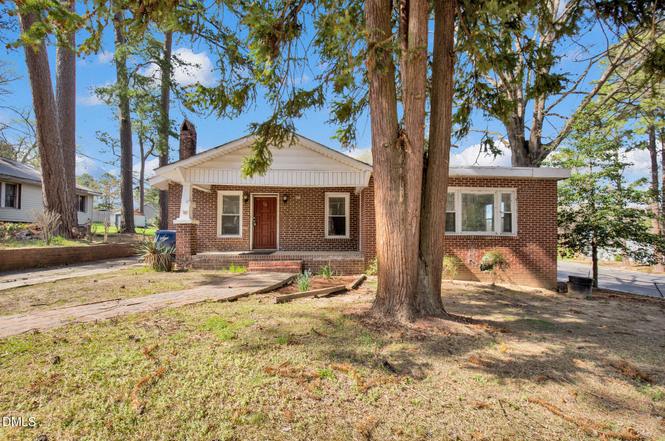
113 Austin St · Sanford, NC
Flood risk 9/10 · Severe
- FEMA flood zone
- X (unshaded)
- Chance of flooding over 30 yrs
- 0.99%
- Est. flood insurance / yr
- $507 – $1,088
Fire risk 2/10 · Minimal
- Est. fire insurance / yr
- $906 – $1,684
Heat risk 6/10 · Moderate
- Hot days now (above 105°F)
- 7 days/yr
- Hot days in 30 yrs
- 17 days/yr
Wind risk 6/10 · Moderate
- Chance of severe wind over 30 yrs
- 59.0%
Air-quality risk 2/10 · Minimal
- Unhealthy air days now
- 1 days/yr
- Unhealthy air days in 30 yrs
- 1 days/yr
Risk factors via First Street. Map © Google.
Why this score? — see what drove the B- grade
The composite is a weighted blend of 9 inputs, each scored 0–100. Each bar is that input's sub-score; the figure is the points it added to the 100-point composite (weight × sub-score).
- Cash flow +24.4/30.0
- ARV discount +15.0/15.0
- DSCR +7.9/10.0
- 1% rule +5.8/10.0
- Rent growth +3.7/5.0
- Livability +3.6/5.0
- Schools +3.0/10.0
- Condition / age +2.5/5.0
- Appreciation +0.0/10.0
$162,000
🖨 Deal sheet (PDF) 📄 Offer letter ✓ Due diligence
Listing remarks
Built in 1925, this charming Sanford home offers over 1,600 square feet of living space and a unique opportunity to update and personalize a property full of character. The home features 2 bedrooms, 1 bathroom, office space, and an additional study, providing flexible options for work, hobbies, or additional living space. Large living areas create an open feel and offer great potential for renovation or customization. Situated on a corner lot in the heart of Sanford, the property provides convenient access to downtown amenities, shopping, dining, and major highways for an easy commute to surrounding areas. This property presents an opportunity for buyers with vision who are looking to resto
Key facts
- 0.29 acre lot
- 2 parking spots
- Built 1925
Property features AI
Finance
- Other: Lot size approximately 0.29 acres
- HOA & community: No association
Exterior
- Parking: Open parking with 2 spaces
- Utilities: Public water; Public sewer; Electricity connected; Natural gas connected
- Home design: Single-story house; Property condition: Fixer; Zoned UN-6
- Construction: Brick construction; Shingle roof; Other foundation; Built as house
- Exterior features: Front porch
Interior
- Bedrooms: 2 bedrooms (both on the main level)
- Flooring: Laminate; Wood
- Bathrooms: 1 full bathroom
- Heating & cooling: Heating present (type: Other); Cooling present (type: Other)
- Interior features: Laminate and wood flooring; Basement with exterior entry
Neighborhood map
What this means for you Summary
Snapshot
- This is a 3-bed/2.0-bath single-family listed at $162k.
Deal economics
- At list price, monthly cash flow is $263 ($3k/yr) — positive.
- The deal already cash-flows at list — no discount required.
- Meets the 1% rule at list price ($2k rent vs $162k).
- Recommended offer: $147k (9.0% below list) — sets the bar for market timing.
- Cap rate 8.7% vs local median 3.6% in Sanford — top-decile yield for the area; either an underpriced asset or a hidden risk that comps aren't pricing in. Stress-test before assuming the spread holds.
Location & tenants
- Location reads 72/100 on livability (#92 in NC) — a middle-class / working-renter tenant base. Strengths: cost of living A+, housing A+, health & safety A+; Watch: employment D, crime D-, commute F.
- Lee County Schools (rural): math 31% / reading 39% proficiency, ranked #131 of 178 in NC (top 74%) — families likely to look elsewhere, expect single-tenant / working-renter base with shorter leases.
- Zoned schools: Tramway Elementary (math 45% / reading 47%, grade D-, #551 of 1,410 statewide, top 40%, 545 students, 47% FRL); West Lee Middle (math 25% / reading 39%, grade F, #317 of 475 statewide, top 68%, 607 students, 70% FRL); Lee County High (math 39% / reading 44%, grade F, #381 of 535 statewide, top 72%, 1,508 students, 60% FRL) — zoned schools at 59% FRL track the district average.
- Market conditions: Rents rising fast (+4.7%/yr); 528 active listings in the ZIP; 1 comparable units currently listed for rent nearby; 602 units permitted in Lee County in 2024 (0 in 5+ unit buildings).
- This rent runs 34% of the median local income ($61k/yr) — at the standard rent-burdened threshold; future hikes will face affordability resistance.
Forward outlook
- Local home prices are declining (-3.0%/yr); year-one equity from $1k of loan paydown is wiped out by about $5k of value loss. Plan a longer hold.
- Lee County population projected at +8% by 2050 — modest demand growth; plan on rents tracking national, not racing it.
Negotiation context
- It's been on market 94 days — a 9% lower offer ($147k) is reasonable based on typical stale-listing flexibility.
- 2 sale attempts with the ask held roughly flat each time — persistent listings suggest the price (not the market) is what's stuck; bring a comps-based counter.
Risks & watch-outs
- Watch-outs: flood insurance adds $66/mo; built in 1925 — expect roof / HVAC / electrical / plumbing capex.
- Climate carrying-cost: severe flood risk; major wind risk, 59% chance of damaging wind over 30y; extreme-heat days projected 7→17/yr by 2055 (HVAC capex compounding) — expect insurance premiums to compound above CPI over the hold.
Questions for the listing agent
- It's been on market 94 days. Have you received any prior offers? Is the seller open to a 9% concession, seller financing, or rate buy-down credit?
- Built in 1925 — when were the roof, HVAC, electrical panel, plumbing, and water heater last replaced?
- What's the actual annual flood-insurance premium (NFIP or private), and is the property in a SFHA with mandatory coverage?
- Why hasn't it sold? Are there any deal-killer items the seller is aware of (foundation, flood, title, zoning, code violations)?
- Is there a deadline driving the sale (1031 exchange, divorce, estate, relocation)? That informs how much negotiation room exists.
- Schools are F-rated, which usually means shorter tenancies and higher turnover. Who's the typical renter profile here, and what's been the actual vacancy rate?
- Crime grade is D in this area — have there been break-ins, vandalism, or insurance claims at this property in the last 3 years? What carrier currently insures it and at what premium?
- What's the average days-on-market for RENTAL listings here right now (not sales)? A rising rental-DOM trend means longer vacancies and softer asking-rent achievability than the comps imply.
- What's the recent tenant-quality profile in this submarket — average credit score on applications, eviction rate, late-payment / NSF rate, and stable-employment percentage? A property-management company in the area should have these aggregated.
- How much new for-sale + rental construction is in the pipeline within 1–3 miles? Heavy new supply typically softens prices + rents 12–24 months out; constrained supply supports both.
Investment metrics
- 1% rule
- 1.08% ✓
- Cap rate
- 8.73%
- Cash-on-cash
- 8.71%
- DSCR
- 1.39
- GRM
- 7.7
CMA / ARV
- ARV (on-the-fly)
- $230,136
- Comps found
- 3
Show comp detail 3 sales within ~0.75 mi
| Address | Dist | Beds/Ba | Sqft | Sold | Price | $/sf | Match |
|---|---|---|---|---|---|---|---|
| 220 Simmons St | 0.25mi | 3/2.0 | 1,382 (+3%) | 20mo | $250,000 | $181 | 67 |
| 506 S 7th St | 0.36mi | 3/1.0 | 1,301 (-3%) | 20mo | $189,900 | $146 | 58 |
| 1201 Bland Cir | 0.73mi | 3/2.0 | 1,189 (-11%) | 20mo | $205,000 | $172 | 31 |
Match score weights: distance 35% · size 25% · config 20% · recency 20%. Top-matched comps best support the ARV.
Projected returns pro-forma
-3.0% appreciation · 4.66% rent growth · sell at horizon
- IRR
- -3.8%
- Equity multiple
- 0.86×
- Total profit
- $-6,528
- Equity at exit
- $24,155
- IRR
- 7.7%
- Equity multiple
- 1.63×
- Total profit
- $28,560
- Equity at exit
- $14,007
Cash invested: $45,360 (down + closing). Projections, not guarantees.
Landlord ↔ Tenant lean methodology
- Overall (STATE)
- 85 Strongly Landlord-Friendly
- State North Carolina
- 85 Strongly Landlord-Friendly · R+3
- County
- — inherits STATE
- City
- — inherits STATE
ZIP-level market 27330
- Home prices YoY
- -19.4%
- Rents YoY
- 4.7%
- Active inventory
- 528
- Price-to-rent
- 7.7×
Monthly cashflow live
- Estimated rent
- $1,748 medium interval (Pro) →
- Mortgage (P&I)
- −$850
- Tax from tax record
- −$135 /mo · $1,618/yr
- Insurance
- −$68
- Flood insurance flood zone
- −$66 /mo · $798/yr
- HOA
- −$0
- Vacancy / Maint / Mgmt
- −$367
- Net cashflow
- $263
Break-even live
Sensitivity live
| Price | -10% $354 | -5% $309 | +0% $263 | +5% $217 | +10% $171 |
|---|---|---|---|---|---|
| Rent | -10% $125 | -5% $194 | +0% $263 | +5% $332 | +10% $401 |
| Rate | -1.0pp $344 | -0.5pp $304 | base $263 | +0.5pp $221 | +1.0pp $178 |
UW: 25.0% down · 7.5% · 30yr · 1.5% tax · 5.0% vac · 8.0% maint · 8.0% mgmt
Financing live
Cash to close
- Down payment
- $40,500
- Closing costs
- $4,860
- Reserves months
- —
- Total cash needed
- —
Loan-product check · same deal, 3 products live
Conventional
25% down · 7.5% · 30yr
- Down + closing
- —
- Monthly P&I
- —
- Monthly cashflow
- —
- DSCR
- —
- Eligible?
- —
Personal DTI + credit; lowest rate.
DSCR
20% down · 8.5% · 30yr
- Down + closing
- —
- Monthly P&I
- —
- Monthly cashflow
- —
- DSCR
- —
- Eligible?
- —
No personal income docs; deal must DSCR.
Hard money
10% down · 12.0% · 12mo
- Down + closing
- —
- Monthly P&I
- —
- Monthly cashflow
- —
- DSCR
- —
- Eligible?
- —
Short-term bridge; refi at stabilization.
Rent comps 1 comps
| Address | Beds | Baths | Sqft | Rent | $/sqft | DOM | Units | Dist |
|---|---|---|---|---|---|---|---|---|
| 502 Ryan Ave Sanford, NC | 3.0–4.0 | 1.0 | 1060 | $1,175 | $1.11 | 25d | 1 | 0.54mi |
Listing history 21 events
-
2026-06-21days on market $162,000 Active 94 DOM
-
2026-06-19days on market $162,000 Active 92 DOM
-
2026-06-18days on market $162,000 Active 91 DOM
-
2026-06-17days on market $162,000 Active 90 DOM
-
2026-06-16days on market $162,000 Active 89 DOM
-
2026-06-15days on market $162,000 Active 88 DOM
-
2026-06-14days on market $162,000 Active 86 DOM
-
2026-06-13days on market $162,000 Active 85 DOM
-
2026-06-10days on market $162,000 Active 83 DOM
-
2026-06-09days on market $162,000 Active 82 DOM
-
2026-06-08days on market $162,000 Active 81 DOM
-
2026-06-07days on market $162,000 Active 80 DOM
-
2026-06-05days on market $162,000 Active 77 DOM
-
2026-06-03days on market $162,000 Active 76 DOM
-
2026-06-02days on market $162,000 Active 75 DOM
-
2026-06-01days on market $162,000 Active 74 DOM
-
2026-05-31days on market $162,000 Active 73 DOM
-
2026-05-30days on market $162,000 Active 72 DOM
-
2026-04-24status Active
-
2026-04-15status Pending
-
2026-03-11$162,000 Active
ⓘ Source: listings_history table (triggers on properties + properties_extension) + one-shot
backfill from property_details.listing_events for pre-trigger history.
Tax reassessment forecast NC · Resets to sale price
- Current annual tax
- $1,618 · $135/mo
- Projected year-2 tax
- $1,618 · $135/mo
- Expected delta
- $0/yr ($0/mo · 0.0%)
ⓘ Screening estimate from a state-policy table — verify with the county assessor before closing.
Climate risk First Street
- Flood 9/10 Extreme FEMA zone X (unshaded) · 99% chance over 30 yrs
- Wildfire 2/10 Low
- Heat 6/10 Major 7 d/yr ≥105°F today · 17 d/yr by 30 yrs out
- Wind 6/10 Major 59% chance of damaging wind over 30 yrs
- Air quality 2/10 Low 1 unhealthy d/yr today · 1 by 30 yrs out
Nearby sold comps map
Loading sold comps map…
Walkable amenities ~0.75 mi
Loading nearby amenities…
Taxation est. · year 1
- Rental income
- $20,977
- − Mortgage interest
- −$9,075
- − Property taxes
- −$1,618
- − Insurance
- −$1,607
- − Repairs & maintenance
- −$1,678
- − Management
- −$1,678
- − Depreciation
- −$4,713
- Taxable income
- $608
- Est. tax owed @ 24.0%
- −$146
- After-tax cash flow
- $3,006/yr
For passive investors: Depreciation is non-cash, so a rental often shows a tax loss while cash-flowing — sheltering income. Rental losses are passive: they offset passive income freely, and up to $25,000/yr can offset ordinary (W-2) income if you actively participate and your MAGI is under $100k (phasing out to $0 by $150k); unused losses carry forward. On sale, claimed depreciation is recaptured at up to 25%, and gains may owe capital-gains tax (a 1031 exchange can defer both). Figures are a year-1 estimate at your 24.0% rate — not tax advice; consult a CPA.
Schools (NCES district)
- District
- Lee County Schools
- NCES district ID
- 3702560
- Math proficiency
- 31% ▼ -6.00%
- Reading proficiency
- 39% ▬ 0.00%
- Median HH income
- $45,300
- Composite
- 29.87/100
- National rank
- #6403
- State rank
- #131 of 178 in NC
Livability — Sanford
- Score
- 72/100
- State rank
- #92
- US rank
- #6134
Category grades
Schools grade is shown separately in the Schools card above.
Census & demographics
- Census place
- Sanford, NC
- County
- Lee County · 76,725 people
- City population
- 76,725
- Metro
- Sanford, NC
- Population (ZIP)
- 39,778
- Household income
- $61,300
- Rent vs Own
- Severe rent burden
- 928.0
Population outlook (Lee County) Hauer SSP2
- Today (2025)
- 63,008 people
- By 2030
- 64,443 · +2.3%
- By 2040
- 66,898 · +6.2%
- By 2050
- 68,310 · +8.4%
- By 2075
- 70,920 · +12.6%
- By 2100
- 70,402 · +11.7%
Race, ethnicity, and origin ACS 2023
- Neighborhood character
- Diverse neighborhood (Simpson 0.63)
- Race & ethnicity
- White 54% Hispanic / Latino 21% Black 19% Two or more races 10% Asian 1%
- Hispanic origin (detail)
- Mexican 12% Puerto Rican 2%
- Common ancestry
- Slovak 4% Serbian 2% Italian 1%
- Foreign-born
- 10% · Canada
- Languages at home
- 81% English-only · Spanish 17%
Political lean MEDSL · Lee
- 2024 margin
- R (+17.5) · D 40.8% · R 58.3%
- 2008→2024 swing
- -9.1pp toward R · 2008: -8.4pp · 2024: -17.5pp
- All cycles
- 2024: R+17.5 2020: R+14.9 2016: R+13.2 2012: R+10.2 2008: R+8.4
Not yet ingested
- Civics
- —
Market trends
- HPI YoY
- ▼ -72.62%
- Current HPI
- 302.3589
- Rent YoY
- ▲ 4.66%
- Metro
- Sanford, NC
- State GDP YoY
- ▲ 3.28%
- F500 in state
- 26
Industry mix (Fortune 500 HQ in NC)
| Industry | F500 HQs | Revenue |
|---|---|---|
| Financial Services | 2 | $213B |
|
||
| Retail | 2 | $95B |
|
||
| Industrial Conglomerate | 1 | $38B |
|
||
| Metals / Steel | 1 | $35B |
|
||
| Utilities | 1 | $30B |
|
||
| Industrial Machinery | 1 | $19B |
|
||
Price history
3 events — show timeline
- 2026-04-24 Relisted — TMLS
- 2026-04-15 Pending — TMLS
- 2026-03-11 Listed $162,000 TMLS
Property tax history
+4.5%/yrLatest (2025): $1,618 · +1.3% YoY. Source: county tax records.
Cash-flow waterfall
monthlySold comps — $/sqft
last 12 mo · ≤1 miLoading sold comps…