 🏗️ New Construction
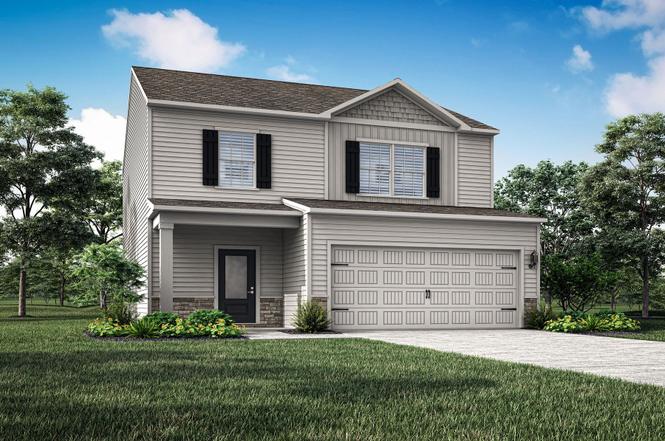
Avery Plan · Richburg, SC
Flood risk No data
- FEMA flood zone
- —
- Chance of flooding over 30 yrs
- —
- Est. flood insurance / yr
- —
Fire risk No data
- Est. fire insurance / yr
- —
Heat risk No data
- Hot days now (above threshold)
- —
- Hot days in 30 yrs
- —
Wind risk No data
- Chance of severe wind over 30 yrs
- —
Air-quality risk No data
- Unhealthy air days now
- —
- Unhealthy air days in 30 yrs
- —
Risk factors via First Street. Map © Google.
Why this score? — see what drove the D- grade
The composite is a weighted blend of 9 inputs, each scored 0–100. Each bar is that input's sub-score; the figure is the points it added to the 100-point composite (weight × sub-score).
- Cash flow +9.3/30.0
- ARV discount +7.5/15.0
- Appreciation +6.5/10.0
- Livability +3.2/5.0
- 1% rule +2.8/10.0
- DSCR +2.6/10.0
- Rent growth +2.5/5.0
- Condition / age +2.5/5.0
- Schools +2.3/10.0
$335,900
🖨 Deal sheet (PDF) 📄 Offer letter ✓ Due diligence
Key facts
- Pantry
- Large center island
- Chef-ready kitchen
Tags
Property features AI
Finance
- Other: Listing is active with a list price of $335,900; Address: 511 Lamorak Pl, Richburg SC 29729
Exterior
- Parking: 2 parking spaces
- Utilities: Electric service; Central air
- Home design: Avery plan (new construction plan); Listed as single-family (plan inventory type)
- Exterior features: Asphalt roof
Interior
- Kitchen: Plan-specific kitchen (Avery)
- Bedrooms: 3 bedrooms
- Bathrooms: 2 full bathrooms and 1 half bathroom
- Heating & cooling: Electric heating; Central air conditioning
- Interior features: Open living area (1800 finished area)
Neighborhood map
What this means for you Summary
Snapshot
- This is a 3-bed/2.5-bath single-family listed at $336k.
Deal economics
- At list price, monthly cash flow is $-266 ($-3k/yr) — negative.
- To cash-flow at today's rent, offer at most $325k (3.2% below list).
- To meet the 1% rule (rent ≥ 1% of price), the offer needs to be $284k (15.3% below list).
- Recommended offer: $284k (15.3% below list) — sets the bar for 1% rule.
Location & tenants
- Location reads 63/100 on livability (#182 in SC) — a middle-class / working-renter tenant base. Strengths: cost of living A+, housing A+; Watch: crime D+, health & safety D+, amenities F.
- Chester 01 (rural): math 23% / reading 34% proficiency, ranked #59 of 80 in SC (top 74%) — low school quality limits family demand, transient renter base, plan for 1-2y turnover; 64% free/reduced lunch — lower-income household profile, screen leases tightly.
- Zoned schools: Lewisville Elementary (math 47% / reading 42%, grade F, #226 of 597 statewide, top 40%, 510 students, 100% FRL); Lewisville Middle (math 25% / reading 37%, grade F, #128 of 229 statewide, top 58%, 416 students, 100% FRL); Lewisville High (math 44% / reading 87%, grade B, #83 of 196 statewide, top 43%, 416 students, 100% FRL) — zoned schools average 100% FRL vs 64% district-wide (36 pts higher); higher-poverty schools than district average — tighter screening recommended.
- Zoned-school proficiency averages 47% at this address vs 28% district-wide (+19 pts) — the actual schools serving this property are materially stronger than the Chester 01 average implies; a family-tenant draw the district grade alone would hide.
- Market conditions: 83 active listings in the ZIP; 269 units permitted in Chester County in 2024 (0 in 5+ unit buildings).
Forward outlook
- In year one you build about $13k of equity ($3k loan paydown + $11k appreciation (3.0% local appreciation)).
- Chester County population projected at -24% by 2050 — secular population decline; favor cash flow + early exit over multi-decade hold.
- By year 3, paydown + projected appreciation supports a ~$33k cash-out refi (75% LTV) — recoverable capital for the next deal without selling this one.
Negotiation context
- It's been on market 240 days — a 12% lower offer ($296k) is reasonable based on typical stale-listing flexibility.
Questions for the listing agent
- What do current leases actually rent for vs. the listed asking? Can we see a recent rent roll and the last 12 months of T-12 income?
- It's been on market 240 days. Have you received any prior offers? Is the seller open to a 15% concession, seller financing, or rate buy-down credit?
- Why hasn't it sold? Are there any deal-killer items the seller is aware of (foundation, flood, title, zoning, code violations)?
- Is there a deadline driving the sale (1031 exchange, divorce, estate, relocation)? That informs how much negotiation room exists.
- Schools are D-rated, which usually means shorter tenancies and higher turnover. Who's the typical renter profile here, and what's been the actual vacancy rate?
- Crime grade is D in this area — have there been break-ins, vandalism, or insurance claims at this property in the last 3 years? What carrier currently insures it and at what premium?
- The area grade is low — what's the realistic commute time and amenity access for the typical tenant pool here? Any planned neighborhood developments (good or bad) we should know about?
- What's the average days-on-market for RENTAL listings here right now (not sales)? A rising rental-DOM trend means longer vacancies and softer asking-rent achievability than the comps imply.
- What's the recent tenant-quality profile in this submarket — average credit score on applications, eviction rate, late-payment / NSF rate, and stable-employment percentage? A property-management company in the area should have these aggregated.
- How much new for-sale + rental construction is in the pipeline within 1–3 miles? Heavy new supply typically softens prices + rents 12–24 months out; constrained supply supports both.
Investment metrics
- 1% rule
- 0.78% ✗
- Cap rate
- 5.42%
- Cash-on-cash
- -3.13%
- DSCR
- 0.86
- GRM
- 10.7
CMA / ARV
- ARV (on-the-fly)
- $363,600
- Comps found
- 12
Show comp detail 12 sales within ~0.75 mi
| Address | Dist | Beds/Ba | Sqft | Sold | Price | $/sf | Match |
|---|---|---|---|---|---|---|---|
| 811 Constantine Rd | 0.09mi | 3/2.5 | 1,800 (0%) | 4mo | $295,000 | $164 | 92 |
| 709 Daniel Ln | 0.05mi | 3/2.5 | 1,717 (-5%) | 1mo | $287,500 | $167 | 89 |
| 641 Lamorak Pl | 0.42mi | 4/2.5 (+1) | 1,800 (0%) | 2mo | $320,000 | $178 | 74 |
| 1106 Elyan St | 0.62mi | 3/2.5 | 1,700 (-6%) | 0mo | $327,900 | $193 | 61 |
| 701 Lamorak Pl | 0.62mi | 3/2.5 | 1,700 (-6%) | 2mo | $323,900 | $191 | 60 |
| 1113 Elyan St | 0.66mi | 3/2.5 | 1,700 (-6%) | 2mo | $325,900 | $192 | 59 |
| 1104 Elyan St | 0.61mi | 3/2.0 | 1,552 (-14%) | 2mo | $325,900 | $210 | 45 |
| 1115 Elyan St | 0.66mi | 3/2.0 | 1,552 (-14%) | 3mo | $315,900 | $204 | 42 |
| 1109 Elyan St | 0.64mi | 3/2.0 | 1,552 (-14%) | 4mo | $315,900 | $204 | 42 |
| 1114 Elyan St | 0.64mi | 3/2.0 | 1,552 (-14%) | 5mo | $313,900 | $202 | 41 |
| 1120 Elyan St | 0.66mi | 3/2.0 | 1,552 (-14%) | 4mo | $313,900 | $202 | 40 |
| 1124 Elyan St | 0.68mi | 3/2.0 | 1,552 (-14%) | 5mo | $313,900 | $202 | 39 |
Match score weights: distance 35% · size 25% · config 20% · recency 20%. Top-matched comps best support the ARV.
Projected returns pro-forma
2.99% appreciation · 3.0% rent growth · sell at horizon
- IRR
- 4.6%
- Equity multiple
- 1.26×
- Total profit
- $26,806
- Equity at exit
- $163,355
- IRR
- 7.7%
- Equity multiple
- 2.17×
- Total profit
- $119,399
- Equity at exit
- $251,645
Cash invested: $101,808 (down + closing). Projections, not guarantees.
Landlord ↔ Tenant lean methodology
- Overall (STATE)
- 90 Strongly Landlord-Friendly
- State South Carolina
- 90 Strongly Landlord-Friendly · R+6
- County
- — inherits STATE
- City
- — inherits STATE
ZIP-level market 29729
- Home prices YoY
- 1.4%
- Active inventory
- 83
- Price-to-rent
- 9.8×
Monthly cashflow live
- Estimated rent
- $2,845 medium interval (Pro) →
- Mortgage (P&I)
- −$1,907
- Tax est. 1.5%
- −$454 /mo · $5,454/yr
- Insurance
- −$152
- HOA
- −$0
- Vacancy / Maint / Mgmt
- −$597
- Net cashflow
- $-266
Break-even live
Sensitivity live
| Price | -10% $-14 | -5% $-140 | +0% $-266 | +5% $-391 | +10% $-517 |
|---|---|---|---|---|---|
| Rent | -10% $-490 | -5% $-378 | +0% $-266 | +5% $-153 | +10% $-41 |
| Rate | -1.0pp $-82 | -0.5pp $-173 | base $-266 | +0.5pp $-360 | +1.0pp $-456 |
UW: 25.0% down · 7.5% · 30yr · 1.5% tax · 5.0% vac · 8.0% maint · 8.0% mgmt
Financing live
Cash to close
- Down payment
- $90,900
- Closing costs
- $10,908
- Reserves months
- —
- Total cash needed
- —
Loan-product check · same deal, 3 products live
Conventional
25% down · 7.5% · 30yr
- Down + closing
- —
- Monthly P&I
- —
- Monthly cashflow
- —
- DSCR
- —
- Eligible?
- —
Personal DTI + credit; lowest rate.
DSCR
20% down · 8.5% · 30yr
- Down + closing
- —
- Monthly P&I
- —
- Monthly cashflow
- —
- DSCR
- —
- Eligible?
- —
No personal income docs; deal must DSCR.
Hard money
10% down · 12.0% · 12mo
- Down + closing
- —
- Monthly P&I
- —
- Monthly cashflow
- —
- DSCR
- —
- Eligible?
- —
Short-term bridge; refi at stabilization.
Listing history 14 events
-
2026-06-21days on market $335,900 Active 240 DOM
-
2026-06-18days on market $335,900 Active 237 DOM
-
2026-06-17days on market $335,900 Active 236 DOM
-
2026-06-16days on market $335,900 Active 235 DOM
-
2026-06-15days on market $335,900 Active 234 DOM
-
2026-06-13days on market $335,900 Active 232 DOM
-
2026-06-09days on market $335,900 Active 228 DOM
-
2026-06-08days on market $335,900 Active 227 DOM
-
2026-06-07days on market $335,900 Active 226 DOM
-
2026-06-04days on market $335,900 Active 223 DOM
-
2026-06-03days on market $335,900 Active 222 DOM
-
2026-06-02days on market $335,900 Active 221 DOM
-
2026-06-01days on market $335,900 Active 220 DOM
-
2026-05-31days on market $335,900 Active 219 DOM
ⓘ Source: listings_history table (triggers on properties + properties_extension) + one-shot
backfill from property_details.listing_events for pre-trigger history.
Nearby sold comps map
Loading sold comps map…
Walkable amenities ~0.75 mi
Loading nearby amenities…
Taxation est. · year 1
- Rental income
- $34,135
- − Mortgage interest
- −$20,367
- − Property taxes
- −$5,454
- − Insurance
- −$1,818
- − Repairs & maintenance
- −$2,731
- − Management
- −$2,731
- − Depreciation
- −$10,577
- Taxable loss
- −$9,543
- Est. tax savings @ 24.0%
- +$2,290
- After-tax cash flow
- $-896/yr
For passive investors: Depreciation is non-cash, so a rental often shows a tax loss while cash-flowing — sheltering income. Rental losses are passive: they offset passive income freely, and up to $25,000/yr can offset ordinary (W-2) income if you actively participate and your MAGI is under $100k (phasing out to $0 by $150k); unused losses carry forward. On sale, claimed depreciation is recaptured at up to 25%, and gains may owe capital-gains tax (a 1031 exchange can defer both). Figures are a year-1 estimate at your 24.0% rate — not tax advice; consult a CPA.
Schools (NCES district)
- District
- Chester 01
- NCES district ID
- 4501530
- Math proficiency
- 23% ▼ -6.00%
- Reading proficiency
- 34% ▬ 0.00%
- Median HH income
- $34,041
- Composite
- 23.39/100
- National rank
- #7902
- State rank
- #59 of 80 in SC
Livability — Richburg
- Score
- 63/100
- State rank
- #182
- US rank
- #15927
Category grades
Schools grade is shown separately in the Schools card above.
Census & demographics
- Population (ZIP)
- 2,313
Population outlook (Chester County) Hauer SSP2
- Today (2025)
- 30,121 people
- By 2030
- 28,700 · -4.7%
- By 2040
- 25,784 · -14.4%
- By 2050
- 23,001 · -23.6%
- By 2075
- 17,770 · -41.0%
- By 2100
- 13,584 · -54.9%
Race, ethnicity, and origin ACS 2023
- Neighborhood character
- Diverse neighborhood (Simpson 0.57)
- Race & ethnicity
- White 60% Black 26% Two or more races 12% Hispanic / Latino 7%
- Hispanic origin (detail)
- Mexican 2% Puerto Rican 5%
- Common ancestry
- Danish 2% Serbian 2% Lithuanian 2%
- Foreign-born
- 2% · Canada, Guatemala
- Languages at home
- 99% English-only · Spanish 1%
Political lean MEDSL · Chester
- 2024 margin
- R (+17.2) · D 40.8% · R 58.0% · Other 1.1%
- 2008→2024 swing
- -25.5pp toward R · 2008: 8.3pp · 2024: -17.2pp
- All cycles
- 2024: R+17.2 2020: R+10.9 2016: R+4.8 2012: D+10.5 2008: D+8.3
Not yet ingested
- Civics
- —
Market trends
- HPI YoY
- ▲ 2.99%
- Current HPI
- 210.6518
- Rent YoY
- —
- Metro
- —
- State GDP YoY
- ▲ 4.51%
- F500 in state
- 2
Industry mix (Fortune 500 HQ in SC)
| Industry | F500 HQs | Revenue |
|---|---|---|
| Packaging | 1 | $7B |
|
||
Cash-flow waterfall
monthlySold comps — $/sqft
last 12 mo · ≤1 miLoading sold comps…