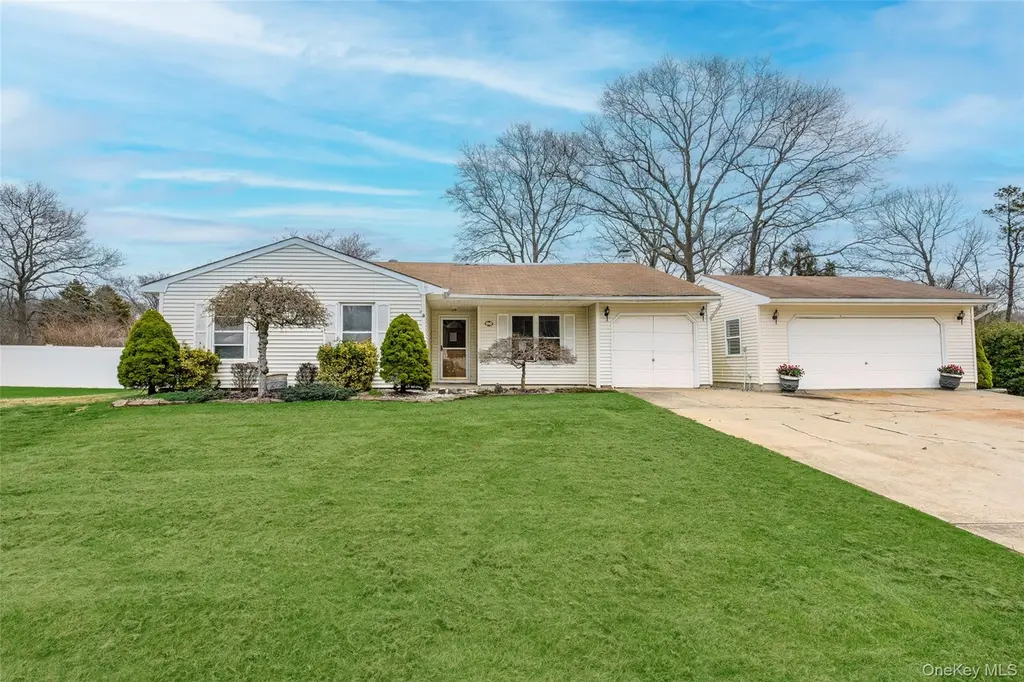
35 Timber Trail Ln · Medford, NY
Flood risk 1/10 · Minimal
- FEMA flood zone
- X (unshaded)
- Chance of flooding over 30 yrs
- 0.0%
- Est. flood insurance / yr
- $507 – $1,088
Fire risk 3/10 · Minor
- Est. fire insurance / yr
- $691 – $1,283
Heat risk 4/10 · Minor
- Hot days now (above 93°F)
- 7 days/yr
- Hot days in 30 yrs
- 16 days/yr
Wind risk 7/10 · Major
- Chance of severe wind over 30 yrs
- 78.0%
Air-quality risk 3/10 · Minor
- Unhealthy air days now
- 3 days/yr
- Unhealthy air days in 30 yrs
- 4 days/yr
Risk factors via First Street. Map © Google.
Why this score? — see what drove the D- grade
The composite is a weighted blend of 9 inputs, each scored 0–100. Each bar is that input's sub-score; the figure is the points it added to the 100-point composite (weight × sub-score).
- ARV discount +15.0/15.0
- Cash flow +7.0/30.0
- Schools +5.2/10.0
- Livability +3.5/5.0
- 1% rule +2.8/10.0
- Rent growth +2.5/5.0
- Condition / age +2.5/5.0
- DSCR +1.2/10.0
- Appreciation +0.0/10.0
$499,900
🖨 Deal sheet 📄 Offer letter ✓ Due diligence
Listing remarks MLS
Welcome to this spacious 4-bedroom, 2-bath ranch tucked into a quiet Medford neighborhood. The main home features a bright eat-in kitchen, a dedicated dining area, and a comfortable den that provides valuable extra living space. An attached one-car garage opens directly into the den, adding everyday convenience and functionality. A separate garage structure has been converted into a 1-bedroom, 1-bath living area. This conversion is not a legal apartment and will require proper permits with the Town of Brookhaven. The property offers generous outdoor space and sits in a location that provides easy access to the Long Island Expressway, making commuting and travel simple.
Key facts
- Attached garage
- Eat-in kitchen
- Comfortable den
Tags
Neighborhood map
What this means for you Summary
Snapshot
- This is a 4-bed/3.0-bath single-family listed at $500k.
Deal economics
- At list price, monthly cash flow is $-734 ($-9k/yr) — negative.
- To cash-flow at today's rent, offer at most $370k (25.9% below list).
- To meet the 1% rule (rent ≥ 1% of price), the offer needs to be $391k (21.7% below list).
- Recommended offer: $370k (25.9% below list) — sets the bar for cash-flow.
- Cap rate 4.5% vs local median 3.5% in Medford — meaningfully above typical; check what's discounted (condition, days-on-market, listing class) to confirm the premium yield is real.
Location & tenants
- Location reads 69/100 on livability (#502 in NY) — a middle-class / working-renter tenant base. Strengths: employment A+, housing A+, health & safety B; Watch: schools C-, amenities F, commute F.
- Longwood Central School District (rural): math 61% / reading 55% proficiency, ranked #235 of 590 in NY (top 40%) — acceptable for families but not a draw, mixed tenant base, ~2y average lease.
- Market conditions: 186 active listings in the ZIP; 3 comparable units currently listed for rent nearby; rentals at typical pace (median 21d on market — plan ~3-4 weeks tenant-placement turnaround); high-income renter base; 1,366 units permitted in Suffolk County in 2024 (216 in 5+ unit buildings).
- This rent runs 39% of the median local income ($121k/yr) — at the standard rent-burdened threshold; future hikes will face affordability resistance.
Forward outlook
- Local home prices are declining (-3.0%/yr); year-one equity from $3k of loan paydown is wiped out by about $15k of value loss. Plan a longer hold.
- Suffolk County population projected to shrink 5% by 2050 — rents likely to lag national; underwrite the cash flow, not the appreciation.
Negotiation context
- It's been on market 29 days — a 2% lower offer ($492k) is reasonable based on typical stale-listing flexibility.
- 3 sale attempts with the ask held roughly flat each time — persistent listings suggest the price (not the market) is what's stuck; bring a comps-based counter.
Risks & watch-outs
- Climate carrying-cost: major wind risk, 78% chance of damaging wind over 30y — expect insurance premiums to compound above CPI over the hold.
Questions for the listing agent
- What do current leases actually rent for vs. the listed asking? Can we see a recent rent roll and the last 12 months of T-12 income?
- Built in 1977 — when were the roof, HVAC, electrical panel, plumbing, and water heater last replaced?
- Is there a deadline driving the sale (1031 exchange, divorce, estate, relocation)? That informs how much negotiation room exists.
- The area grade is low — what's the realistic commute time and amenity access for the typical tenant pool here? Any planned neighborhood developments (good or bad) we should know about?
- What's the average days-on-market for RENTAL listings here right now (not sales)? A rising rental-DOM trend means longer vacancies and softer asking-rent achievability than the comps imply.
- What's the recent tenant-quality profile in this submarket — average credit score on applications, eviction rate, late-payment / NSF rate, and stable-employment percentage? A property-management company in the area should have these aggregated.
- How much new for-sale + rental construction is in the pipeline within 1–3 miles? Heavy new supply typically softens prices + rents 12–24 months out; constrained supply supports both.
Investment metrics
- 1% rule
- 0.78% ✗
- Cap rate
- 4.53%
- Cash-on-cash
- -6.29%
- DSCR
- 0.72
- GRM
- 10.6
CMA / ARV
- ARV (median comp)
- $632,541
- List price
- $499,900
- Delta
- -20.97%
- Verdict
- UNDERPRICED
- Comps
- 20 within 1.0 mi
Show comp detail 7 sales within ~0.75 mi
| Address | Dist | Beds/Ba | Sqft | Sold | Price | $/sf | Match |
|---|---|---|---|---|---|---|---|
| 45 Timber Trail Ln | 0.11mi | 4/1.5 | 1,582 (+0%) | 0mo | $577,000 | $365 | 88 |
| 5 Winged Foot Dr | 0.12mi | 4/3.5 | 1,550 (-2%) | 18mo | $612,700 | $395 | 75 |
| 3 Timber Trail Ln | 0.35mi | 4/1.0 | 1,496 (-5%) | 1mo | $565,000 | $378 | 66 |
| 21 Masem Ct | 0.57mi | 3/2.0 (-1) | 1,690 (+7%) | 1mo | $725,000 | $429 | 51 |
| 95 Lincoln Rd | 0.43mi | 3/2.0 (-1) | 1,371 (-13%) | 5mo | $565,000 | $412 | 45 |
| 2809 Heather Ave | 0.69mi | 3/2.0 (-1) | 1,708 (+8%) | 0mo | $630,000 | $369 | 44 |
| 49 Lincoln Rd | 0.49mi | 3/2.0 (-1) | 1,454 (-8%) | 20mo | $530,000 | $365 | 39 |
Match score weights: distance 35% · size 25% · config 20% · recency 20%. Top-matched comps best support the ARV.
Projected returns pro-forma
-3.0% appreciation · 3.0% rent growth · sell at horizon
- IRR
- -27.1%
- Equity multiple
- 0.09×
- Total profit
- $-127,480
- Equity at exit
- $74,537
- IRR
- -24.6%
- Equity multiple
- -0.21×
- Total profit
- $-170,052
- Equity at exit
- $43,222
Cash invested: $139,972 (down + closing). Projections, not guarantees.
Landlord ↔ Tenant lean methodology
- Overall (STATE)
- 15 Strongly Tenant-Friendly
- State New York
- 15 Strongly Tenant-Friendly · D+10
- County
- — inherits STATE
- City
- — inherits STATE
ZIP-level market 11763
- Active inventory
- 186
- Price-to-rent
- 10.6×
Monthly cashflow live
- Estimated rent
- $3,915 medium interval (Pro) →
- Mortgage (P&I)
- −$2,622
- Tax from tax record
- −$997 /mo · $11,964/yr
- Insurance
- −$208
- HOA
- −$0
- Vacancy / Maint / Mgmt
- −$822
- Net cashflow
- $-734
Break-even live
UW: 25.0% down · 7.5% · 30yr · 1.5% tax · 5.0% vac · 8.0% maint · 8.0% mgmt
Financing live
Cash to close
- Down payment
- $124,975
- Closing costs
- $14,997
- Reserves months
- —
- Total cash needed
- —
Loan-product check · same deal, 3 products live
Conventional
25% down · 7.5% · 30yr
- Down + closing
- —
- Monthly P&I
- —
- Monthly cashflow
- —
- DSCR
- —
- Eligible?
- —
Personal DTI + credit; lowest rate.
DSCR
20% down · 8.5% · 30yr
- Down + closing
- —
- Monthly P&I
- —
- Monthly cashflow
- —
- DSCR
- —
- Eligible?
- —
No personal income docs; deal must DSCR.
Hard money
10% down · 12.0% · 12mo
- Down + closing
- —
- Monthly P&I
- —
- Monthly cashflow
- —
- DSCR
- —
- Eligible?
- —
Short-term bridge; refi at stabilization.
Rent comps 3 comps
| Address | Beds | Baths | Sqft | Rent | $/sqft | DOM | Units | Dist |
|---|---|---|---|---|---|---|---|---|
| 3107 Gull Ave Medford, NY | 3.0 | 1.0 | 1622 | $3,900 | $2.40 | 1d | 1 | 0.82mi |
| 546 Granny Rd Medford, NY | 3.0 | 1.0 | 1152 | $3,500 | $3.04 | 43d | 1 | 1.45mi |
| 546 Granny Rd Medford, NY | 3.0 | 1.0 | 1152 | $3,500 | $3.04 | 20d | 1 | 1.45mi |
Listing history 8 events
-
2026-05-07status Pending 679-char remark
Show marketing remark (679 chars)
Welcome to this spacious 4-bedroom, 2-bath ranch tucked into a quiet Medford neighborhood. The main home features a bright eat-in kitchen, a dedicated dining area, and a comfortable den that provides valuable extra living space. An attached one-car garage opens directly into the den, adding everyday convenience and functionality. A separate garage structure has been converted into a 1-bedroom, 1-bath living area. This conversion is not a legal apartment and will require proper permits with the Town of Brookhaven. The property offers generous outdoor space and sits in a location that provides easy access to the Long Island Expressway, making commuting and travel simple.
-
2026-04-08$499,900 Active 679-char remark
Show marketing remark (679 chars)
Welcome to this spacious 4-bedroom, 2-bath ranch tucked into a quiet Medford neighborhood. The main home features a bright eat-in kitchen, a dedicated dining area, and a comfortable den that provides valuable extra living space. An attached one-car garage opens directly into the den, adding everyday convenience and functionality. A separate garage structure has been converted into a 1-bedroom, 1-bath living area. This conversion is not a legal apartment and will require proper permits with the Town of Brookhaven. The property offers generous outdoor space and sits in a location that provides easy access to the Long Island Expressway, making commuting and travel simple.
-
2025-08-09status Pending
-
2025-08-08historical
-
2025-07-25status Active
-
2025-07-25price $499,000
-
2025-06-10status Pending
-
2025-05-13$545,000 Active
ⓘ Source: listings_history table (triggers on properties + properties_extension) + one-shot
backfill from property_details.listing_events for pre-trigger history.
Tax reassessment forecast NY · Partial reset (capped growth)
- Current annual tax
- $11,964 · $997/mo
- Projected year-2 tax
- $11,964 · $997/mo
- Expected delta
- $0/yr ($0/mo · 0.0%)
ⓘ Screening estimate from a state-policy table — verify with the county assessor before closing.
Climate risk First Street
- Flood 1/10 Low FEMA zone X (unshaded) · 0% chance over 30 yrs
- Wildfire 3/10 Moderate
- Heat 4/10 Moderate 7 d/yr ≥93°F today · 16 d/yr by 30 yrs out
- Wind 7/10 Severe 78% chance of damaging wind over 30 yrs
- Air quality 3/10 Moderate 3 unhealthy d/yr today · 4 by 30 yrs out
Nearby sold comps map
Loading sold comps map…
Walkable amenities ~0.75 mi
Loading nearby amenities…
Taxation est. · year 1
- Rental income
- $46,976
- − Mortgage interest
- −$28,002
- − Property taxes
- −$11,964
- − Insurance
- −$2,500
- − Repairs & maintenance
- −$3,758
- − Management
- −$3,758
- − Depreciation
- −$14,543
- Taxable loss
- −$17,548
- Est. tax savings @ 24.0%
- +$4,212
- After-tax cash flow
- $-4,599/yr
For passive investors: Depreciation is non-cash, so a rental often shows a tax loss while cash-flowing — sheltering income. Rental losses are passive: they offset passive income freely, and up to $25,000/yr can offset ordinary (W-2) income if you actively participate and your MAGI is under $100k (phasing out to $0 by $150k); unused losses carry forward. On sale, claimed depreciation is recaptured at up to 25%, and gains may owe capital-gains tax (a 1031 exchange can defer both). Figures are a year-1 estimate at your 24.0% rate — not tax advice; consult a CPA.
Schools (NCES district)
- District
- Longwood Central School District
- NCES district ID
- 3619230
- Math proficiency
- 61% ▬ 0.00%
- Reading proficiency
- 55% ▼ -1.00%
- Median HH income
- $72,748
- Composite
- 51.63/100
- National rank
- #1703
- State rank
- #235 of 590 in NY
Livability — Medford
- Score
- 69/100
- State rank
- #502
- US rank
- #8793
Category grades
Schools grade is shown separately in the Schools card above.
Census & demographics
- Census place
- Medford, NY
- County
- Suffolk County · 679,920 people
- City population
- 29,973
- Metro
- New York-Newark-Jersey City, NY-NJ-PA
- Population (ZIP)
- 29,973
- Household income
- $120,783
- Rent vs Own
- Severe rent burden
- 339.0
Population outlook (Suffolk County) Hauer SSP2
- Today (2025)
- 1,505,262 people
- By 2030
- 1,498,318 · -0.5%
- By 2040
- 1,471,101 · -2.3%
- By 2050
- 1,424,848 · -5.3%
- By 2075
- 1,337,157 · -11.2%
- By 2100
- 1,217,720 · -19.1%
Race, ethnicity, and origin ACS 2023
- Neighborhood character
- Diverse neighborhood (Simpson 0.61)
- Race & ethnicity
- White 54% Hispanic / Latino 29% Two or more races 14% Black 11% Asian 2%
- Hispanic origin (detail)
- Mexican 3% Puerto Rican 6% Dominican 3%
- Common ancestry
- Romanian 2% Scotch-Irish 2% Hispanic 2%
- Foreign-born
- 17% · Canada, Jamaica
- Languages at home
- 70% English-only · Spanish 23% French/Haitian/Cajun 3% Other Indo-European 2%
Political lean MEDSL · Suffolk
- 2024 margin
- Lean R (+10.0) · D 45.0% · R 55.0%
- 2008→2024 swing
- -16.0pp toward R · 2008: 6.0pp · 2024: -10.0pp
- All cycles
- 2024: R+10.0 2020: R+0.0 2016: R+8.2 2012: D+2.9 2008: D+6.0
Not yet ingested
- Civics
- —
Market trends
- HPI YoY
- ▼ -531.78%
- Current HPI
- 379.1499
- Rent YoY
- —
- Metro
- New York-Newark-Jersey City, NY-NJ-PA
- State GDP YoY
- ▲ 2.60%
- F500 in state
- 92
Industry mix (Fortune 500 HQ in NY)
| Industry | F500 HQs | Revenue |
|---|---|---|
| Financial Services | 10 | $950B |
|
||
| Consumer Goods | 9 | $162B |
|
||
| Insurance | 4 | $225B |
|
||
| Telecommunications | 2 | $144B |
|
||
| Pharmaceuticals | 2 | $112B |
|
||
| Media / Entertainment | 2 | $69B |
|
||
Price history
-8.3% since first listed8 events — show timeline
- 2026-05-07 Pending — OneKey® MLS as Distributed by MLS Grid
- 2026-04-08 Listed $499,900 OneKey® MLS as Distributed by MLS Grid
- 2025-08-09 Pending — OneKey® MLS as Distributed by MLS Grid
- 2025-08-08 Listing Removed — OneKey® MLS as Distributed by MLS Grid
- 2025-07-25 Relisted — OneKey® MLS as Distributed by MLS Grid
- 2025-07-25 Price Changed $499,000 OneKey® MLS as Distributed by MLS Grid
- 2025-06-10 Pending — OneKey® MLS as Distributed by MLS Grid
- 2025-05-13 Listed $545,000 OneKey® MLS as Distributed by MLS Grid
Property tax history
+2.7%/yrLatest (2025): $11,964 · +0.0% YoY. Source: county tax records.
Cash-flow waterfall
monthlySold comps — $/sqft
last 12 mo · ≤1 miLoading sold comps…