 Duplex
41 Bradhurst Ave · New York, NY
Flood risk 5/10 · Moderate
- FEMA flood zone
- X (unshaded)
- Chance of flooding over 30 yrs
- 0.24%
- Est. flood insurance / yr
- $507 – $1,088
Fire risk 1/10 · Minimal
- Est. fire insurance / yr
- $691 – $1,283
Heat risk 6/10 · Moderate
- Hot days now (above 99°F)
- 7 days/yr
- Hot days in 30 yrs
- 15 days/yr
Wind risk 6/10 · Moderate
- Chance of severe wind over 30 yrs
- 27.0%
Air-quality risk 4/10 · Minor
- Unhealthy air days now
- 5 days/yr
- Unhealthy air days in 30 yrs
- 6 days/yr
Risk factors via First Street. Map © Google.
Why this score? — see what drove the D- grade
The composite is a weighted blend of 9 inputs, each scored 0–100. Each bar is that input's sub-score; the figure is the points it added to the 100-point composite (weight × sub-score).
- Appreciation +9.0/10.0
- ARV discount +7.5/15.0
- Cash flow +5.0/30.0
- Schools +5.0/10.0
- Rent growth +4.7/5.0
- Livability +3.8/5.0
- Condition / age +2.5/5.0
- 1% rule +0.0/10.0
- DSCR +0.0/10.0
$1,895,000
🖨 Deal sheet (PDF) 📄 Offer letter ✓ Due diligence
Multi-family units
County records classify this as Multi-Family (2-4 Unit). Listing-text estimate: 2 units. confirmed
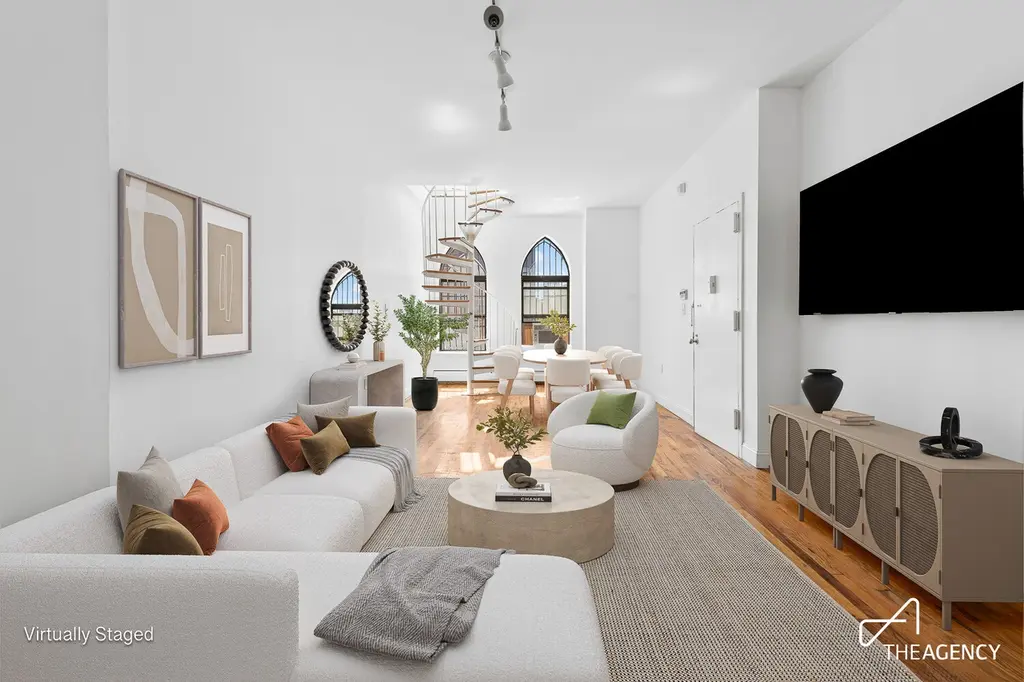
Listing remarks
Renovated 18' wide two family townhouse with brand new kitchens and bathrooms, a low-maintenance paved & walled garden, and a classic Queen Anne style brick facade. Newly painted and renovated throughout, the triplex features a fantastic modern IKEA kitchen with all the bells and whistles, including granite countertops, a Bosch dishwasher, doublewide fridge freezer, and fabulous wine cooler. The parlor floor also features a half bath with beautiful glass tiling, an entrance directly into the walled, paved garden with roses in modern steel containers, a large living room and a spiral staircase into a bonus master den on the third floor. The master bedroom here has a view of the walled
Key facts
- Paved garden
- Renovated kitchens
- Glass tiling
Tags
Property features AI
Finance
- Financial info: Pets allowed in building (restrictions apply)
Exterior
- Home design: One-story building; Entry at level 1
- Construction: Green building
- Exterior features: Private outdoor space over 60 sqft
Interior
- Bedrooms: Total of 10 rooms (includes bedrooms and living spaces)
- Bathrooms: 3 full bathrooms; 1 half bathroom
- Heating & cooling: Has cooling
- Interior features: High ceilings; Smoke-free
- Laundry & utility: Washer hookup; In-unit laundry allowed
Neighborhood map
What this means for you Summary
Snapshot
- This is a 2 × 2-bed/?-bath units multifamily listed at $1.90M.
Deal economics
- At list price, monthly cash flow is $-5k ($-54k/yr) — negative. Per door: $-2k/mo.
- To cash-flow at today's rent, offer at most $1.10M (42.0% below list).
- To meet the 1% rule (rent ≥ 1% of price), the offer needs to be $865k (54.3% below list).
- Recommended offer: $865k (54.3% below list) — sets the bar for 1% rule.
- Cap rate 3.4% vs local median 2.6% in New York — top-decile yield for the area; either an underpriced asset or a hidden risk that comps aren't pricing in. Stress-test before assuming the spread holds.
Location & tenants
- Location reads 75/100 on livability (#268 in NY, #4,188 nationally) — a middle-class / working-renter tenant base. Strengths: amenities A+, commute A+, health & safety A; Watch: crime F, cost of living F.
- Zoned schools: Elm Tree Elementary School (math 27% / reading 52%, grade F, #1,444 of 2,108 statewide, top 71%, 806 students, 94% FRL); Mark Twain Is 239 For The Gifted And Talented (math 90% / reading 96%, grade A+, #6 of 729 statewide, top 1%, 1,207 students, 44% FRL); Midwood High School (math 94% / reading 96%, grade A+, #83 of 1,100 statewide, top 8%, 4,062 students, 73% FRL).
- Market conditions: Rents rising fast (+8.8%/yr); 73 active listings in the ZIP; 3 comparable units currently listed for rent nearby; rentals at typical pace (median 27d on market — plan ~3-4 weeks tenant-placement turnaround); lower-income renter base — watch delinquency; 4,467 units permitted in New York County in 2024 (4,463 in 5+ unit buildings).
- At $8,653/mo this rent would consume 261% of the median local household income ($40k/yr) (locally 4110% of renters already pay >50% of income on rent) — very limited rent-growth headroom before tenants either downsize or default.
Forward outlook
- In year one you build about $166k of equity ($13k loan paydown + $152k appreciation (8.1% local appreciation)).
- New York County population projected at +21% by 2050 — long-run rental-demand tailwind backs the buy-and-hold thesis.
- By year 2, paydown + projected appreciation supports a ~$265k cash-out refi (75% LTV) — recoverable capital for the next deal without selling this one.
Negotiation context
- It's been on market 25 days — a 2% lower offer ($1.87M) is reasonable based on typical stale-listing flexibility.
- 3 sale attempts since 8y ago with the ask held roughly flat each time — persistent listings suggest the price (not the market) is what's stuck; bring a comps-based counter.
Risks & watch-outs
- Watch-outs: built in 1901 — expect roof / HVAC / electrical / plumbing capex.
- Climate carrying-cost: moderate flood risk; major wind risk, 27% chance of damaging wind over 30y; extreme-heat days projected 7→15/yr by 2055 (HVAC capex compounding) — expect insurance premiums to compound above CPI over the hold.
Questions for the listing agent
- What do current leases actually rent for vs. the listed asking? Can we see a recent rent roll and the last 12 months of T-12 income?
- Can we see the unit-by-unit rent roll, current vacancy, and any below-market leases? What's the average tenancy length?
- What capital expenditures (roof, boiler, parking lot, exteriors) have been made in the last 5 years, and what's planned in the next 2?
- Built in 1901 — when were the roof, HVAC, electrical panel, plumbing, and water heater last replaced?
- Is there a deadline driving the sale (1031 exchange, divorce, estate, relocation)? That informs how much negotiation room exists.
- Schools are B-rated — typically a magnet for longer-tenancy family renters. What's the average tenant stay here, and is there a school-zone premium baked into asking?
- Crime grade is F in this area — have there been break-ins, vandalism, or insurance claims at this property in the last 3 years? What carrier currently insures it and at what premium?
- The area grade is low — what's the realistic commute time and amenity access for the typical tenant pool here? Any planned neighborhood developments (good or bad) we should know about?
- What's the average days-on-market for RENTAL listings here right now (not sales)? A rising rental-DOM trend means longer vacancies and softer asking-rent achievability than the comps imply.
- What's the recent tenant-quality profile in this submarket — average credit score on applications, eviction rate, late-payment / NSF rate, and stable-employment percentage? A property-management company in the area should have these aggregated.
- How much new apartment / multifamily construction is in the pipeline within 1–3 miles? Heavy new supply (>2% of stock underway) typically softens rents 12–24 months out; light construction supports rent growth.
Investment metrics
- 1% rule
- 0.46% ✗
- Cap rate
- 3.44%
- Cash-on-cash
- -10.18%
- DSCR
- 0.55
- GRM
- 18.2
CMA / ARV
- ARV (on-the-fly)
- $220,816
- Comps found
- 1
Show comp detail 1 sale within ~0.75 mi
| Address | Dist | Beds/Ba | Sqft | Sold | Price | $/sf | Match |
|---|---|---|---|---|---|---|---|
| 30 W 141st St Unit 7E | 0.56mi | 4/4.0 | 3,328 (+12%) | 18mo | $245,000 | $74 | 38 |
Match score weights: distance 35% · size 25% · config 20% · recency 20%. Top-matched comps best support the ARV.
Projected returns pro-forma
8.05% appreciation · 8.0% rent growth · sell at horizon
- IRR
- 13.5%
- Equity multiple
- 2.03×
- Total profit
- $544,269
- Equity at exit
- $1,445,677
- IRR
- 14.6%
- Equity multiple
- 4.59×
- Total profit
- $1,905,733
- Equity at exit
- $2,875,390
Cash invested: $530,600 (down + closing). Projections, not guarantees.
Landlord ↔ Tenant lean methodology
- Overall (CITY)
- 0 Strongly Tenant-Friendly
- State New York
- 15 Strongly Tenant-Friendly · D+10
- County
- — inherits STATE
- City New York
- 0 Strongly Tenant-Friendly · D+34
ZIP-level market 10030
- Home prices YoY
- 2.3%
- Rents YoY
- 8.8%
- Active inventory
- 73
- Price-to-rent
- 36.5×
Monthly cashflow live
- Estimated rent
- $8,653 medium interval (Pro) →
- Mortgage (P&I)
- −$9,938
- Tax from tax record
- −$611 /mo · $7,337/yr
- Insurance
- −$790
- HOA
- −$0
- Vacancy / Maint / Mgmt
- −$1,817
- Net cashflow
- $-4,503
Break-even live
Sensitivity live
| Price | -10% $-3,430 | -5% $-3,966 | +0% $-4,503 | +5% $-5,039 | +10% $-5,575 |
|---|---|---|---|---|---|
| Rent | -10% $-5,186 | -5% $-4,844 | +0% $-4,503 | +5% $-4,161 | +10% $-3,819 |
| Rate | -1.0pp $-3,548 | -0.5pp $-4,021 | base $-4,503 | +0.5pp $-4,994 | +1.0pp $-5,493 |
2-unit breakdown (identical units grouped — click to expand)
| Units | Beds | Baths | Est. rent |
|---|---|---|---|
| 2× units | 2 | — | $8,654 |
| #1 | 2 | — | $4,327 |
| #2 | 2 | — | $4,327 |
| Total (2 units) | $8,653 | ||
UW: 25.0% down · 7.5% · 30yr · 1.5% tax · 5.0% vac · 8.0% maint · 8.0% mgmt
Financing live
Cash to close
- Down payment
- $473,750
- Closing costs
- $56,850
- Reserves months
- —
- Total cash needed
- —
Loan-product check · same deal, 3 products live
Conventional
25% down · 7.5% · 30yr
- Down + closing
- —
- Monthly P&I
- —
- Monthly cashflow
- —
- DSCR
- —
- Eligible?
- —
Personal DTI + credit; lowest rate.
DSCR
20% down · 8.5% · 30yr
- Down + closing
- —
- Monthly P&I
- —
- Monthly cashflow
- —
- DSCR
- —
- Eligible?
- —
No personal income docs; deal must DSCR.
Hard money
10% down · 12.0% · 12mo
- Down + closing
- —
- Monthly P&I
- —
- Monthly cashflow
- —
- DSCR
- —
- Eligible?
- —
Short-term bridge; refi at stabilization.
Rent comps 3 comps
| Address | Beds | Baths | Sqft | Rent | $/sqft | DOM | Units | Dist |
|---|---|---|---|---|---|---|---|---|
| 261 W 131st St Unit 1 New York, NY | 3.0 | 2.0 | 2400 | $7,000 | $2.92 | 26d | 1 | 0.66mi |
| 114 W 131st St Apt 2 New York, NY | 3.0 | 2.0 | 2000 | $6,750 | $3.38 | 26d | 1 | 0.77mi |
| 114 W 131st St Apt 2 New York, NY | 3.0 | 2.0 | 2000 | $6,150 | $3.08 | 19d | 1 | 0.77mi |
Listing history 21 events
-
2026-06-21days on market $1,895,000 Active 25 DOM
-
2026-06-18days on market $1,895,000 Active 22 DOM
-
2026-06-17days on market $1,895,000 Active 21 DOM
-
2026-06-16days on market $1,895,000 Active 20 DOM
-
2026-06-15days on market $1,895,000 Active 19 DOM
-
2026-06-13days on market $1,895,000 Active 17 DOM
-
2026-06-10days on market $1,895,000 Active 13 DOM
-
2026-06-08days on market $1,895,000 Active 12 DOM
-
2026-06-08days on market $1,895,000 Active 11 DOM
-
2026-06-04days on market $1,895,000 Active 8 DOM
-
2026-06-03days on market $1,895,000 Active 7 DOM
-
2026-06-02days on market $1,895,000 Active 6 DOM
-
2026-06-01days on market $1,895,000 Active 5 DOM
-
2026-05-31days on market $1,895,000 Active 4 DOM
-
2026-05-27$1,895,000 Active
-
2019-10-18soldstatus $1,750,000
-
2019-10-11price $1,750,000
-
2019-07-20price $1,890,000
-
2018-11-29$1,950,000 Active
-
2018-11-29$1,750,000
-
1997-07-02soldstatus $500
ⓘ Source: listings_history table (triggers on properties + properties_extension) + one-shot
backfill from property_details.listing_events for pre-trigger history.
Tax reassessment forecast NY · Partial reset (capped growth)
- Current annual tax
- $7,337 · $611/mo
- Projected year-2 tax
- $19,681 · $1,640/mo
- Expected delta
- +$12,344/yr (+$1,029/mo · 168.3%)
ⓘ Screening estimate from a state-policy table — verify with the county assessor before closing.
Climate risk First Street
- Flood 5/10 Major FEMA zone X (unshaded) · 24% chance over 30 yrs
- Wildfire 1/10 Low
- Heat 6/10 Major 7 d/yr ≥99°F today · 15 d/yr by 30 yrs out
- Wind 6/10 Major 27% chance of damaging wind over 30 yrs
- Air quality 4/10 Moderate 5 unhealthy d/yr today · 6 by 30 yrs out
Nearby sold comps map
Loading sold comps map…
Walkable amenities ~0.75 mi
Loading nearby amenities…
Taxation est. · year 1
- Rental income
- $103,836
- − Mortgage interest
- −$106,149
- − Property taxes
- −$7,337
- − Insurance
- −$9,475
- − Repairs & maintenance
- −$8,307
- − Management
- −$8,307
- − Depreciation
- −$55,127
- Taxable loss
- −$90,866
- Est. tax savings @ 24.0%
- +$21,808
- After-tax cash flow
- $-32,224/yr
For passive investors: Depreciation is non-cash, so a rental often shows a tax loss while cash-flowing — sheltering income. Rental losses are passive: they offset passive income freely, and up to $25,000/yr can offset ordinary (W-2) income if you actively participate and your MAGI is under $100k (phasing out to $0 by $150k); unused losses carry forward. On sale, claimed depreciation is recaptured at up to 25%, and gains may owe capital-gains tax (a 1031 exchange can defer both). Figures are a year-1 estimate at your 24.0% rate — not tax advice; consult a CPA.
Schools (NCES district)
No district data.
Livability — New York
- Score
- 75/100
- State rank
- #268
- US rank
- #4188
Category grades
Schools grade is shown separately in the Schools card above.
Census & demographics
- Census place
- New York, NY
- County
- New York County · 1,599,927 people
- City population
- 7,731,280
- Metro
- New York-Newark-Jersey City, NY-NJ-PA
- Population (ZIP)
- 29,297
- Household income
- $39,802
- Rent vs Own
- Severe rent burden
- 4110.0
Population outlook (New York County) Hauer SSP2
- Today (2025)
- 1,825,725 people
- By 2030
- 1,904,611 · +4.3%
- By 2040
- 2,052,719 · +12.4%
- By 2050
- 2,206,601 · +20.9%
- By 2075
- 2,509,427 · +37.4%
- By 2100
- 2,702,933 · +48.0%
Race, ethnicity, and origin ACS 2023
- Neighborhood character
- Diverse neighborhood (Simpson 0.62)
- Race & ethnicity
- Black 54% Hispanic / Latino 27% White 9% Two or more races 8% Asian 5%
- Hispanic origin (detail)
- Mexican 4% Puerto Rican 6% Dominican 11%
- Common ancestry
- Hispanic 1% Scotch-Irish 1% Romanian 1%
- Foreign-born
- 27% · Canada, China, South Korea
- Languages at home
- 63% English-only · Spanish 21% French/Haitian/Cajun 5% Chinese 2%
Political lean MEDSL · New York
- 2024 margin
- Solid D (+64.8) · D 82.4% · R 17.6%
- 2008→2024 swing
- -7.4pp toward R · 2008: 72.2pp · 2024: 64.8pp
- All cycles
- 2024: D+64.8 2020: D+74.5 2016: D+77.2 2012: D+69.6 2008: D+72.2
Not yet ingested
- Civics
- —
Market trends
- HPI YoY
- ▲ 8.05%
- Current HPI
- 354.2971
- Rent YoY
- ▲ 8.84%
- Metro
- New York-Newark-Jersey City, NY-NJ-PA
- State GDP YoY
- ▲ 2.60%
- F500 in state
- 92
Industry mix (Fortune 500 HQ in NY)
| Industry | F500 HQs | Revenue |
|---|---|---|
| Financial Services | 10 | $950B |
|
||
| Consumer Goods | 9 | $162B |
|
||
| Insurance | 4 | $225B |
|
||
| Telecommunications | 2 | $144B |
|
||
| Pharmaceuticals | 2 | $112B |
|
||
| Media / Entertainment | 2 | $69B |
|
||
Price history
-2.8% since first listed7 events — show timeline
- 2026-05-27 Listed $1,895,000 RLS at REBNY
- 2019-10-18 Sold (Public Records) $1,750,000 Public Records
- 2019-10-11 Price Changed $1,750,000 RLS at REBNY
- 2019-07-20 Price Changed $1,890,000 RLS at REBNY
- 2018-11-29 Listed $1,750,000 RLS at REBNY
- 2018-11-29 Listed $1,950,000 RLS at REBNY
- 1997-07-02 Sold (Public Records) $500 Public Records
Property tax history
+15.8%/yrLatest (2025): $7,337 · +6.0% YoY. Source: county tax records.
Cash-flow waterfall
monthlySold comps — $/sqft
last 12 mo · ≤1 miLoading sold comps…