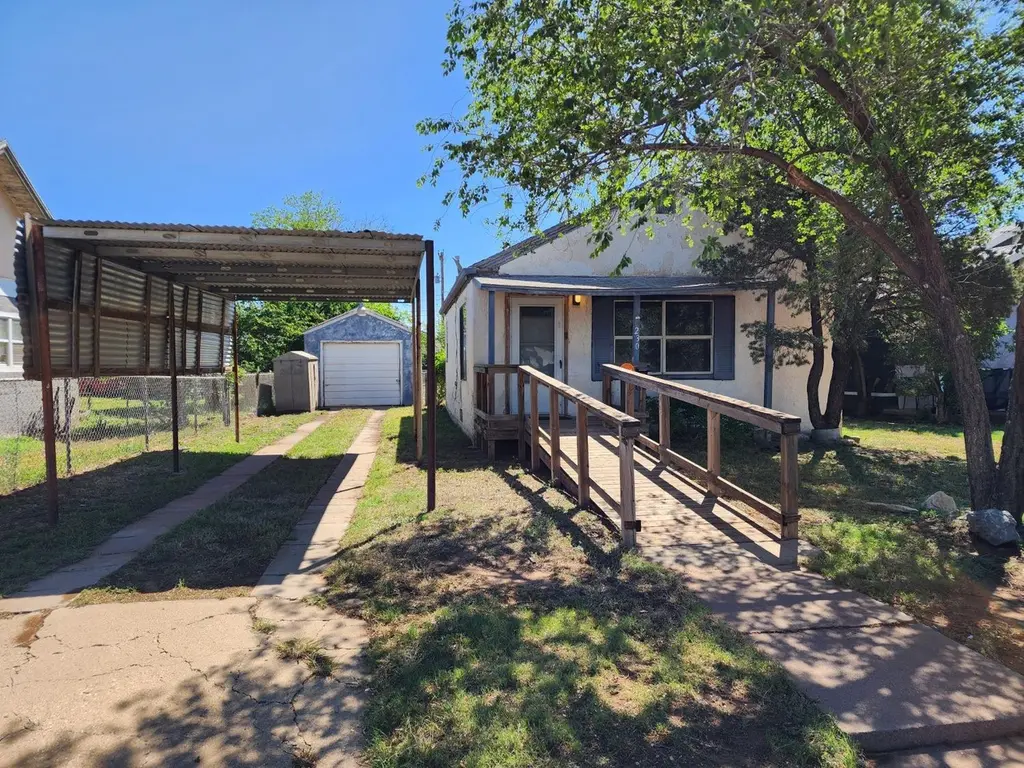
230 S 11th St · Slaton, TX
Flood risk 1/10 · Minimal
- FEMA flood zone
- X (unshaded)
- Chance of flooding over 30 yrs
- 0.0%
- Est. flood insurance / yr
- $507 – $1,088
Fire risk 1/10 · Minimal
- Est. fire insurance / yr
- $1,222 – $2,270
Heat risk 5/10 · Moderate
- Hot days now (above 100°F)
- 7 days/yr
- Hot days in 30 yrs
- 21 days/yr
Wind risk 2/10 · Minimal
- Chance of severe wind over 30 yrs
- 2.0%
Air-quality risk 1/10 · Minimal
- Unhealthy air days now
- 0 days/yr
- Unhealthy air days in 30 yrs
- 0 days/yr
Risk factors via First Street. Map © Google.
Why this score? — see what drove the B- grade
The composite is a weighted blend of 9 inputs, each scored 0–100. Each bar is that input's sub-score; the figure is the points it added to the 100-point composite (weight × sub-score).
- Cash flow +30.0/30.0
- 1% rule +10.0/10.0
- DSCR +10.0/10.0
- ARV discount +7.5/15.0
- Livability +3.5/5.0
- Rent growth +2.5/5.0
- Condition / age +2.5/5.0
- Schools +2.3/10.0
- Appreciation +0.4/10.0
$37,000
🖨 Deal sheet 📄 Offer letter ✓ Due diligence
Listing remarks MLS
Charming home with open concept. Great backyard area with several trees. This home needs some TLC,
Key facts
- Open concept
- Several trees
- Backyard area
Tags
Neighborhood map
What this means for you Summary
Snapshot
- This is a 2-bed/1.0-bath single-family listed at $37k.
Deal economics
- At list price, monthly cash flow is $298 ($4k/yr) — positive.
- The deal already cash-flows at list — no discount required.
- Meets the 1% rule at list price ($802 rent vs $37k).
- Recommended offer: $33k (12.0% below list) — sets the bar for market timing.
Location & tenants
- Location reads 70/100 on livability (#366 in TX) — a middle-class / working-renter tenant base. Strengths: cost of living A+, housing A+, health & safety A+; Watch: schools D, crime D, amenities F.
- Slaton ISD (town): math 25% / reading 30% proficiency, ranked #683 of 826 in TX (top 83%) — low school quality limits family demand, transient renter base, plan for 1-2y turnover; 73% free/reduced lunch — lower-income household profile, screen leases tightly.
- Market conditions: 71 active listings in the ZIP; 4 comparable units currently listed for rent nearby; rentals leasing fast (median 14d on market — plan ~1-2 weeks tenant-placement turnaround); 2,219 units permitted in Lubbock County in 2024 (252 in 5+ unit buildings).
Forward outlook
- Local home prices are declining (-3.0%/yr); year-one equity from $256 of loan paydown is wiped out by about $1k of value loss. Plan a longer hold.
- Lubbock County population projected at +39% by 2050 — long-run rental-demand tailwind backs the buy-and-hold thesis.
- At projected returns (-3.0% appreciation + 3.0% rent growth), your $10k cash investment doubles in ~4 years — after that, you're playing with house money.
Negotiation context
- It's been on market 157 days — a 12% lower offer ($33k) is reasonable based on typical stale-listing flexibility.
Risks & watch-outs
- Watch-outs: property tax is 4.1% of price; built in 1949 — expect roof / HVAC / electrical / plumbing capex.
- Climate carrying-cost: extreme-heat days projected 7→21/yr by 2055 (HVAC capex compounding) — expect insurance premiums to compound above CPI over the hold.
Questions for the listing agent
- It's been on market 157 days. Have you received any prior offers? Is the seller open to a 12% concession, seller financing, or rate buy-down credit?
- Built in 1949 — when were the roof, HVAC, electrical panel, plumbing, and water heater last replaced?
- Property tax is high relative to price — has the assessment been appealed recently, and will the sale trigger a re-assessment?
- Why hasn't it sold? Are there any deal-killer items the seller is aware of (foundation, flood, title, zoning, code violations)?
- Is there a deadline driving the sale (1031 exchange, divorce, estate, relocation)? That informs how much negotiation room exists.
- Schools are D-rated, which usually means shorter tenancies and higher turnover. Who's the typical renter profile here, and what's been the actual vacancy rate?
- Crime grade is D in this area — have there been break-ins, vandalism, or insurance claims at this property in the last 3 years? What carrier currently insures it and at what premium?
- What's the average days-on-market for RENTAL listings here right now (not sales)? A rising rental-DOM trend means longer vacancies and softer asking-rent achievability than the comps imply.
- What's the recent tenant-quality profile in this submarket — average credit score on applications, eviction rate, late-payment / NSF rate, and stable-employment percentage? A property-management company in the area should have these aggregated.
- How much new for-sale + rental construction is in the pipeline within 1–3 miles? Heavy new supply typically softens prices + rents 12–24 months out; constrained supply supports both.
Investment metrics
- 1% rule
- 2.17% ✓
- Cap rate
- 15.97%
- Cash-on-cash
- 34.56%
- DSCR
- 2.54
- GRM
- 3.8
CMA / ARV
No comps found within radius.
Projected returns pro-forma
-3.0% appreciation · 3.0% rent growth · sell at horizon
- IRR
- 30.1%
- Equity multiple
- 2.26×
- Total profit
- $13,066
- Equity at exit
- $5,517
- IRR
- 37.4%
- Equity multiple
- 4.48×
- Total profit
- $36,092
- Equity at exit
- $3,199
Cash invested: $10,360 (down + closing). Projections, not guarantees.
Landlord ↔ Tenant lean methodology
- Overall (STATE)
- 87 Strongly Landlord-Friendly
- State Texas
- 87 Strongly Landlord-Friendly · R+5
- County
- — inherits STATE
- City
- — inherits STATE
ZIP-level market 79364
- Home prices YoY
- -3.5%
- Active inventory
- 71
- Price-to-rent
- 3.8×
Monthly cashflow live
- Estimated rent
- $802 medium interval (Pro) →
- Mortgage (P&I)
- −$194
- Tax from tax record
- −$125 /mo · $1,505/yr
- Insurance
- −$15
- HOA
- −$0
- Vacancy / Maint / Mgmt
- −$168
- Net cashflow
- $298
Break-even live
UW: 25.0% down · 7.5% · 30yr · 1.5% tax · 5.0% vac · 8.0% maint · 8.0% mgmt
Financing live
Cash to close
- Down payment
- $9,250
- Closing costs
- $1,110
- Reserves months
- —
- Total cash needed
- —
Loan-product check · same deal, 3 products live
Conventional
25% down · 7.5% · 30yr
- Down + closing
- —
- Monthly P&I
- —
- Monthly cashflow
- —
- DSCR
- —
- Eligible?
- —
Personal DTI + credit; lowest rate.
DSCR
20% down · 8.5% · 30yr
- Down + closing
- —
- Monthly P&I
- —
- Monthly cashflow
- —
- DSCR
- —
- Eligible?
- —
No personal income docs; deal must DSCR.
Hard money
10% down · 12.0% · 12mo
- Down + closing
- —
- Monthly P&I
- —
- Monthly cashflow
- —
- DSCR
- —
- Eligible?
- —
Short-term bridge; refi at stabilization.
Rent comps 4 comps
| Address | Beds | Baths | Sqft | Rent | $/sqft | DOM | Units | Dist |
|---|---|---|---|---|---|---|---|---|
| 230 E Panhandle St Slaton, TX | 3.0 | 1.0 | 864 | $725 | $0.84 | 13d | 1 | 0.34mi |
| 950 S 10th St Slaton, TX | 3.0 | 2.0 | 1104 | $899 | $0.81 | 13d | 1 | 0.41mi |
| 220 N 6th St Slaton, TX | 3.0 | 1.0 | 926 | $900 | $0.97 | 13d | 1 | 0.43mi |
| 1510 S 9th St Slaton, TX | 1.0–2.0 | 1.0 | 662 | $620 | $0.94 | 13d | 4 | 0.80mi |
Listing history 22 events
-
2026-06-18days on market $37,000 Active 157 DOM
-
2026-06-17days on market $37,000 Active 156 DOM
-
2026-06-16days on market $37,000 Active 155 DOM
-
2026-06-15days on market $37,000 Active 154 DOM
-
2026-06-14days on market $37,000 Active 152 DOM
-
2026-06-10days on market $37,000 Active 149 DOM
-
2026-06-09days on market $37,000 Active 148 DOM
-
2026-06-08days on market $37,000 Active 147 DOM
-
2026-06-07days on market $37,000 Active 146 DOM
-
2026-06-05days on market $37,000 Active 143 DOM
-
2026-06-03days on market $37,000 Active 142 DOM
-
2026-06-02days on market $37,000 Active 141 DOM
-
2026-06-01days on market $37,000 Active 140 DOM
-
2026-05-31days on market $37,000 Active 139 DOM
-
2026-05-30days on market $37,000 Active 138 DOM
-
2026-03-25price $37,000 98-char remark
Show marketing remark (98 chars)
Charming home with open concept. Great backyard area with several trees. This home needs some TLC,
-
2026-01-12$49,900 Active 98-char remark
Show marketing remark (98 chars)
Charming home with open concept. Great backyard area with several trees. This home needs some TLC,
-
2025-11-12price $49,900
-
2025-05-30price $54,900
-
2024-10-30price $57,000
-
2024-07-24price $60,000
-
1992-04-01soldstatus
ⓘ Source: listings_history table (triggers on properties + properties_extension) + one-shot
backfill from property_details.listing_events for pre-trigger history.
Tax reassessment forecast TX · Resets to sale price
- Current annual tax
- $1,505 · $125/mo
- Projected year-2 tax
- $1,505 · $125/mo
- Expected delta
- $0/yr ($0/mo · 0.0%)
ⓘ Screening estimate from a state-policy table — verify with the county assessor before closing.
Climate risk First Street
- Flood 1/10 Low FEMA zone X (unshaded) · 0% chance over 30 yrs
- Wildfire 1/10 Low
- Heat 5/10 Major 7 d/yr ≥100°F today · 21 d/yr by 30 yrs out
- Wind 2/10 Low 2% chance of damaging wind over 30 yrs
- Air quality 1/10 Low 0 unhealthy d/yr today · 0 by 30 yrs out
Nearby sold comps map
Loading sold comps map…
Walkable amenities ~0.75 mi
Loading nearby amenities…
Taxation est. · year 1
- Rental income
- $9,619
- − Mortgage interest
- −$2,073
- − Property taxes
- −$1,505
- − Insurance
- −$185
- − Repairs & maintenance
- −$769
- − Management
- −$769
- − Depreciation
- −$1,076
- Taxable income
- $3,240
- Est. tax owed @ 24.0%
- −$778
- After-tax cash flow
- $2,802/yr
For passive investors: Depreciation is non-cash, so a rental often shows a tax loss while cash-flowing — sheltering income. Rental losses are passive: they offset passive income freely, and up to $25,000/yr can offset ordinary (W-2) income if you actively participate and your MAGI is under $100k (phasing out to $0 by $150k); unused losses carry forward. On sale, claimed depreciation is recaptured at up to 25%, and gains may owe capital-gains tax (a 1031 exchange can defer both). Figures are a year-1 estimate at your 24.0% rate — not tax advice; consult a CPA.
Schools (NCES district)
- District
- Slaton ISD
- NCES district ID
- 4840440
- Math proficiency
- 25% ▼ -17.00%
- Reading proficiency
- 30% ▼ -8.00%
- Median HH income
- $39,870
- Composite
- 23.15/100
- National rank
- #7950
- State rank
- #683 of 826 in TX
Livability — Slaton
- Score
- 70/100
- State rank
- #366
- US rank
- #7796
Category grades
Schools grade is shown separately in the Schools card above.
Census & demographics
- Census place
- Slaton, TX
- Population (ZIP)
- 7,135
Population outlook (Lubbock County) Hauer SSP2
- Today (2025)
- 345,960 people
- By 2030
- 371,449 · +7.4%
- By 2040
- 424,539 · +22.7%
- By 2050
- 481,150 · +39.1%
- By 2075
- 633,467 · +83.1%
- By 2100
- 746,853 · +115.9%
Race, ethnicity, and origin ACS 2023
- Neighborhood character
- Diverse neighborhood (Simpson 0.56)
- Race & ethnicity
- White 51% Hispanic / Latino 43% Black 6% Two or more races 4%
- Hispanic origin (detail)
- Mexican 32% Puerto Rican 3%
- Common ancestry
- Hispanic 3% Lithuanian 2% Italian 1%
- Foreign-born
- 6% · Canada
- Languages at home
- 75% English-only · Spanish 24%
Political lean MEDSL · Lubbock
- 2024 margin
- Solid R (+39.5) · D 29.7% · R 69.2% · Other 1.0%
- 2008→2024 swing
- -2.8pp toward R · 2008: -36.7pp · 2024: -39.5pp
- All cycles
- 2024: R+39.5 2020: R+32.2 2016: R+38.4 2012: R+40.9 2008: R+36.7
Not yet ingested
- Civics
- —
Market trends
- HPI YoY
- ▼ -9.15%
- Current HPI
- 250.89
- Rent YoY
- —
- Metro
- —
- State GDP YoY
- ▲ 3.95%
- F500 in state
- 110
Industry mix (Fortune 500 HQ in TX)
| Industry | F500 HQs | Revenue |
|---|---|---|
| Energy | 16 | $1,198B |
|
||
| Technology | 5 | $198B |
|
||
| Engineering / Construction | 4 | $72B |
|
||
| Energy Services | 3 | $60B |
|
||
| Utilities | 3 | $41B |
|
||
| Healthcare | 2 | $330B |
|
||
Price history
-38.3% since first listed7 events — show timeline
- 2026-03-25 Price Changed $37,000 LARMLS
- 2026-01-12 Listed $49,900 LARMLS
- 2025-11-12 Price Changed $49,900 LARMLS
- 2025-05-30 Price Changed $54,900 LARMLS
- 2024-10-30 Price Changed $57,000 LARMLS
- 2024-07-24 Price Changed $60,000 LARMLS
- 1992-04-01 Sold (Public Records) — Public Records
Property tax history
+5.9%/yrLatest (2025): $1,505 · +4.1% YoY. Source: county tax records.
Cash-flow waterfall
monthlySold comps — $/sqft
last 12 mo · ≤1 miLoading sold comps…