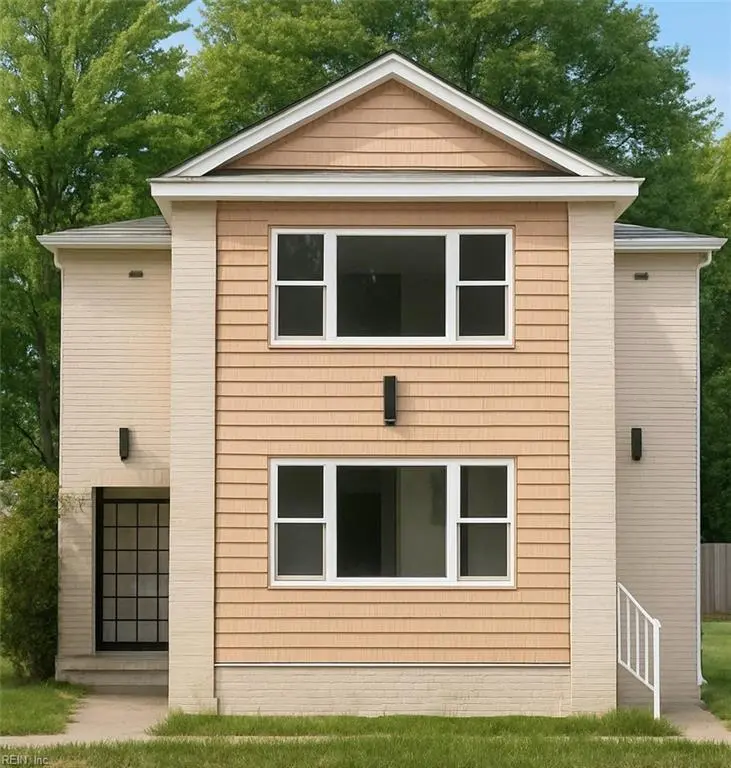
552 2nd Ave · Suffolk, VA
Flood risk 1/10 · Minimal
- FEMA flood zone
- X (unshaded)
- Chance of flooding over 30 yrs
- 0.0%
- Est. flood insurance / yr
- $507 – $1,088
Fire risk 3/10 · Minor
- Est. fire insurance / yr
- $666 – $1,236
Heat risk 9/10 · Severe
- Hot days now (above 109°F)
- 7 days/yr
- Hot days in 30 yrs
- 16 days/yr
Wind risk 8/10 · Major
- Chance of severe wind over 30 yrs
- 80.0%
Air-quality risk 2/10 · Minimal
- Unhealthy air days now
- 0 days/yr
- Unhealthy air days in 30 yrs
- 1 days/yr
Risk factors via First Street. Map © Google.
Why this score? — see what drove the D grade
The composite is a weighted blend of 9 inputs, each scored 0–100. Each bar is that input's sub-score; the figure is the points it added to the 100-point composite (weight × sub-score).
- Cash flow +13.2/30.0
- ARV discount +7.5/15.0
- Schools +4.8/10.0
- DSCR +4.0/10.0
- Rent growth +4.0/5.0
- Livability +3.9/5.0
- 1% rule +3.0/10.0
- Condition / age +2.5/5.0
- Appreciation +0.0/10.0
$299,900
🖨 Deal sheet (PDF) 📄 Offer letter ✓ Due diligence
Listing remarks
Beautiful dream home with almost 2200 sq ft. Meticulously remodeled with only the finest materials. Tall ceilings with lots of windows. Gourmet kitchen with granite countertops and new stainless appliances. Beautiful hardwood floors. Primary suite with jetted tub, walk in closet, and sitting room. Hall bath with cathedral ceiling and skylight. Deck and plenty of parking. No condo or HOA fees.
Key facts
- Gourmet kitchen
- Jetted tub
- Walk in closet
Tags
Neighborhood map
What this means for you Summary
Snapshot
- This is a 3-bed/3.5-bath condo listed at $300k.
Deal economics
- At list price, monthly cash flow is $-5 ($-65/yr) — negative.
- To cash-flow at today's rent, offer at most $299k (0.3% below list).
- To meet the 1% rule (rent ≥ 1% of price), the offer needs to be $241k (19.8% below list).
- Recommended offer: $241k (19.8% below list) — sets the bar for 1% rule.
- Cap rate 6.3% vs local median 3.5% in Suffolk — top-decile yield for the area; either an underpriced asset or a hidden risk that comps aren't pricing in. Stress-test before assuming the spread holds.
Location & tenants
- Location reads 77/100 on livability (#88 in VA, #2,896 nationally) — a middle-class / working-renter tenant base. Strengths: housing A+, health & safety A+, employment A-; Watch: crime C-, commute F.
- Suffolk City Public School District (suburban): math 41% / reading 69% proficiency, ranked #72 of 131 in VA (top 55%) — acceptable for families but not a draw, mixed tenant base, ~2y average lease.
- Zoned schools: Elephant'S Fork Elementary (math 39% / reading 57%, grade D, #787 of 1,108 statewide, top 72%, 599 students, 65% FRL); King'S Fork Middle (math 33% / reading 61%, grade D+, #257 of 342 statewide, top 77%, 1,031 students, 63% FRL); King'S Fork High (math 44% / reading 77%, grade C+, #244 of 319 statewide, top 77%, 1,697 students, 63% FRL) — zoned schools average 64% FRL vs 39% district-wide (24 pts higher); higher-poverty schools than district average — tighter screening recommended.
- Market conditions: Rents rising fast (+5.8%/yr); 546 active listings in the ZIP; 8 comparable units currently listed for rent nearby; rentals at typical pace (median 26d on market — plan ~3-4 weeks tenant-placement turnaround); solid renter incomes; 680 units permitted in Suffolk city in 2024 (0 in 5+ unit buildings).
- This rent runs 36% of the median local income ($80k/yr) — at the standard rent-burdened threshold; future hikes will face affordability resistance.
Forward outlook
- Local home prices are declining (-3.0%/yr); year-one equity from $2k of loan paydown is wiped out by about $9k of value loss. Plan a longer hold.
- Suffolk County population projected at +11% by 2050 — modest demand growth; plan on rents tracking national, not racing it.
Negotiation context
- It's been on market 20 days — a 2% lower offer ($295k) is reasonable based on typical stale-listing flexibility.
- 9 sale attempts since 9y ago with the ask held roughly flat each time — persistent listings suggest the price (not the market) is what's stuck; bring a comps-based counter.
Risks & watch-outs
- Watch-outs: built in 1954 — expect roof / HVAC / electrical / plumbing capex.
- Climate carrying-cost: severe wind risk, 80% chance of damaging wind over 30y; extreme-heat days projected 7→16/yr by 2055 (HVAC capex compounding) — expect insurance premiums to compound above CPI over the hold.
Questions for the listing agent
- What do current leases actually rent for vs. the listed asking? Can we see a recent rent roll and the last 12 months of T-12 income?
- Built in 1954 — when were the roof, HVAC, electrical panel, plumbing, and water heater last replaced?
- Any open or pending special assessments — roof, HVAC, plumbing, elevator, façade? What's the per-unit balance and payoff schedule, and is the seller paying it off at close or rolling it to the buyer?
- Is there a deadline driving the sale (1031 exchange, divorce, estate, relocation)? That informs how much negotiation room exists.
- Schools are A-rated — typically a magnet for longer-tenancy family renters. What's the average tenant stay here, and is there a school-zone premium baked into asking?
- The area grade is low — what's the realistic commute time and amenity access for the typical tenant pool here? Any planned neighborhood developments (good or bad) we should know about?
- What's the average days-on-market for RENTAL listings here right now (not sales)? A rising rental-DOM trend means longer vacancies and softer asking-rent achievability than the comps imply.
- What's the recent tenant-quality profile in this submarket — average credit score on applications, eviction rate, late-payment / NSF rate, and stable-employment percentage? A property-management company in the area should have these aggregated.
- How much new apartment / multifamily construction is in the pipeline within 1–3 miles? Heavy new supply (>2% of stock underway) typically softens rents 12–24 months out; light construction supports rent growth.
Investment metrics
- 1% rule
- 0.80% ✗
- Cap rate
- 6.27%
- Cash-on-cash
- -0.08%
- DSCR
- 1.00
- GRM
- 10.4
CMA / ARV
No comps found within radius.
Projected returns pro-forma
-3.0% appreciation · 5.84% rent growth · sell at horizon
- IRR
- -13.6%
- Equity multiple
- 0.50×
- Total profit
- $-41,937
- Equity at exit
- $44,716
- IRR
- -1.0%
- Equity multiple
- 0.92×
- Total profit
- $-6,469
- Equity at exit
- $25,930
Cash invested: $83,972 (down + closing). Projections, not guarantees.
Landlord ↔ Tenant lean methodology
- Overall (STATE)
- 55 Moderately Landlord-Leaning
- State Virginia
- 55 Moderately Landlord-Leaning · D+2
- County
- — inherits STATE
- City
- — inherits STATE
ZIP-level market 23434
- Rents YoY
- 5.8%
- Active inventory
- 546
- Price-to-rent
- 10.4×
Monthly cashflow live
- Estimated rent
- $2,407 high interval (Pro) →
- Mortgage (P&I)
- −$1,573
- Tax from tax record
- −$209 /mo · $2,508/yr
- Insurance
- −$125
- HOA
- −$0
- Vacancy / Maint / Mgmt
- −$505
- Net cashflow
- $-5
Break-even live
Sensitivity live
| Price | -10% $164 | -5% $79 | +0% $-5 | +5% $-90 | +10% $-175 |
|---|---|---|---|---|---|
| Rent | -10% $-196 | -5% $-101 | +0% $-5 | +5% $90 | +10% $185 |
| Rate | -1.0pp $146 | -0.5pp $71 | base $-5 | +0.5pp $-83 | +1.0pp $-162 |
UW: 25.0% down · 7.5% · 30yr · 1.5% tax · 5.0% vac · 8.0% maint · 8.0% mgmt
Financing live
Cash to close
- Down payment
- $74,975
- Closing costs
- $8,997
- Reserves months
- —
- Total cash needed
- —
Loan-product check · same deal, 3 products live
Conventional
25% down · 7.5% · 30yr
- Down + closing
- —
- Monthly P&I
- —
- Monthly cashflow
- —
- DSCR
- —
- Eligible?
- —
Personal DTI + credit; lowest rate.
DSCR
20% down · 8.5% · 30yr
- Down + closing
- —
- Monthly P&I
- —
- Monthly cashflow
- —
- DSCR
- —
- Eligible?
- —
No personal income docs; deal must DSCR.
Hard money
10% down · 12.0% · 12mo
- Down + closing
- —
- Monthly P&I
- —
- Monthly cashflow
- —
- DSCR
- —
- Eligible?
- —
Short-term bridge; refi at stabilization.
Rent comps 8 comps
| Address | Beds | Baths | Sqft | Rent | $/sqft | DOM | Units | Dist |
|---|---|---|---|---|---|---|---|---|
| 808 Gittings St Suffolk, VA | 4.0 | 2.5 | 2187 | $2,500 | $1.14 | 25d | 1 | 0.30mi |
| 124 Linden Ave Suffolk, VA | 4.0 | 2.5 | 2568 | $2,795 | $1.09 | 45d | 1 | 0.35mi |
| 621 Butler Ave Suffolk, VA | 3.0 | 2.5 | 1760 | $2,500 | $1.42 | 25d | 1 | 0.52mi |
| 525 Kilby Ave Suffolk, VA | 3.0 | 2.5 | 1776 | $2,500 | $1.41 | 25d | 1 | 0.89mi |
| 315 Highland Ave Suffolk, VA | 3.0 | 2.0 | 1580 | $2,050 | $1.30 | 25d | 1 | 1.11mi |
| 131 Brookside Ln Suffolk, VA | 4.0 | 2.5 | 2005 | $2,800 | $1.40 | 45d | 1 | 1.24mi |
| 124 Halifax St Suffolk, VA | 4.0 | 2.0 | 1728 | $2,100 | $1.22 | 45d | 1 | 1.29mi |
| 307 N 4th St Suffolk, VA | 4.0 | 2.0 | 1600 | $1,800 | $1.12 | 9d | 1 | 1.40mi |
HOA detail condo
- Monthly dues
- $0 · $0/yr
- Assessments
- None detected in remarks — confirm with the listing agent.
Listing history 24 events
-
2026-03-28status Under Contract
-
2026-03-19status Active
-
2026-03-14historical Active Under Contract
-
2026-03-08$299,900 Active
-
2025-10-31historical
-
2025-10-01$294,900 Active
-
2025-09-30historical
-
2025-09-27price $294,900
-
2025-08-20status Active
-
2025-08-19historical
-
2025-07-19$299,900 Active
-
2025-05-21historical
-
2025-04-30price $319,900
-
2025-04-21$329,900 Active
-
2020-09-28status Under Contract
-
2020-09-15price $130,500
-
2020-08-20$144,600 Active
-
2018-10-28historical
-
2018-09-07status Active
-
2018-08-03historical
-
2018-07-25price $100,000
-
2018-02-13price $110,000
-
2018-01-12price $130,000
-
2017-11-06$150,000 Active
ⓘ Source: listings_history table (triggers on properties + properties_extension) + one-shot
backfill from property_details.listing_events for pre-trigger history.
Tax reassessment forecast VA · Resets to sale price
- Current annual tax
- $2,508 · $209/mo
- Projected year-2 tax
- $2,508 · $209/mo
- Expected delta
- $0/yr ($0/mo · 0.0%)
ⓘ Screening estimate from a state-policy table — verify with the county assessor before closing.
Climate risk First Street
- Flood 1/10 Low FEMA zone X (unshaded) · 0% chance over 30 yrs
- Wildfire 3/10 Moderate
- Heat 9/10 Extreme 7 d/yr ≥109°F today · 16 d/yr by 30 yrs out
- Wind 8/10 Severe 80% chance of damaging wind over 30 yrs
- Air quality 2/10 Low 0 unhealthy d/yr today · 1 by 30 yrs out
Nearby sold comps map
Loading sold comps map…
Walkable amenities ~0.75 mi
Loading nearby amenities…
Taxation est. · year 1
- Rental income
- $28,879
- − Mortgage interest
- −$16,799
- − Property taxes
- −$2,508
- − Insurance
- −$1,500
- − Repairs & maintenance
- −$2,310
- − Management
- −$2,310
- − Depreciation
- −$8,724
- Taxable loss
- −$5,272
- Est. tax savings @ 24.0%
- +$1,265
- After-tax cash flow
- $1,200/yr
For passive investors: Depreciation is non-cash, so a rental often shows a tax loss while cash-flowing — sheltering income. Rental losses are passive: they offset passive income freely, and up to $25,000/yr can offset ordinary (W-2) income if you actively participate and your MAGI is under $100k (phasing out to $0 by $150k); unused losses carry forward. On sale, claimed depreciation is recaptured at up to 25%, and gains may owe capital-gains tax (a 1031 exchange can defer both). Figures are a year-1 estimate at your 24.0% rate — not tax advice; consult a CPA.
Schools (NCES district)
- District
- Suffolk City Public School District
- NCES district ID
- 5103710
- Math proficiency
- 41% ▼ -43.00%
- Reading proficiency
- 69% ▼ -8.00%
- Median HH income
- $65,573
- Composite
- 48.31/100
- National rank
- #2151
- State rank
- #72 of 131 in VA
Livability — Suffolk
- Score
- 77/100
- State rank
- #88
- US rank
- #2896
Category grades
Schools grade is shown separately in the Schools card above.
Census & demographics
- Census place
- Suffolk, VA
- County
- Suffolk City · 88,108 people
- City population
- 88,108
- Metro
- Virginia Beach-Norfolk-Newport News, VA-NC
- Population (ZIP)
- 54,387
- Household income
- $79,877
- Rent vs Own
- Severe rent burden
- 1934.0
Population outlook (Suffolk County) Hauer SSP2
- Today (2025)
- 95,269 people
- By 2030
- 98,269 · +3.1%
- By 2040
- 103,177 · +8.3%
- By 2050
- 105,777 · +11.0%
- By 2075
- 110,963 · +16.5%
- By 2100
- 103,711 · +8.9%
Race, ethnicity, and origin ACS 2023
- Neighborhood character
- Diverse neighborhood (Simpson 0.58)
- Race & ethnicity
- Black 49% White 41% Two or more races 5% Hispanic / Latino 4% Asian 1%
- Common ancestry
- Lithuanian 1% Slovak 1% Italian 1%
- Foreign-born
- 3% · Canada
- Languages at home
- 96% English-only · Spanish 2%
Political lean MEDSL · Suffolk
- 2024 margin
- D (+15.9) · D 57.4% · R 41.5% · Other 1.2%
- 2008→2024 swing
- +2.7pp toward D · 2008: 13.2pp · 2024: 15.9pp
- All cycles
- 2024: D+15.9 2020: D+17.3 2016: D+13.8 2012: D+15.1 2008: D+13.2
Not yet ingested
- Civics
- —
Market trends
- HPI YoY
- ▼ -383.80%
- Current HPI
- 158.5866
- Rent YoY
- ▲ 5.84%
- Metro
- Virginia Beach-Norfolk-Newport News, VA-NC
- State GDP YoY
- ▲ 2.40%
- F500 in state
- 50
Industry mix (Fortune 500 HQ in VA)
| Industry | F500 HQs | Revenue |
|---|---|---|
| Aerospace / Defense | 4 | $236B |
|
||
| Technology / Defense | 3 | $32B |
|
||
| Financial Services | 2 | $176B |
|
||
| Utilities | 2 | $27B |
|
||
| Insurance | 2 | $25B |
|
||
| Technology | 2 | $15B |
|
||
Price history
+99.9% since first listed24 events — show timeline
- 2026-03-28 Pending — REINMLS
- 2026-03-19 Relisted — REINMLS
- 2026-03-14 Contingent — REINMLS
- 2026-03-08 Listed $299,900 REINMLS
- 2025-10-31 Listing Removed — REINMLS
- 2025-10-01 Listed $294,900 REINMLS
- 2025-09-30 Listing Removed — REINMLS
- 2025-09-27 Price Changed $294,900 REINMLS
- 2025-08-20 Relisted — REINMLS
- 2025-08-19 Listing Removed — REINMLS
- 2025-07-19 Listed $299,900 REINMLS
- 2025-05-21 Listing Removed — REINMLS
- 2025-04-30 Price Changed $319,900 REINMLS
- 2025-04-21 Listed $329,900 REINMLS
- 2020-09-28 Pending — REINMLS
- 2020-09-15 Price Changed $130,500 REINMLS
- 2020-08-20 Listed $144,600 REINMLS
- 2018-10-28 Listing Removed — REINMLS
- 2018-09-07 Relisted — REINMLS
- 2018-08-03 Listing Removed — REINMLS
- 2018-07-25 Price Changed $100,000 REINMLS
- 2018-02-13 Price Changed $110,000 REINMLS
- 2018-01-12 Price Changed $130,000 REINMLS
- 2017-11-06 Listed $150,000 REINMLS
Property tax history
+0.2%/yrLatest (2025): $2,508 · +3.7% YoY. Source: county tax records.
Cash-flow waterfall
monthlySold comps — $/sqft
last 12 mo · ≤1 miLoading sold comps…