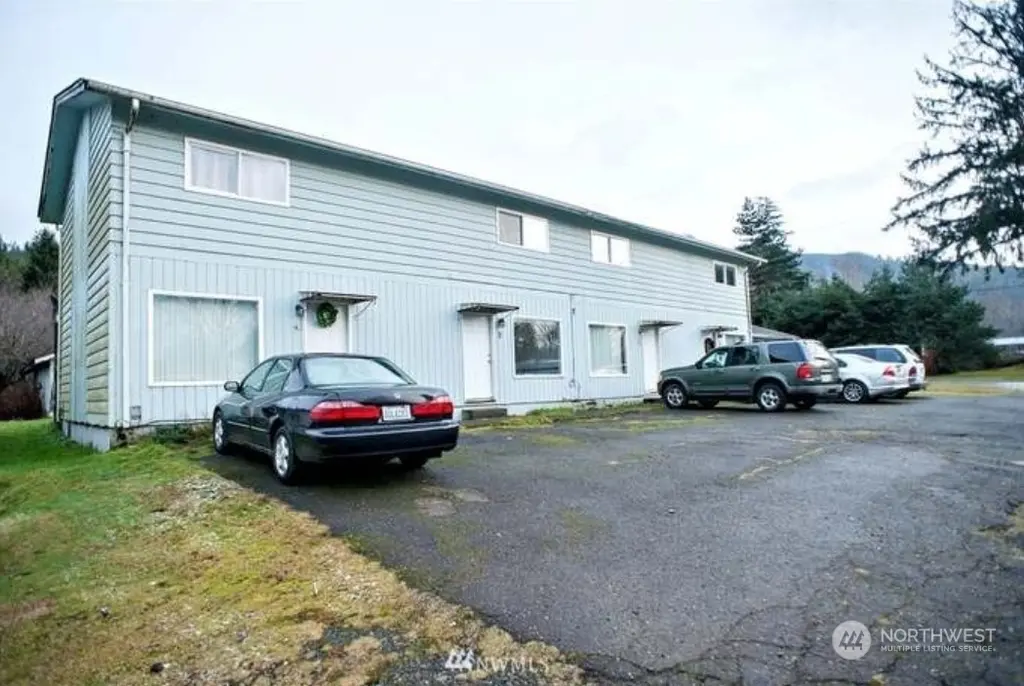
 Fourplex
7 Neilton Ln · Neilton, WA
Flood risk 1/10 · Minimal
- FEMA flood zone
- D
- Chance of flooding over 30 yrs
- 0.0%
- Est. flood insurance / yr
- $544 – $1,084
Fire risk 1/10 · Minimal
- Est. fire insurance / yr
- $604 – $1,122
Heat risk 1/10 · Minimal
- Hot days now (above 84°F)
- 7 days/yr
- Hot days in 30 yrs
- 13 days/yr
Wind risk 1/10 · Minimal
- Chance of severe wind over 30 yrs
- —
Air-quality risk 6/10 · Moderate
- Unhealthy air days now
- 6 days/yr
- Unhealthy air days in 30 yrs
- 7 days/yr
Risk factors via First Street. Map © Google.
Why this score? — see what drove the C grade
The composite is a weighted blend of 9 inputs, each scored 0–100. Each bar is that input's sub-score; the figure is the points it added to the 100-point composite (weight × sub-score).
- Cash flow +22.1/30.0
- ARV discount +7.5/15.0
- DSCR +7.1/10.0
- 1% rule +5.8/10.0
- Appreciation +5.0/10.0
- Schools +3.1/10.0
- Livability +2.9/5.0
- Rent growth +2.5/5.0
- Condition / age +2.2/5.0
$375,000
🖨 Deal sheet 📄 Offer letter ✓ Due diligence
Multi-family units
County records classify this as Multi-Family (2-4 Unit). Listing-text estimate: 4 units. confirmed
Listing remarks
Attention investors! 4 unit building in Neilton WA that has not had a vacancy in Years and has below market rent. Fantastic income potential and close to lake Quinault. 4th Unit has an unfinished 3rd bedroom/ 2nd bath addition, rent was planned on being set at 1200. each unit right now has 2 bedrooms one bath up with kitchen, dining & living downstairs. W/ D hook ups in kitchen. additional huge shed/ shop in back for additional storage / rental income
Key facts
- 4 unit building
- 0.31 acre lot
- 13 parking spots
Tags
Neighborhood map
What this means for you Summary
Snapshot
- This is a 4 × 2-bed/1-bath units multifamily listed at $375k. Condition is rated fair.
Deal economics
- At list price, monthly cash flow is $605 ($7k/yr) — positive. Per door: $151/mo.
- The deal already cash-flows at list — no discount required.
- Meets the 1% rule at list price ($4k rent vs $375k).
- Recommended offer: $330k (12.0% below list) — sets the bar for market timing.
Location & tenants
- Location reads 57/100 on livability (#535 in WA) — a working-class tenant base; expect higher turnover. Strengths: cost of living A+; Watch: health & safety C-, schools F, crime F.
- Lake Quinault School District (rural): math 30% / reading 35% proficiency, ranked #260 of 291 in WA (top 89%) — families likely to look elsewhere, expect single-tenant / working-renter base with shorter leases; 83% free/reduced lunch — lower-income household profile, screen leases tightly.
- Market conditions: 10 active listings in the ZIP; 297 units permitted in Grays Harbor County in 2024 (17 in 5+ unit buildings).
Forward outlook
- In year one you build about $14k of equity ($3k loan paydown + $11k appreciation (3.0% local appreciation)).
- Grays Harbor County population projected at -24% by 2050 — secular population decline; favor cash flow + early exit over multi-decade hold.
- At projected returns (3.0% appreciation + 3.0% rent growth), your $105k cash investment doubles in ~5 years — after that, you're playing with house money.
- By year 3, paydown + projected appreciation supports a ~$34k cash-out refi (75% LTV) — recoverable capital for the next deal without selling this one.
Negotiation context
- It's been on market 393 days — a 12% lower offer ($330k) is reasonable based on typical stale-listing flexibility.
- 5 sale attempts since 21y ago; this cycle's ask has dropped $20k (5%) from the opening price — seller is motivated, your offer sets the floor, not the list.
- Current owner paid $140k; list at $375k implies a 168% gain — meaningful room to come down on a strong offer.
Questions for the listing agent
- It's been on market 393 days. Have you received any prior offers? Is the seller open to a 12% concession, seller financing, or rate buy-down credit?
- Can we see the unit-by-unit rent roll, current vacancy, and any below-market leases? What's the average tenancy length?
- What capital expenditures (roof, boiler, parking lot, exteriors) have been made in the last 5 years, and what's planned in the next 2?
- Have any recent inspections been done? Can we get a copy of the seller's disclosures and any deferred-maintenance estimates?
- Built in 1965 — when were the roof, HVAC, electrical panel, plumbing, and water heater last replaced?
- Why hasn't it sold? Are there any deal-killer items the seller is aware of (foundation, flood, title, zoning, code violations)?
- Is there a deadline driving the sale (1031 exchange, divorce, estate, relocation)? That informs how much negotiation room exists.
- Schools are F-rated, which usually means shorter tenancies and higher turnover. Who's the typical renter profile here, and what's been the actual vacancy rate?
- Crime grade is F in this area — have there been break-ins, vandalism, or insurance claims at this property in the last 3 years? What carrier currently insures it and at what premium?
- What's the average days-on-market for RENTAL listings here right now (not sales)? A rising rental-DOM trend means longer vacancies and softer asking-rent achievability than the comps imply.
- What's the recent tenant-quality profile in this submarket — average credit score on applications, eviction rate, late-payment / NSF rate, and stable-employment percentage? A property-management company in the area should have these aggregated.
- How much new apartment / multifamily construction is in the pipeline within 1–3 miles? Heavy new supply (>2% of stock underway) typically softens rents 12–24 months out; light construction supports rent growth.
Investment metrics
- 1% rule
- 1.08% ✓
- Cap rate
- 8.23%
- Cash-on-cash
- 6.91%
- DSCR
- 1.31
- GRM
- 7.7
CMA / ARV
No comps found within radius.
Projected returns pro-forma
3.0% appreciation · 3.0% rent growth · sell at horizon
- IRR
- 14.0%
- Equity multiple
- 1.80×
- Total profit
- $83,755
- Equity at exit
- $168,616
- IRR
- 15.8%
- Equity multiple
- 3.33×
- Total profit
- $244,319
- Equity at exit
- $259,858
Cash invested: $105,000 (down + closing). Projections, not guarantees.
Landlord ↔ Tenant lean methodology
- Overall (STATE)
- 28 Tenant-Leaning
- State Washington
- 28 Tenant-Leaning · D+8
- County
- — inherits STATE
- City
- — inherits STATE
ZIP-level market 98552
- Active inventory
- 10
- Price-to-rent
- 30.9×
Monthly cashflow live
- Estimated rent
- $4,046 medium interval (Pro) →
- Mortgage (P&I)
- −$1,967
- Tax est. 1.5%
- −$469 /mo · $5,625/yr
- Insurance
- −$156
- HOA
- −$0
- Vacancy / Maint / Mgmt
- −$850
- Net cashflow
- $605
Break-even live
4-unit breakdown (identical units grouped — click to expand)
| Units | Beds | Baths | Est. rent |
|---|---|---|---|
| 4× units | 2 | 1 | $4,048 |
| #1 | 2 | 1 | $1,012 |
| #2 | 2 | 1 | $1,012 |
| #3 | 2 | 1 | $1,012 |
| #4 | 2 | 1 | $1,012 |
| Total (4 units) | $4,046 | ||
UW: 25.0% down · 7.5% · 30yr · 1.5% tax · 5.0% vac · 8.0% maint · 8.0% mgmt
Financing live
Cash to close
- Down payment
- $93,750
- Closing costs
- $11,250
- Reserves months
- —
- Total cash needed
- —
Loan-product check · same deal, 3 products live
Conventional
25% down · 7.5% · 30yr
- Down + closing
- —
- Monthly P&I
- —
- Monthly cashflow
- —
- DSCR
- —
- Eligible?
- —
Personal DTI + credit; lowest rate.
DSCR
20% down · 8.5% · 30yr
- Down + closing
- —
- Monthly P&I
- —
- Monthly cashflow
- —
- DSCR
- —
- Eligible?
- —
No personal income docs; deal must DSCR.
Hard money
10% down · 12.0% · 12mo
- Down + closing
- —
- Monthly P&I
- —
- Monthly cashflow
- —
- DSCR
- —
- Eligible?
- —
Short-term bridge; refi at stabilization.
Listing history 24 events
-
2026-06-19days on market $375,000 Active 393 DOM
-
2026-06-18days on market $375,000 Active 392 DOM
-
2026-06-17days on market $375,000 Active 391 DOM
-
2026-06-16days on market $375,000 Active 390 DOM
-
2026-06-15days on market $375,000 Active 389 DOM
-
2026-06-14days on market $375,000 Active 387 DOM
-
2026-06-12days on market $375,000 Active 386 DOM
-
2026-06-08days on market $375,000 Active 382 DOM
-
2026-06-07days on market $375,000 Active 381 DOM
-
2026-06-02days on market $375,000 Active 376 DOM
-
2026-06-01days on market $375,000 Active 375 DOM
-
2026-05-31days on market $375,000 Active 374 DOM
-
2026-05-30days on market $375,000 Active 373 DOM
-
2025-12-12status Active
-
2025-01-22price $375,000
-
2024-10-08$395,000 Active
-
2018-01-18soldstatus $140,000 Sold
-
2017-10-26status Pending
-
2017-10-04status Pending Inspection
-
2017-07-18status Active
-
2017-06-14historical Expired
-
2016-12-27$160,000 Active
-
2005-05-06soldstatus $122,500
-
2005-01-10$125,000
ⓘ Source: listings_history table (triggers on properties + properties_extension) + one-shot
backfill from property_details.listing_events for pre-trigger history.
Climate risk First Street
- Flood 1/10 Low FEMA zone D · 0% chance over 30 yrs
- Wildfire 1/10 Low
- Heat 1/10 Low 7 d/yr ≥84°F today · 13 d/yr by 30 yrs out
- Wind 1/10 Low
- Air quality 6/10 Major 6 unhealthy d/yr today · 7 by 30 yrs out
Nearby sold comps map
Loading sold comps map…
Walkable amenities ~0.75 mi
Loading nearby amenities…
Taxation est. · year 1
- Rental income
- $48,552
- − Mortgage interest
- −$21,006
- − Property taxes
- −$5,625
- − Insurance
- −$1,875
- − Repairs & maintenance
- −$3,884
- − Management
- −$3,884
- − Depreciation
- −$10,909
- Taxable income
- $1,369
- Est. tax owed @ 24.0%
- −$329
- After-tax cash flow
- $6,929/yr
For passive investors: Depreciation is non-cash, so a rental often shows a tax loss while cash-flowing — sheltering income. Rental losses are passive: they offset passive income freely, and up to $25,000/yr can offset ordinary (W-2) income if you actively participate and your MAGI is under $100k (phasing out to $0 by $150k); unused losses carry forward. On sale, claimed depreciation is recaptured at up to 25%, and gains may owe capital-gains tax (a 1031 exchange can defer both). Figures are a year-1 estimate at your 24.0% rate — not tax advice; consult a CPA.
Condition & rehab AI · 11 photos
This 4-unit property requires moderate renovations to improve its exterior, interior, and systems, significantly enhancing its resale and rental value.
Repairs flagged
- Major exterior siding — Severe weathering
- Major exterior paint — Peeling and fading
- Major flooring — Worn and outdated carpet
- Moderate kitchen cabinets — Old and dated design
- Moderate bathroom fixtures — Old and outdated design
Value-add opportunities
- Both Paint exterior — Enhances curb appeal and value
- Both Replace flooring — Improves living space and value
- Both Update kitchen cabinets — Modernizes space and value
- Both Update bathroom fixtures — Modernizes space and value
Renovation cost estimate screening
| Repair item | Severity | Est. cost |
|---|---|---|
| exterior siding · Severe weathering | Major | $15,000–50,000 |
| exterior paint · Peeling and fading | Major | $15,000–50,000 |
| flooring · Worn and outdated carpet | Major | $15,000–50,000 |
| kitchen cabinets · Old and dated design | Moderate | $3,000–15,000 |
| bathroom fixtures · Old and outdated design | Moderate | $3,000–15,000 |
| Total estimated repair cost · 5 items | $51,000–180,000 |
Value-add ROI direction
- Both Paint exterior — Enhances curb appeal and value ↑
- Both Replace flooring — Improves living space and value ↑
- Both Update kitchen cabinets — Modernizes space and value ↑
- Both Update bathroom fixtures — Modernizes space and value ↑
ⓘ Cost ranges are severity-bucket heuristics (US national rule-of-thumb). Get contractor quotes + a written scope before underwriting a rehab budget.
Schools (NCES district)
- District
- Lake Quinault School District
- NCES district ID
- 5307050
- Math proficiency
- 30% ▬ 0.00%
- Reading proficiency
- 35% ▲ 5.00%
- Median HH income
- $45,478
- Composite
- 30.57/100
- National rank
- #11467
- State rank
- #260 of 291 in WA
Livability — Neilton
- Score
- 57/100
- State rank
- #535
- US rank
- #22276
Category grades
Schools grade is shown separately in the Schools card above.
Census & demographics
- Census place
- Neilton, WA
- Population (ZIP)
- 207
Population outlook (Grays Harbor County) Hauer SSP2
- Today (2025)
- 66,443 people
- By 2030
- 63,255 · -4.8%
- By 2040
- 56,466 · -15.0%
- By 2050
- 50,516 · -24.0%
- By 2075
- 39,296 · -40.9%
- By 2100
- 31,142 · -53.1%
Race, ethnicity, and origin ACS 2023
- Neighborhood character
- Diverse neighborhood (Simpson 0.64)
- Race & ethnicity
- White 58% Two or more races 14% Hispanic / Latino 14% Native American 12%
- Hispanic origin (detail)
- Mexican 14%
- Common ancestry
- Iranian 5% Lithuanian 3% Slovak 2%
- Foreign-born
- 8% · Canada
- Languages at home
- 85% English-only · Spanish 15%
Political lean MEDSL · Grays Harbor
- 2024 margin
- Lean R (+6.0) · D 45.6% · R 51.6% · Other 2.8%
- 2008→2024 swing
- -20.6pp toward R · 2008: 14.6pp · 2024: -6.0pp
- All cycles
- 2024: R+6.0 2020: R+6.6 2016: R+7.1 2012: D+14.0 2008: D+14.6
Not yet ingested
- Civics
- —
Market trends
- HPI YoY
- —
- Current HPI
- —
- Rent YoY
- —
- Metro
- —
- State GDP YoY
- ▲ 4.65%
- F500 in state
- 22
Industry mix (Fortune 500 HQ in WA)
| Industry | F500 HQs | Revenue |
|---|---|---|
| Retail | 2 | $269B |
|
||
| Technology / Retail | 1 | $638B |
|
||
| Technology | 1 | $245B |
|
||
| Telecommunications | 1 | $38B |
|
||
| Food / Beverage | 1 | $36B |
|
||
| Automotive / Trucks | 1 | $34B |
|
||
Price history
+200.0% since first listed11 events — show timeline
- 2025-12-12 Relisted — NWMLS as Distributed by MLS Grid
- 2025-01-22 Price Changed $375,000 NWMLS as Distributed by MLS Grid
- 2024-10-08 Listed $395,000 NWMLS as Distributed by MLS Grid
- 2018-01-18 Sold (MLS) $140,000 NWMLS as Distributed by MLS Grid
- 2017-10-26 Pending — NWMLS as Distributed by MLS Grid
- 2017-10-04 Pending — NWMLS as Distributed by MLS Grid
- 2017-07-18 Relisted — NWMLS as Distributed by MLS Grid
- 2017-06-14 Delisted — NWMLS as Distributed by MLS Grid
- 2016-12-27 Listed $160,000 NWMLS as Distributed by MLS Grid
- 2005-05-06 Sold (MLS) $122,500 NWMLS as Distributed by MLS Grid
- 2005-01-10 Listed $125,000 NWMLS as Distributed by MLS Grid
Cash-flow waterfall
monthlySold comps — $/sqft
last 12 mo · ≤1 miLoading sold comps…