 🌊 Lakefront
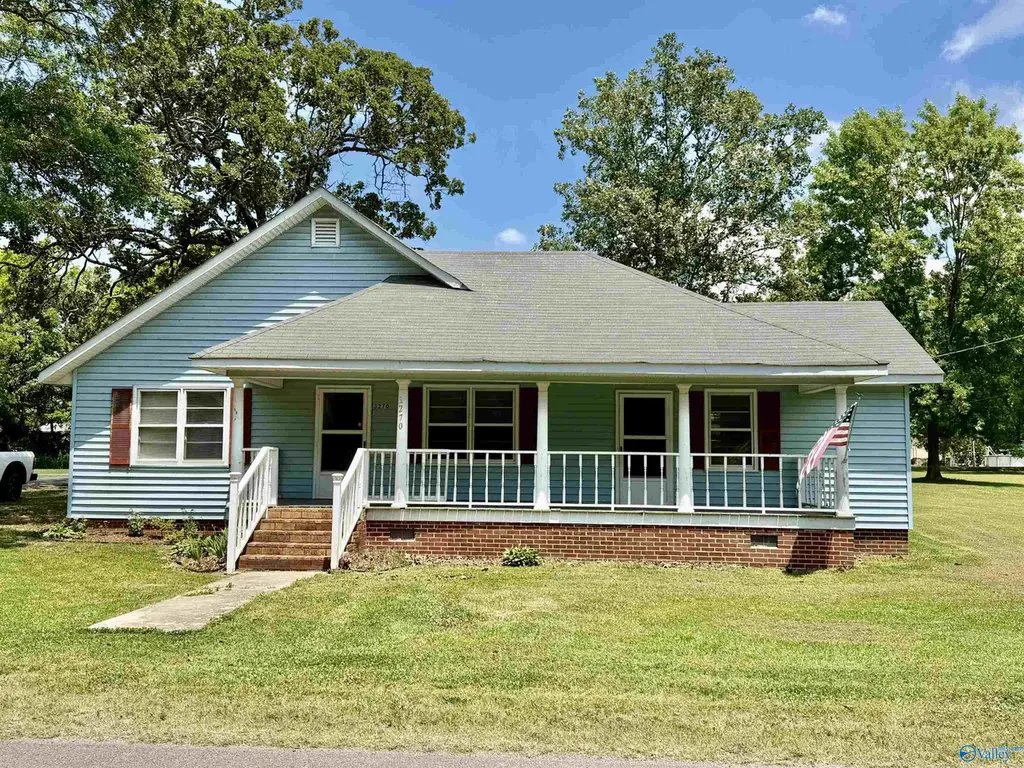
3270 Spring St · Cedar Bluff, AL
Flood risk 1/10 · Minimal
- FEMA flood zone
- X (unshaded)
- Chance of flooding over 30 yrs
- 0.0%
- Est. flood insurance / yr
- $507 – $1,088
Fire risk 4/10 · Minor
- Est. fire insurance / yr
- $916 – $1,700
Heat risk 6/10 · Moderate
- Hot days now (above 107°F)
- 7 days/yr
- Hot days in 30 yrs
- 19 days/yr
Wind risk 4/10 · Minor
- Chance of severe wind over 30 yrs
- 22.0%
Air-quality risk 2/10 · Minimal
- Unhealthy air days now
- 1 days/yr
- Unhealthy air days in 30 yrs
- 1 days/yr
Risk factors via First Street. Map © Google.
Why this score? — see what drove the C- grade
The composite is a weighted blend of 9 inputs, each scored 0–100. Each bar is that input's sub-score; the figure is the points it added to the 100-point composite (weight × sub-score).
- ARV discount +15.0/15.0
- Appreciation +10.0/10.0
- Cash flow +9.6/30.0
- Livability +3.2/5.0
- 1% rule +2.9/10.0
- DSCR +2.7/10.0
- Schools +2.7/10.0
- Rent growth +2.5/5.0
- Condition / age +2.5/5.0
$149,900
🖨 Deal sheet (PDF) 📄 Offer letter ✓ Due diligence
Listing remarks
Just listed a quaint home full of character and timeless appeal! What a treasure! Offering 3 bedrooms and 1 bath, this home features original hardwood floors, large living spaces, and vintage charm throughout. Situated on a beautiful . 65-acre corner lot, there’s plenty of room to relax, garden, or enjoy outdoor entertaining. Looking for a weekend getaway, investment property, or full-time residence near Weiss Lake? Enjoy being just minutes from the boat ramp and all the fun of lake living without paying lakefront prices. A rare opportunity with endless potential! Home is Being Sold "As Is"
Key facts
- Outdoor entertaining
- Beautiful corner lot
- Investment property
Tags
Property features AI
Finance
- Other: Lot size approximately 0.65 acres
- HOA & community: No homeowners association; Subdivision: Russell Survey
Exterior
- Parking: Detached garage
- Utilities: Public sewer
- Home design: Single family residence; One level; Built in 1930; Vinyl siding
- Construction: Vinyl siding construction; Built in 1930
- Exterior features: Detached building on property; Front porch; Corner lot; Park nearby; Public water
Interior
- Bathrooms: 1 full bathroom
- Heating & cooling: Natural gas heating; Window cooling
- Interior features: Crawl space basement
Neighborhood map
What this means for you Summary
Snapshot
- This is a 3-bed/1.0-bath single-family listed at $150k.
Deal economics
- At list price, monthly cash flow is $-102 ($-1k/yr) — negative.
- To cash-flow at today's rent, offer at most $135k (9.9% below list).
- To meet the 1% rule (rent ≥ 1% of price), the offer needs to be $118k (21.1% below list).
- Recommended offer: $118k (21.1% below list) — sets the bar for 1% rule.
- Cap rate 5.5% vs local median 0.9% in Cedar Bluff — top-decile yield for the area; either an underpriced asset or a hidden risk that comps aren't pricing in. Stress-test before assuming the spread holds.
Location & tenants
- Location reads 64/100 on livability (#152 in AL) — a middle-class / working-renter tenant base. Strengths: cost of living A+, housing A+; Watch: amenities F, commute F, employment F.
- Cherokee County (rural): math 21% / reading 45% proficiency, ranked #58 of 129 in AL (top 45%) — families likely to look elsewhere, expect single-tenant / working-renter base with shorter leases.
- Zoned schools: Centre Elementary School (math 28% / reading 54%, grade F, #233 of 627 statewide, top 38%, 647 students, 68% FRL); Centre Middle School (math 24% / reading 45%, grade F, #90 of 257 statewide, top 38%, 457 students, 74% FRL); Cherokee County High School (math 27% / reading 27%, grade F, #90 of 305 statewide, top 35%, 465 students, 63% FRL) — zoned schools average 68% FRL vs 53% district-wide (16 pts higher); higher-poverty schools than district average — tighter screening recommended.
- Market conditions: 253 active listings in the ZIP; 39 units permitted in Cherokee County in 2024 (0 in 5+ unit buildings).
Forward outlook
- In year one you build about $16k of equity ($1k loan paydown + $15k appreciation (10.0% local appreciation)).
- Cherokee County population projected at -17% by 2050 — secular population decline; favor cash flow + early exit over multi-decade hold.
- By year 3, paydown + projected appreciation supports a ~$41k cash-out refi (75% LTV) — recoverable capital for the next deal without selling this one.
Negotiation context
- It's been on market 34 days — a 3% lower offer ($145k) is reasonable based on typical stale-listing flexibility.
Risks & watch-outs
- Watch-outs: built in 1930 — expect roof / HVAC / electrical / plumbing capex.
- Climate carrying-cost: extreme-heat days projected 7→19/yr by 2055 (HVAC capex compounding) — expect insurance premiums to compound above CPI over the hold.
Questions for the listing agent
- What do current leases actually rent for vs. the listed asking? Can we see a recent rent roll and the last 12 months of T-12 income?
- It's been on market 34 days. Have you received any prior offers? Is the seller open to a 21% concession, seller financing, or rate buy-down credit?
- Built in 1930 — when were the roof, HVAC, electrical panel, plumbing, and water heater last replaced?
- Is there a deadline driving the sale (1031 exchange, divorce, estate, relocation)? That informs how much negotiation room exists.
- Schools are D-rated, which usually means shorter tenancies and higher turnover. Who's the typical renter profile here, and what's been the actual vacancy rate?
- This sits on a lake — are riparian / water-frontage rights deeded with the parcel? Any dock permits, shoreline easements, or HOA water-use restrictions?
- What's the documented flood / surge / shoreline-erosion history here (FEMA AND non-FEMA — e.g., storm surge, creek backup, septic-field saturation)?
- Any water-quality or seasonal algae-bloom issues that affect tenant satisfaction or short-term-rental demand?
- What's the average days-on-market for RENTAL listings here right now (not sales)? A rising rental-DOM trend means longer vacancies and softer asking-rent achievability than the comps imply.
- What's the recent tenant-quality profile in this submarket — average credit score on applications, eviction rate, late-payment / NSF rate, and stable-employment percentage? A property-management company in the area should have these aggregated.
- How much new for-sale + rental construction is in the pipeline within 1–3 miles? Heavy new supply typically softens prices + rents 12–24 months out; constrained supply supports both.
Investment metrics
- 1% rule
- 0.79% ✗
- Cap rate
- 5.48%
- Cash-on-cash
- -2.92%
- DSCR
- 0.87
- GRM
- 10.6
CMA / ARV
- ARV (on-the-fly)
- $238,984
- Comps found
- 2
Show comp detail 2 sales within ~0.75 mi
| Address | Dist | Beds/Ba | Sqft | Sold | Price | $/sf | Match |
|---|---|---|---|---|---|---|---|
| 2880 Moneys Bend Rd | 0.41mi | 3/2.0 | 2,040 (+12%) | 23mo | $129,000 | $63 | 38 |
| 3820 Railroad Ave | 0.54mi | 3/2.0 | 1,552 (-15%) | 24mo | $150,000 | $97 | 26 |
Match score weights: distance 35% · size 25% · config 20% · recency 20%. Top-matched comps best support the ARV.
Projected returns pro-forma
10.0% appreciation · 3.0% rent growth · sell at horizon
- IRR
- 22.2%
- Equity multiple
- 2.79×
- Total profit
- $75,156
- Equity at exit
- $135,042
- IRR
- 19.9%
- Equity multiple
- 6.40×
- Total profit
- $226,471
- Equity at exit
- $291,223
Cash invested: $41,972 (down + closing). Projections, not guarantees.
Landlord ↔ Tenant lean methodology
- Overall (STATE)
- 90 Strongly Landlord-Friendly
- State Alabama
- 90 Strongly Landlord-Friendly · R+15
- County
- — inherits STATE
- City
- — inherits STATE
ZIP-level market 35959
- Home prices YoY
- 6.8%
- Active inventory
- 253
- Price-to-rent
- 10.6×
Monthly cashflow live
- Estimated rent
- $1,182 medium interval (Pro) →
- Mortgage (P&I)
- −$786
- Tax est. 1.5%
- −$187 /mo · $2,248/yr
- Insurance
- −$62
- HOA
- −$0
- Vacancy / Maint / Mgmt
- −$248
- Net cashflow
- $-102
Break-even live
Sensitivity live
| Price | -10% $2 | -5% $-50 | +0% $-102 | +5% $-154 | +10% $-206 |
|---|---|---|---|---|---|
| Rent | -10% $-195 | -5% $-149 | +0% $-102 | +5% $-55 | +10% $-9 |
| Rate | -1.0pp $-27 | -0.5pp $-64 | base $-102 | +0.5pp $-141 | +1.0pp $-180 |
UW: 25.0% down · 7.5% · 30yr · 1.5% tax · 5.0% vac · 8.0% maint · 8.0% mgmt
Financing live
Cash to close
- Down payment
- $37,475
- Closing costs
- $4,497
- Reserves months
- —
- Total cash needed
- —
Loan-product check · same deal, 3 products live
Conventional
25% down · 7.5% · 30yr
- Down + closing
- —
- Monthly P&I
- —
- Monthly cashflow
- —
- DSCR
- —
- Eligible?
- —
Personal DTI + credit; lowest rate.
DSCR
20% down · 8.5% · 30yr
- Down + closing
- —
- Monthly P&I
- —
- Monthly cashflow
- —
- DSCR
- —
- Eligible?
- —
No personal income docs; deal must DSCR.
Hard money
10% down · 12.0% · 12mo
- Down + closing
- —
- Monthly P&I
- —
- Monthly cashflow
- —
- DSCR
- —
- Eligible?
- —
Short-term bridge; refi at stabilization.
Listing history 19 events
-
2026-06-21days on market $149,900 Active 34 DOM
-
2026-06-19days on market $149,900 Active 32 DOM
-
2026-06-18days on market $149,900 Active 31 DOM
-
2026-06-17days on market $149,900 Active 30 DOM
-
2026-06-16days on market $149,900 Active 29 DOM
-
2026-06-15days on market $149,900 Active 28 DOM
-
2026-06-14days on market $149,900 Active 26 DOM
-
2026-06-13days on market $149,900 Active 25 DOM
-
2026-06-10days on market $149,900 Active 23 DOM
-
2026-06-09days on market $149,900 Active 22 DOM
-
2026-06-08days on market $149,900 Active 21 DOM
-
2026-06-07days on market $149,900 Active 20 DOM
-
2026-06-05days on market $149,900 Active 17 DOM
-
2026-06-03days on market $149,900 Active 16 DOM
-
2026-06-02days on market $149,900 Active 15 DOM
-
2026-06-01days on market $149,900 Active 14 DOM
-
2026-05-31days on market $149,900 Active 13 DOM
-
2026-05-30days on market $149,900 Active 12 DOM
-
2026-05-18$149,900 Active
ⓘ Source: listings_history table (triggers on properties + properties_extension) + one-shot
backfill from property_details.listing_events for pre-trigger history.
Climate risk First Street
- Flood 1/10 Low FEMA zone X (unshaded) · 0% chance over 30 yrs
- Wildfire 4/10 Moderate
- Heat 6/10 Major 7 d/yr ≥107°F today · 19 d/yr by 30 yrs out
- Wind 4/10 Moderate 22% chance of damaging wind over 30 yrs
- Air quality 2/10 Low 1 unhealthy d/yr today · 1 by 30 yrs out
Nearby sold comps map
Loading sold comps map…
Walkable amenities ~0.75 mi
Loading nearby amenities…
Taxation est. · year 1
- Rental income
- $14,185
- − Mortgage interest
- −$8,397
- − Property taxes
- −$2,248
- − Insurance
- −$750
- − Repairs & maintenance
- −$1,135
- − Management
- −$1,135
- − Depreciation
- −$4,361
- Taxable loss
- −$3,840
- Est. tax savings @ 24.0%
- +$922
- After-tax cash flow
- $-303/yr
For passive investors: Depreciation is non-cash, so a rental often shows a tax loss while cash-flowing — sheltering income. Rental losses are passive: they offset passive income freely, and up to $25,000/yr can offset ordinary (W-2) income if you actively participate and your MAGI is under $100k (phasing out to $0 by $150k); unused losses carry forward. On sale, claimed depreciation is recaptured at up to 25%, and gains may owe capital-gains tax (a 1031 exchange can defer both). Figures are a year-1 estimate at your 24.0% rate — not tax advice; consult a CPA.
Schools (NCES district)
- District
- Cherokee County
- NCES district ID
- 0100630
- Math proficiency
- 21% ▼ -25.00%
- Reading proficiency
- 45% ▲ 4.00%
- Median HH income
- $37,824
- Composite
- 27.43/100
- National rank
- #6965
- State rank
- #58 of 129 in AL
Livability — Cedar Bluff
- Score
- 64/100
- State rank
- #152
- US rank
- #13868
Category grades
Schools grade is shown separately in the Schools card above.
Census & demographics
- Census place
- Cedar Bluff, AL
- Population (ZIP)
- 4,431
Population outlook (Cherokee County) Hauer SSP2
- Today (2025)
- 24,929 people
- By 2030
- 24,177 · -3.0%
- By 2040
- 22,411 · -10.1%
- By 2050
- 20,595 · -17.4%
- By 2075
- 17,025 · -31.7%
- By 2100
- 13,700 · -45.0%
Race, ethnicity, and origin ACS 2023
- Neighborhood character
- Predominantly White (91%)
- Race & ethnicity
- White 91% Black 5% Two or more races 4% Hispanic / Latino 2%
- Common ancestry
- Iranian 3% Slovak 1% Lithuanian 1%
- Foreign-born
- 1%
- Languages at home
- 99% English-only · French/Haitian/Cajun 1%
Political lean MEDSL · Cherokee
- 2024 margin
- Solid R (+75.5) · D 12.0% · R 87.5%
- 2008→2024 swing
- -24.3pp toward R · 2008: -51.2pp · 2024: -75.5pp
- All cycles
- 2024: R+75.5 2020: R+72.8 2016: R+69.4 2012: R+55.0 2008: R+51.2
Not yet ingested
- Civics
- —
Market trends
- HPI YoY
- ▲ 20.20%
- Current HPI
- 318.9
- Rent YoY
- —
- Metro
- —
- State GDP YoY
- ▲ 2.94%
- F500 in state
- 4
Industry mix (Fortune 500 HQ in AL)
| Industry | F500 HQs | Revenue |
|---|---|---|
| Financial Services | 1 | $8B |
|
||
| Healthcare | 1 | $5B |
|
||
Price history
1 event — show timeline
- 2026-05-18 Listed $149,900 VMLS
Cash-flow waterfall
monthlySold comps — $/sqft
last 12 mo · ≤1 miLoading sold comps…