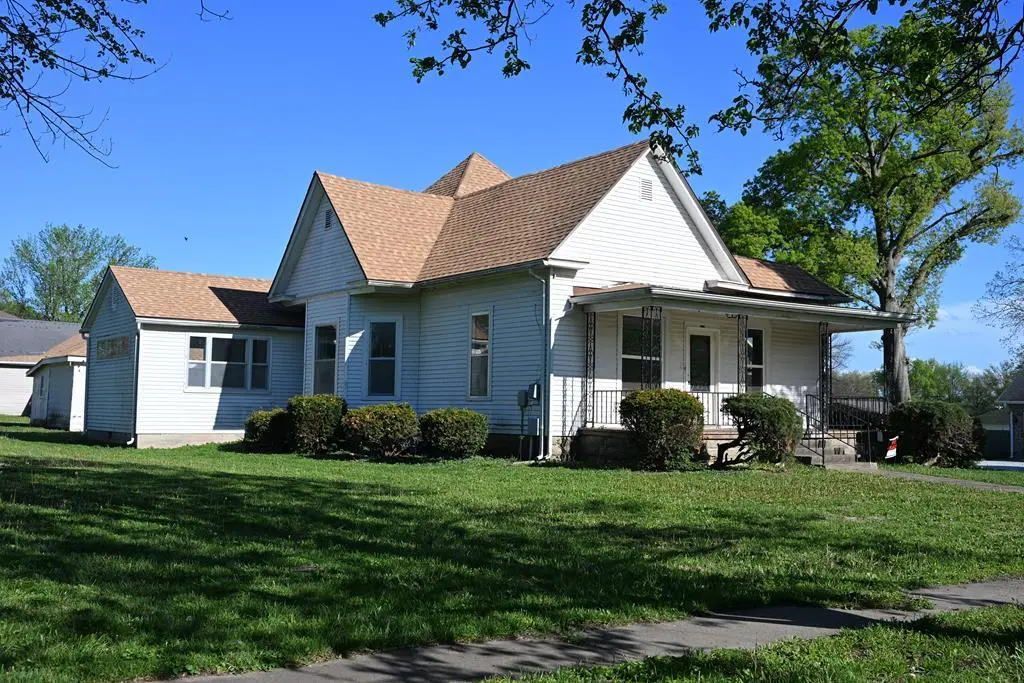
511 S Le Fevre Ave · Salisbury, MO
Flood risk 1/10 · Minimal
- FEMA flood zone
- X (unshaded)
- Chance of flooding over 30 yrs
- 0.0%
- Est. flood insurance / yr
- $507 – $1,088
Fire risk 3/10 · Minor
- Est. fire insurance / yr
- $1,054 – $1,958
Heat risk 4/10 · Minor
- Hot days now (above 106°F)
- 7 days/yr
- Hot days in 30 yrs
- 17 days/yr
Wind risk 2/10 · Minimal
- Chance of severe wind over 30 yrs
- —
Air-quality risk 1/10 · Minimal
- Unhealthy air days now
- 0 days/yr
- Unhealthy air days in 30 yrs
- 0 days/yr
Risk factors via First Street. Map © Google.
Why this score? — see what drove the C grade
The composite is a weighted blend of 9 inputs, each scored 0–100. Each bar is that input's sub-score; the figure is the points it added to the 100-point composite (weight × sub-score).
- Cash flow +19.2/30.0
- Appreciation +9.8/10.0
- ARV discount +7.5/15.0
- DSCR +6.0/10.0
- 1% rule +3.9/10.0
- Schools +3.2/10.0
- Livability +3.2/5.0
- Rent growth +2.5/5.0
- Condition / age +2.5/5.0
$147,500
🖨 Deal sheet (PDF) 📄 Offer letter ✓ Due diligence
Listing remarks
Charming Newly Renovated Bungalow in Salisbury Beautifully updated 3-bedroom, 1.5-bath home in a desirable neighborhood within the Salisbury R-IV School District. This move-in-ready bungalow features a spacious, modern kitchen with new appliances, ample cabinet space, and room for gatherings. Fresh renovations throughout blend comfort with classic charm. Enjoy a large yard, detached garage, good roof, and easy-access entry. Conveniently located near the city park, swimming pool, and downtown amenities. Perfect for first-time buyers, downsizing, or investment. Schedule your showing today!
Key facts
- Large yard
- Ample cabinet space
- Good roof
Tags
Property features AI
Finance
- Other: Property listed by Missouri Land and Farm LLC
Exterior
- Parking: Attached or detached garage with 1 garage space
- Utilities: Public water; Public sewer
- Home design: Single-family residence; Residential property
- Exterior features: Storm door(s)
Interior
- Bathrooms: 1 full bathroom; 1 half bathroom
- Interior features: Full basement; Storm door(s)
Neighborhood map
What this means for you Summary
Snapshot
- This is a 3-bed/1.5-bath other listed at $148k.
Deal economics
- At list price, monthly cash flow is $158 ($2k/yr) — positive.
- The deal already cash-flows at list — no discount required.
- To meet the 1% rule (rent ≥ 1% of price), the offer needs to be $131k (11.4% below list).
- Recommended offer: $131k (11.4% below list) — sets the bar for 1% rule.
Location & tenants
- Location reads 65/100 on livability (#285 in MO) — a middle-class / working-renter tenant base. Strengths: cost of living A+, housing A+, crime A-; Watch: employment D+, schools D, amenities F.
- Salisbury R-IV (rural): math 32% / reading 43% proficiency, ranked #186 of 324 in MO (top 57%) — families likely to look elsewhere, expect single-tenant / working-renter base with shorter leases.
- Market conditions: 4 active listings in the ZIP; 1 units permitted in Chariton County in 2024 (0 in 5+ unit buildings).
Forward outlook
- In year one you build about $15k of equity ($1k loan paydown + $14k appreciation (9.6% local appreciation)).
- Chariton County population projected at -24% by 2050 — secular population decline; favor cash flow + early exit over multi-decade hold.
- At projected returns (9.6% appreciation + 3.0% rent growth), your $41k cash investment doubles in ~3 years — after that, you're playing with house money.
- By year 3, paydown + projected appreciation supports a ~$38k cash-out refi (75% LTV) — recoverable capital for the next deal without selling this one.
Negotiation context
- Only 9 days on market — expect competitive offers; lowballing is unlikely to land.
Risks & watch-outs
- Watch-outs: built in 1956 — expect roof / HVAC / electrical / plumbing capex.
Questions for the listing agent
- Built in 1956 — when were the roof, HVAC, electrical panel, plumbing, and water heater last replaced?
- Is there a deadline driving the sale (1031 exchange, divorce, estate, relocation)? That informs how much negotiation room exists.
- Schools are D-rated, which usually means shorter tenancies and higher turnover. Who's the typical renter profile here, and what's been the actual vacancy rate?
- What's the average days-on-market for RENTAL listings here right now (not sales)? A rising rental-DOM trend means longer vacancies and softer asking-rent achievability than the comps imply.
- What's the recent tenant-quality profile in this submarket — average credit score on applications, eviction rate, late-payment / NSF rate, and stable-employment percentage? A property-management company in the area should have these aggregated.
- How much new for-sale + rental construction is in the pipeline within 1–3 miles? Heavy new supply typically softens prices + rents 12–24 months out; constrained supply supports both.
Investment metrics
- 1% rule
- 0.89% ✗
- Cap rate
- 7.58%
- Cash-on-cash
- 4.60%
- DSCR
- 1.20
- GRM
- 9.4
CMA / ARV
No comps found within radius.
Projected returns pro-forma
9.61% appreciation · 3.0% rent growth · sell at horizon
- IRR
- 26.8%
- Equity multiple
- 3.09×
- Total profit
- $86,444
- Equity at exit
- $128,721
- IRR
- 23.6%
- Equity multiple
- 6.94×
- Total profit
- $245,520
- Equity at exit
- $273,281
Cash invested: $41,300 (down + closing). Projections, not guarantees.
Landlord ↔ Tenant lean methodology
- Overall (STATE)
- 81 Strongly Landlord-Friendly
- State Missouri
- 81 Strongly Landlord-Friendly · R+10
- County
- — inherits STATE
- City
- — inherits STATE
ZIP-level market 65281
- Home prices YoY
- 7.5%
- Active inventory
- 4
- Price-to-rent
- 9.4×
Monthly cashflow live
- Estimated rent
- $1,307 medium interval (Pro) →
- Mortgage (P&I)
- −$774
- Tax from tax record
- −$39 /mo · $469/yr
- Insurance
- −$61
- HOA
- −$0
- Vacancy / Maint / Mgmt
- −$274
- Net cashflow
- $158
Break-even live
Sensitivity live
| Price | -10% $242 | -5% $200 | +0% $158 | +5% $117 | +10% $75 |
|---|---|---|---|---|---|
| Rent | -10% $55 | -5% $107 | +0% $158 | +5% $210 | +10% $262 |
| Rate | -1.0pp $233 | -0.5pp $196 | base $158 | +0.5pp $120 | +1.0pp $81 |
UW: 25.0% down · 7.5% · 30yr · 1.5% tax · 5.0% vac · 8.0% maint · 8.0% mgmt
Financing live
Cash to close
- Down payment
- $36,875
- Closing costs
- $4,425
- Reserves months
- —
- Total cash needed
- —
Loan-product check · same deal, 3 products live
Conventional
25% down · 7.5% · 30yr
- Down + closing
- —
- Monthly P&I
- —
- Monthly cashflow
- —
- DSCR
- —
- Eligible?
- —
Personal DTI + credit; lowest rate.
DSCR
20% down · 8.5% · 30yr
- Down + closing
- —
- Monthly P&I
- —
- Monthly cashflow
- —
- DSCR
- —
- Eligible?
- —
No personal income docs; deal must DSCR.
Hard money
10% down · 12.0% · 12mo
- Down + closing
- —
- Monthly P&I
- —
- Monthly cashflow
- —
- DSCR
- —
- Eligible?
- —
Short-term bridge; refi at stabilization.
Listing history 8 events
-
2026-06-21days on market $147,500 Active 9 DOM
-
2026-06-18days on market $147,500 Active 7 DOM
-
2026-06-17days on market $147,500 Active 6 DOM
-
2026-06-16days on market $147,500 Active 5 DOM
-
2026-06-15days on market $147,500 Active 4 DOM
-
2026-06-13days on market $147,500 Active 2 DOM
-
2026-06-12remarks 596-char remark
-
2026-06-12$147,500 Active 1 DOM
ⓘ Source: listings_history table (triggers on properties + properties_extension) + one-shot
backfill from property_details.listing_events for pre-trigger history.
Tax reassessment forecast MO · Resets to sale price
- Current annual tax
- $469 · $39/mo
- Projected year-2 tax
- $1,431 · $119/mo
- Expected delta
- +$962/yr (+$80/mo · 205.4%)
ⓘ Screening estimate from a state-policy table — verify with the county assessor before closing.
Climate risk First Street
- Flood 1/10 Low FEMA zone X (unshaded) · 0% chance over 30 yrs
- Wildfire 3/10 Moderate
- Heat 4/10 Moderate 7 d/yr ≥106°F today · 17 d/yr by 30 yrs out
- Wind 2/10 Low
- Air quality 1/10 Low 0 unhealthy d/yr today · 0 by 30 yrs out
Nearby sold comps map
Loading sold comps map…
Walkable amenities ~0.75 mi
Loading nearby amenities…
Taxation est. · year 1
- Rental income
- $15,683
- − Mortgage interest
- −$8,262
- − Property taxes
- −$469
- − Insurance
- −$738
- − Repairs & maintenance
- −$1,255
- − Management
- −$1,255
- − Depreciation
- −$4,291
- Taxable loss
- −$586
- Est. tax savings @ 24.0%
- +$141
- After-tax cash flow
- $2,042/yr
For passive investors: Depreciation is non-cash, so a rental often shows a tax loss while cash-flowing — sheltering income. Rental losses are passive: they offset passive income freely, and up to $25,000/yr can offset ordinary (W-2) income if you actively participate and your MAGI is under $100k (phasing out to $0 by $150k); unused losses carry forward. On sale, claimed depreciation is recaptured at up to 25%, and gains may owe capital-gains tax (a 1031 exchange can defer both). Figures are a year-1 estimate at your 24.0% rate — not tax advice; consult a CPA.
Schools (NCES district)
- District
- Salisbury R-IV
- NCES district ID
- 2927520
- Math proficiency
- 32% ▼ -1.00%
- Reading proficiency
- 43% ▲ 3.00%
- Median HH income
- $42,590
- Composite
- 31.67/100
- National rank
- #5927
- State rank
- #186 of 324 in MO
Livability — Salisbury
- Score
- 65/100
- State rank
- #285
- US rank
- #13249
Category grades
Schools grade is shown separately in the Schools card above.
Census & demographics
- Census place
- Salisbury, MO
- Population (ZIP)
- 3,076
Population outlook (Chariton County) Hauer SSP2
- Today (2025)
- 6,951 people
- By 2030
- 6,557 · -5.7%
- By 2040
- 5,860 · -15.7%
- By 2050
- 5,246 · -24.5%
- By 2075
- 4,168 · -40.0%
- By 2100
- 3,187 · -54.2%
Race, ethnicity, and origin ACS 2023
- Neighborhood character
- Predominantly White (95%)
- Race & ethnicity
- White 95% Black 3% Two or more races 2%
- Common ancestry
- Romanian 2% Slovak 2% Italian 2%
- Foreign-born
- 1%
- Languages at home
- 99% English-only · Other Indo-European 1%
Political lean MEDSL · Chariton
- 2024 margin
- Solid R (+56.4) · D 21.4% · R 77.8%
- 2008→2024 swing
- -43.5pp toward R · 2008: -12.8pp · 2024: -56.4pp
- All cycles
- 2024: R+56.4 2020: R+53.8 2016: R+52.0 2012: R+27.8 2008: R+12.8
Not yet ingested
- Civics
- —
Market trends
- HPI YoY
- ▲ 9.61%
- Current HPI
- 137.5124
- Rent YoY
- —
- Metro
- —
- State GDP YoY
- ▲ 1.84%
- F500 in state
- 20
Industry mix (Fortune 500 HQ in MO)
| Industry | F500 HQs | Revenue |
|---|---|---|
| Healthcare | 1 | $163B |
|
||
| Insurance | 1 | $21B |
|
||
| Industrial Technology | 1 | $17B |
|
||
| Retail | 1 | $16B |
|
||
| Industrial Distribution | 1 | $10B |
|
||
| Utilities | 1 | $9B |
|
||
Price history
2 events — show timeline
- 2026-06-11 Listed $147,500 NECAR
- 2015-11-13 Sold (Public Records) — Public Records
Property tax history
+0.6%/yrLatest (2025): $469 · -0.4% YoY. Source: county tax records.
Cash-flow waterfall
monthlySold comps — $/sqft
last 12 mo · ≤1 miLoading sold comps…