 🏷️ Likely Rental
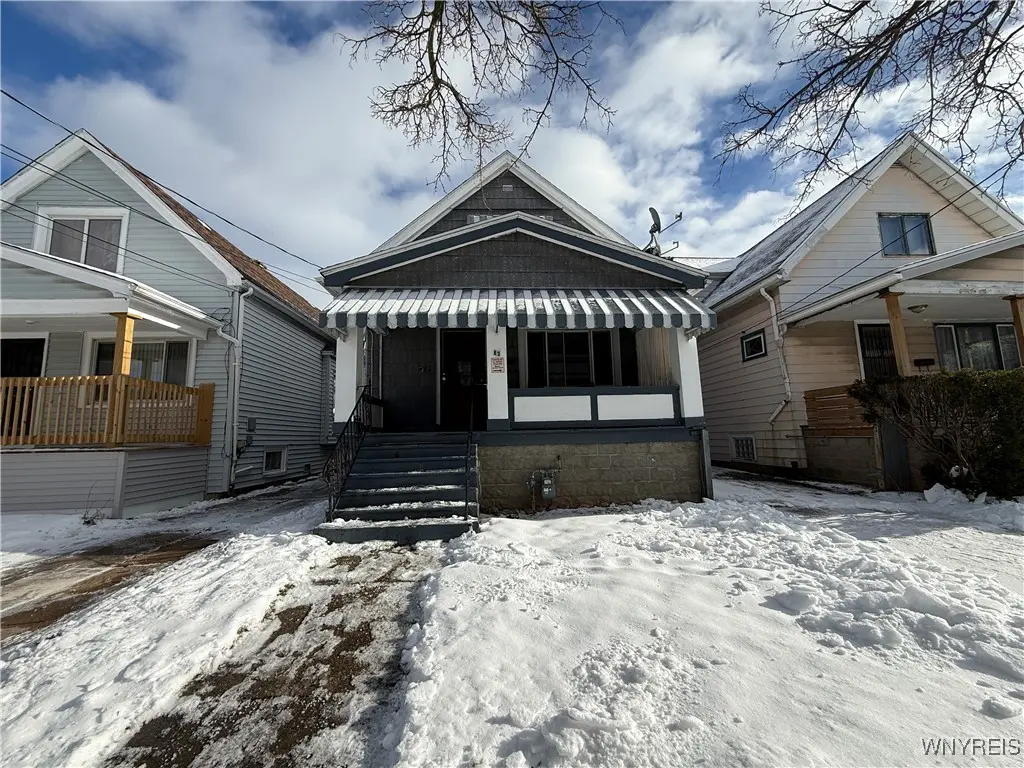
83 Fisher St · Buffalo, NY
Flood risk 5/10 · Moderate
- FEMA flood zone
- X (unshaded)
- Chance of flooding over 30 yrs
- 0.26%
- Est. flood insurance / yr
- $473 – $860
Fire risk 1/10 · Minimal
- Est. fire insurance / yr
- $691 – $1,283
Heat risk 3/10 · Minor
- Hot days now (above 93°F)
- 7 days/yr
- Hot days in 30 yrs
- 15 days/yr
Wind risk 1/10 · Minimal
- Chance of severe wind over 30 yrs
- —
Air-quality risk 3/10 · Minor
- Unhealthy air days now
- 2 days/yr
- Unhealthy air days in 30 yrs
- 3 days/yr
Risk factors via First Street. Map © Google.
Why this score? — see what drove the C+ grade
The composite is a weighted blend of 9 inputs, each scored 0–100. Each bar is that input's sub-score; the figure is the points it added to the 100-point composite (weight × sub-score).
- Cash flow +22.9/30.0
- ARV discount +15.0/15.0
- DSCR +7.4/10.0
- 1% rule +6.0/10.0
- Livability +3.9/5.0
- Schools +3.3/10.0
- Rent growth +2.7/5.0
- Condition / age +2.5/5.0
- Appreciation +0.0/10.0
$119,900
🖨 Deal sheet 📄 Offer letter ✓ Due diligence
Listing remarks MLS
Welcome to 83 Fisher Street in the City of Buffalo. This well-maintained single-family home offers three bedrooms and one full bathroom, making it an excellent opportunity for both owner-occupants and investors. The property is currently rented for $1,300 per month, providing immediate and consistent rental income. Interior features include carpeting throughout and solid mechanical systems, while the full basement offers additional storage and utility space. Exterior highlights include a detached garage for added convenience. Ideally located near public transportation, shopping, schools, and everyday amenities, this property delivers comfort, functionality, and long-term investment potential in a convenient Buffalo neighborhood Seller will provide the existing survey with an affidavit of no change and a 40-year search on the note.
Key facts
- Near shopping
- Full basement
- Well maintained
Tags
Neighborhood map
What this means for you Summary
Snapshot
- This is a 3-bed/1.0-bath single-family listed at $120k.
Deal economics
- At list price, monthly cash flow is $212 ($3k/yr) — positive.
- The deal already cash-flows at list — no discount required.
- Meets the 1% rule at list price ($1k rent vs $120k).
- Recommended offer: $106k (12.0% below list) — sets the bar for market timing.
Location & tenants
- Location reads 77/100 on livability (#195 in NY, #3,011 nationally) — a middle-class / working-renter tenant base. Strengths: commute A+, housing A+, health & safety A+; Watch: crime F, employment D-.
- Buffalo City School District (urban): math 41% / reading 40% proficiency, ranked #535 of 590 in NY (top 91%) — families likely to look elsewhere, expect single-tenant / working-renter base with shorter leases; 75% free/reduced lunch — lower-income household profile, screen leases tightly.
- Market conditions: Rents flat; 237 active listings in the ZIP; 19 comparable units currently listed for rent nearby; rentals lingering (median 44d on market — plan ~5-8 weeks vacancy on turnover, expect pricing pressure); 53% of comp listings sitting > 30 days — soft ceiling on asking rent; lower-income renter base — watch delinquency; 1,244 units permitted in Erie County in 2024 (563 in 5+ unit buildings).
- This rent runs 35% of the median local income ($45k/yr) — at the standard rent-burdened threshold; future hikes will face affordability resistance.
Forward outlook
- Local home prices are declining (-3.0%/yr); year-one equity from $829 of loan paydown is wiped out by about $4k of value loss. Plan a longer hold.
Negotiation context
- It's been on market 163 days — a 12% lower offer ($106k) is reasonable based on typical stale-listing flexibility.
- 2 sale attempts since 12y ago; this cycle's ask has dropped $15k (11%) from the opening price — seller is motivated, your offer sets the floor, not the list.
- Current owner paid $20k; list at $120k implies a 500% gain — meaningful room to come down on a strong offer.
Risks & watch-outs
- Watch-outs: built in 1922 — expect roof / HVAC / electrical / plumbing capex.
- Climate carrying-cost: moderate flood risk — expect insurance premiums to compound above CPI over the hold.
Questions for the listing agent
- It's been on market 163 days. Have you received any prior offers? Is the seller open to a 12% concession, seller financing, or rate buy-down credit?
- Built in 1922 — when were the roof, HVAC, electrical panel, plumbing, and water heater last replaced?
- Why hasn't it sold? Are there any deal-killer items the seller is aware of (foundation, flood, title, zoning, code violations)?
- Is there a deadline driving the sale (1031 exchange, divorce, estate, relocation)? That informs how much negotiation room exists.
- Crime grade is F in this area — have there been break-ins, vandalism, or insurance claims at this property in the last 3 years? What carrier currently insures it and at what premium?
- What's the average days-on-market for RENTAL listings here right now (not sales)? A rising rental-DOM trend means longer vacancies and softer asking-rent achievability than the comps imply.
- What's the recent tenant-quality profile in this submarket — average credit score on applications, eviction rate, late-payment / NSF rate, and stable-employment percentage? A property-management company in the area should have these aggregated.
- How much new for-sale + rental construction is in the pipeline within 1–3 miles? Heavy new supply typically softens prices + rents 12–24 months out; constrained supply supports both.
Investment metrics
- 1% rule
- 1.10% ✓
- Cap rate
- 8.41%
- Cash-on-cash
- 7.56%
- DSCR
- 1.34
- GRM
- 7.6
CMA / ARV
- ARV (median comp)
- $172,666
- List price
- $119,900
- Delta
- -30.56%
- Verdict
- UNDERPRICED
- Comps
- 20 within 1.0 mi
Show comp detail 12 sales within ~0.75 mi
| Address | Dist | Beds/Ba | Sqft | Sold | Price | $/sf | Match |
|---|---|---|---|---|---|---|---|
| 59 Fisher St | 0.05mi | 3/1.0 | 1,100 (+9%) | 1mo | $195,000 | $177 | 82 |
| 54 Andrews Ave | 0.24mi | 3/2.5 | 1,062 (+5%) | 4mo | $70,000 | $66 | 71 |
| 141 Hagen St | 0.35mi | 3/1.0 | 961 (-5%) | 8mo | $90,000 | $94 | 69 |
| 281 Roslyn Ave Ave | 0.46mi | 3/1.0 | 1,039 (+3%) | 8mo | $170,000 | $164 | 67 |
| 133 Freund St | 0.09mi | 3/2.0 | 1,143 (+13%) | 8mo | $130,000 | $114 | 63 |
| 87 Hagen St | 0.38mi | 3/1.0 | 1,121 (+11%) | 4mo | $120,000 | $107 | 60 |
| 219 Hagen St | 0.34mi | 3/1.0 | 893 (-12%) | 8mo | $90,000 | $101 | 58 |
| 42 Carol Dr | 0.42mi | 3/1.5 | 1,112 (+10%) | 5mo | $220,000 | $198 | 57 |
| 407 Pine Ridge Rd | 0.39mi | 3/1.0 | 1,130 (+12%) | 11mo | $210,000 | $186 | 53 |
| 149 David Ave | 0.67mi | 2/1.0 (-1) | 940 (-7%) | 8mo | $220,000 | $234 | 45 |
| 145 Hoerner Ave | 0.69mi | 2/1.0 (-1) | 1,112 (+10%) | 7mo | $190,000 | $171 | 40 |
| 68 Wecker St | 0.71mi | 4/2.0 (+1) | 1,148 (+14%) | 6mo | $180,000 | $157 | 31 |
Match score weights: distance 35% · size 25% · config 20% · recency 20%. Top-matched comps best support the ARV.
Projected returns pro-forma
-3.0% appreciation · 0.67% rent growth · sell at horizon
- IRR
- -7.4%
- Equity multiple
- 0.73×
- Total profit
- $-8,950
- Equity at exit
- $17,877
- IRR
- -1.1%
- Equity multiple
- 0.94×
- Total profit
- $-2,174
- Equity at exit
- $10,367
Cash invested: $33,572 (down + closing). Projections, not guarantees.
Landlord ↔ Tenant lean methodology
- Overall (STATE)
- 15 Strongly Tenant-Friendly
- State New York
- 15 Strongly Tenant-Friendly · D+10
- County
- — inherits STATE
- City
- — inherits STATE
ZIP-level market 14215
- Home prices YoY
- -30.0%
- Rents YoY
- 0.7%
- Active inventory
- 237
- Price-to-rent
- 7.6×
Monthly cashflow live
- Estimated rent
- $1,317 high interval (Pro) →
- Mortgage (P&I)
- −$629
- Tax est. 1.5%
- −$150 /mo · $1,798/yr
- Insurance
- −$50
- HOA
- −$0
- Vacancy / Maint / Mgmt
- −$277
- Net cashflow
- $212
Break-even live
UW: 25.0% down · 7.5% · 30yr · 1.5% tax · 5.0% vac · 8.0% maint · 8.0% mgmt
Financing live
Cash to close
- Down payment
- $29,975
- Closing costs
- $3,597
- Reserves months
- —
- Total cash needed
- —
Loan-product check · same deal, 3 products live
Conventional
25% down · 7.5% · 30yr
- Down + closing
- —
- Monthly P&I
- —
- Monthly cashflow
- —
- DSCR
- —
- Eligible?
- —
Personal DTI + credit; lowest rate.
DSCR
20% down · 8.5% · 30yr
- Down + closing
- —
- Monthly P&I
- —
- Monthly cashflow
- —
- DSCR
- —
- Eligible?
- —
No personal income docs; deal must DSCR.
Hard money
10% down · 12.0% · 12mo
- Down + closing
- —
- Monthly P&I
- —
- Monthly cashflow
- —
- DSCR
- —
- Eligible?
- —
Short-term bridge; refi at stabilization.
Rent comps 19 comps
| Address | Beds | Baths | Sqft | Rent | $/sqft | DOM | Units | Dist |
|---|---|---|---|---|---|---|---|---|
| 61 Courtland Ave Unit Lower Buffalo, NY | 2.0 | 1.0 | 1000 | $1,300 | $1.30 | 43d | 1 | 0.30mi |
| 50 Pine Ridge Ter Unit 3 Cheektowaga, NY | 2.0 | 1.0 | 900 | $1,400 | $1.56 | 17d | 1 | 0.33mi |
| 249 Newburgh Ave Unit 2 Buffalo, NY | 2.0 | 1.0 | 930 | $1,300 | $1.40 | 43d | 1 | 0.40mi |
| 56 Hagen St #2 Buffalo, NY | 2.0 | 1.0 | 850 | $950 | $1.12 | 43d | 1 | 0.43mi |
| 160 Courtland Ave Buffalo, NY | 2.0 | 1.0 | 810 | $1,025 | $1.27 | 14d | 1 | 0.43mi |
| 103 Preston Rd Unit Lower Cheektowaga, NY | 2.0 | 1.0 | 882 | $1,300 | $1.47 | 3d | 1 | 0.49mi |
| 85 Blake St Unit 1 Buffalo, NY | 4.0 | 2.0 | 1022 | $1,000 | $0.98 | 43d | 1 | 0.56mi |
| 11 Kaufman Dr Buffalo, NY | 2.0 | 1.0 | 900 | $1,500 | $1.67 | 43d | 1 | 0.71mi |
| 17 Proctor Ave Unit 1 Buffalo, NY | 2.0 | 1.0 | 900 | $1,100 | $1.22 | 43d | 1 | 0.76mi |
| 67 Moeller St Unit UPPER Buffalo, NY | 3.0 | 1.0 | 960 | $1,000 | $1.04 | 3d | 1 | 0.84mi |
| 67 Moeller St Unit LOWER Buffalo, NY | 3.0 | 1.0 | 960 | $1,200 | $1.25 | 23d | 1 | 0.84mi |
| 24 Euclid Ave Buffalo, NY | 3.0 | 2.0 | 1150 | $1,700 | $1.48 | 43d | 1 | 0.85mi |
| 74 Dorris Ave Buffalo, NY | 3.0 | 1.0 | 1200 | $1,450 | $1.21 | 43d | 1 | 0.86mi |
| 143 Reo Ave Buffalo, NY | 3.0 | 2.0 | 1143 | $1,600 | $1.40 | 11d | 1 | 0.88mi |
| 1202 Walden Ave Unit 3 Buffalo, NY | 3.0 | 1.0 | 1500 | $1,400 | $0.93 | 17d | 1 | 0.99mi |
| 1202 Walden Ave Unit 2 Buffalo, NY | 3.0 | 1.0 | 800 | $1,350 | $1.69 | 43d | 1 | 0.99mi |
| 97 Davidson Ave Buffalo, NY | 3.0 | 1.0 | 925 | $1,495 | $1.62 | 1d | 1 | 1.27mi |
| 2935 Genesee St Unit Up Buffalo, NY | 2.0 | 1.0 | 1400 | $1,400 | $1.00 | 10d | 1 | 1.28mi |
| 90 Sussex St Unit 2 Buffalo, NY | 2.0 | 1.0 | 1000 | $1,000 | $1.00 | 43d | 1 | 1.36mi |
Listing history 19 events
-
2026-06-18days on market $119,900 Active 163 DOM
-
2026-06-17days on market $119,900 Active 162 DOM
-
2026-06-16days on market $119,900 Active 161 DOM
-
2026-06-15days on market $119,900 Active 160 DOM
-
2026-06-13days on market $119,900 Active 158 DOM
-
2026-06-13days on market $119,900 Active 157 DOM
-
2026-06-10days on market $119,900 Active 155 DOM
-
2026-06-09days on market $119,900 Active 154 DOM
-
2026-06-08days on market $119,900 Active 153 DOM
-
2026-06-07pricedays on market $119,900 Active 152 DOM
-
2026-06-03days on market $133,900 Active 148 DOM
-
2026-06-02days on market $133,900 Active 147 DOM
-
2026-06-01days on market $133,900 Active 146 DOM
-
2026-05-31days on market $133,900 Active 145 DOM
-
2026-04-16price $133,900 845-char remark
Show marketing remark (845 chars)
Welcome to 83 Fisher Street in the City of Buffalo. This well-maintained single-family home offers three bedrooms and one full bathroom, making it an excellent opportunity for both owner-occupants and investors. The property is currently rented for $1,300 per month, providing immediate and consistent rental income. Interior features include carpeting throughout and solid mechanical systems, while the full basement offers additional storage and utility space. Exterior highlights include a detached garage for added convenience. Ideally located near public transportation, shopping, schools, and everyday amenities, this property delivers comfort, functionality, and long-term investment potential in a convenient Buffalo neighborhood Seller will provide the existing survey with an affidavit of no change and a 40-year search on the note.
-
2026-02-21price $134,400 845-char remark
Show marketing remark (845 chars)
Welcome to 83 Fisher Street in the City of Buffalo. This well-maintained single-family home offers three bedrooms and one full bathroom, making it an excellent opportunity for both owner-occupants and investors. The property is currently rented for $1,300 per month, providing immediate and consistent rental income. Interior features include carpeting throughout and solid mechanical systems, while the full basement offers additional storage and utility space. Exterior highlights include a detached garage for added convenience. Ideally located near public transportation, shopping, schools, and everyday amenities, this property delivers comfort, functionality, and long-term investment potential in a convenient Buffalo neighborhood Seller will provide the existing survey with an affidavit of no change and a 40-year search on the note.
-
2026-01-06$134,900 Active 845-char remark
Show marketing remark (845 chars)
Welcome to 83 Fisher Street in the City of Buffalo. This well-maintained single-family home offers three bedrooms and one full bathroom, making it an excellent opportunity for both owner-occupants and investors. The property is currently rented for $1,300 per month, providing immediate and consistent rental income. Interior features include carpeting throughout and solid mechanical systems, while the full basement offers additional storage and utility space. Exterior highlights include a detached garage for added convenience. Ideally located near public transportation, shopping, schools, and everyday amenities, this property delivers comfort, functionality, and long-term investment potential in a convenient Buffalo neighborhood Seller will provide the existing survey with an affidavit of no change and a 40-year search on the note.
-
2015-02-13soldstatus $20,000 208-char remark
Show marketing remark (208 chars)
OWNER OCCUPANTS AND INVESTORS ALIKE! THIS IS A MUST SEE 3 POSSIBLY 4 BEDROOM HOME WITH PLENTY OF NATURAL WOODWORK. ATTIC IS FINISHED. DON'T PASS THIS ONE BY, WELL WORTH THE LOOK! SOLD 'AS IS'! BRING OFFERS!!!
-
2014-10-07$24,900 208-char remark
Show marketing remark (208 chars)
OWNER OCCUPANTS AND INVESTORS ALIKE! THIS IS A MUST SEE 3 POSSIBLY 4 BEDROOM HOME WITH PLENTY OF NATURAL WOODWORK. ATTIC IS FINISHED. DON'T PASS THIS ONE BY, WELL WORTH THE LOOK! SOLD 'AS IS'! BRING OFFERS!!!
ⓘ Source: listings_history table (triggers on properties + properties_extension) + one-shot
backfill from property_details.listing_events for pre-trigger history.
Climate risk First Street
- Flood 5/10 Major FEMA zone X (unshaded) · 26% chance over 30 yrs
- Wildfire 1/10 Low
- Heat 3/10 Moderate 7 d/yr ≥93°F today · 15 d/yr by 30 yrs out
- Wind 1/10 Low
- Air quality 3/10 Moderate 2 unhealthy d/yr today · 3 by 30 yrs out
Nearby sold comps map
Loading sold comps map…
Walkable amenities ~0.75 mi
Loading nearby amenities…
Taxation est. · year 1
- Rental income
- $15,800
- − Mortgage interest
- −$6,716
- − Property taxes
- −$1,798
- − Insurance
- −$600
- − Repairs & maintenance
- −$1,264
- − Management
- −$1,264
- − Depreciation
- −$3,488
- Taxable income
- $670
- Est. tax owed @ 24.0%
- −$161
- After-tax cash flow
- $2,378/yr
For passive investors: Depreciation is non-cash, so a rental often shows a tax loss while cash-flowing — sheltering income. Rental losses are passive: they offset passive income freely, and up to $25,000/yr can offset ordinary (W-2) income if you actively participate and your MAGI is under $100k (phasing out to $0 by $150k); unused losses carry forward. On sale, claimed depreciation is recaptured at up to 25%, and gains may owe capital-gains tax (a 1031 exchange can defer both). Figures are a year-1 estimate at your 24.0% rate — not tax advice; consult a CPA.
Schools (NCES district)
- District
- Buffalo City School District
- NCES district ID
- 3605850
- Math proficiency
- 41% ▲ 11.00%
- Reading proficiency
- 40% ▲ 7.00%
- Median HH income
- $31,665
- Composite
- 33.17/100
- National rank
- #5544
- State rank
- #535 of 590 in NY
Livability — Buffalo
- Score
- 77/100
- State rank
- #195
- US rank
- #3011
Category grades
Schools grade is shown separately in the Schools card above.
Census & demographics
- Census place
- Buffalo, NY
- County
- Erie County · 714,559 people
- City population
- 440,021
- Metro
- Buffalo-Cheektowaga, NY
- Population (ZIP)
- 42,524
- Household income
- $44,955
- Rent vs Own
- Severe rent burden
- 2873.0
Population outlook (Erie County) Hauer SSP2
- Today (2025)
- 933,037 people
- By 2030
- 935,181 · +0.2%
- By 2040
- 928,531 · -0.5%
- By 2050
- 905,725 · -2.9%
- By 2075
- 834,037 · -10.6%
- By 2100
- 708,033 · -24.1%
Race, ethnicity, and origin ACS 2023
- Neighborhood character
- Predominantly Black (67%)
- Race & ethnicity
- Black 67% White 15% Asian 7% Hispanic / Latino 6% Two or more races 6%
- Hispanic origin (detail)
- Puerto Rican 4%
- Common ancestry
- Romanian 4% Lithuanian 1% Italian 1%
- Foreign-born
- 9% · Canada, China
- Languages at home
- 88% English-only · Other Indo-European 4% Spanish 4% Chinese 1%
Political lean MEDSL · Erie
- 2024 margin
- Lean D (+9.7) · D 54.8% · R 45.2%
- 2008→2024 swing
- -7.9pp toward R · 2008: 17.5pp · 2024: 9.7pp
- All cycles
- 2024: D+9.7 2020: D+14.7 2016: D+4.8 2012: D+15.6 2008: D+17.5
Not yet ingested
- Civics
- —
Market trends
- HPI YoY
- ▼ -126.29%
- Current HPI
- 295.2966
- Rent YoY
- ▲ 0.67%
- Metro
- Buffalo-Cheektowaga, NY
- State GDP YoY
- ▲ 2.60%
- F500 in state
- 92
Industry mix (Fortune 500 HQ in NY)
| Industry | F500 HQs | Revenue |
|---|---|---|
| Financial Services | 10 | $950B |
|
||
| Consumer Goods | 9 | $162B |
|
||
| Insurance | 4 | $225B |
|
||
| Telecommunications | 2 | $144B |
|
||
| Pharmaceuticals | 2 | $112B |
|
||
| Media / Entertainment | 2 | $69B |
|
||
Price history
+437.8% since first listed5 events — show timeline
- 2026-04-16 Price Changed $133,900 WNYREIS
- 2026-02-21 Price Changed $134,400 WNYREIS
- 2026-01-06 Listed $134,900 WNYREIS
- 2015-02-13 Sold (MLS) $20,000 WNYREIS
- 2014-10-07 Listed $24,900 WNYREIS
Property tax history
+1.0%/yrLatest (2025): $235 · +0.0% YoY. Source: county tax records.
Cash-flow waterfall
monthlySold comps — $/sqft
last 12 mo · ≤1 miLoading sold comps…